

Abstract
We used multidimensional scaling (MDS) to characterize the integrative neural mechanisms during viewing and subsequently copying nine geometrical shapes. Human subjects initially looked at a central fixation point (“rest” period), then looked at a geometrical shape (“visual” period) which they copied without visual feedback (“copying” period). BOLD signal was recorded from voxels in 28 cortical areas (14 from each hemisphere) using a 4 Tesla magnet. For each voxel, signal ratios of “Visual versus Rest” (VR), and “Copy versus Visual” (CV) were calculated and used to construct two sets of Euclidean distance dissimilarity matrices for the nine shapes, with separate matrices defined for each region of interest (ROI) across subjects. The relations of perceptual and motor aspects of the shapes to MDS dimensions and specific ROIs were assessed using stepwise multiple regressions. The optimal individually scaled (INDSCAL) solutions were 2-dimensional. For the VR condition, MDS dimensions were significantly associated with the presence of crossing in a shape (Dimension 1), and with perimeter, height, cycles, peak segment speed, and horizontal symmetry (Dimension 2). ROIs most prominently associated with these dimensions essentially comprised the medial frontal lobe bilaterally, the inferior frontal gyrus bilaterally, and the left intraparietal sulcus (Dimension 1), and visual areas, including the calcarine sulcus and cuneus bilaterally (Dimension 2). These results document the expected involvement of visual areas and support the hypothesis advanced on the basis of previous findings (Lewis et al. 2003a) that a motor rehearsal of the upcoming shape copying is occurring during this visual presentation period. For the CV condition, practically one motor feature (number of segments drawn) dominated both dimensions, with a secondary engagement of horizontal symmetry in Dimension 1. The right postcentral gyrus, right intraparietal sulcus, right superior parietal lobule and right inferior parietal lobule contributed mostly to Dimension 1; the superior frontal gyrus bilaterally, right middle frontal gyrus, left postcentral gyrus, left inferior parietal lobule contributed mostly to Dimension 2; and the left superior parietal lobule and left intraparietal sulcus contributed to both dimensions approximately equally. CV BOLD activation of ROIs contributing to Dimension 1 (or to both dimensions) was significantly associated with the number of shape segments drawn. Since the direction of movement differs in successively drawn shape segments, the number of segments (minus one) equals the number of changes in the direction of movement. We conclude that this fundamental spatial motor aspect of drawing geometrical shapes is the critical variable, independent of the particular shape drawn, that dominates cortical activation during copying.
Keywords: Fmri, Multidimensional scaling, Copying, Cerebral cortex
Introduction
Copying is an elementary motor task that has been associated with such fundamental motor acts as writing and the production of movement sequences (Averbeck et al. 2002; Viviani and Terzuolo 1982). Because it is a sensitive indicator of brain damage, copying is one of the oldest and most frequently used tests in clinical neurology (Osterrieth 1944; Poppelreuter 1917; Rey 1941). Impaired copying, without obvious sensory or motor disturbances, is an indicator of constructional apraxia (Kleist 1934). Although the neuropsychological literature has emphasized the role of the posterior parietal cortex in constructional apraxia, damage to other areas of the brain, such as the frontal lobe, can impair copying (Luria and Tsvetkova 1964; Pillon 1981). Controversies have arisen regarding the specific deficits in patients with impaired copying (e.g., deficits in perception, movement programming, spatial cognition, etc.) and the hemispheric specialization with respect to more qualitative attributes of copying, such as executive functions (generally attributed to the left hemisphere) and global or spatial functions (generally attributed to the right hemisphere) (Gainotti 1985). Recent neuropsychological research has attempted to address these issues (Laeng 2006).
In the healthy brain, research from neurophysiology and neuroimaging has shown that copying or drawing is associated with a number of brain areas, including the primary motor cortex (Schwartz 1994), prefrontal cortex (Averbeck et al. 2003a, b), and posterior parietal cortex (Averbeck et al. 2005; Makuuchi et al. 2003). The role of each one of these areas in forming the final motor output is, however, difficult to disentangle; detailed studies in non-human primates using single unit recording typically focus on one or two cortical areas for a given task. Imaging studies have been able to highlight relevant areas (Suchan et al. 2002; Turner et al. 1998) but have been less illustrative of how those areas associate in producing the observed behavior. Furthermore, it is unclear how different motor strategies may be engaged in the production of motor behaviors of the same order (such as copying shapes) but differing in their specific aspects (such as the presence of curvature or upward pointing angles). Here, we used individual scaling MDS (INDSCAL) (Carroll and Chang 1970) to define the nature of the interactions among cortical areas during looking at and copying geometrical shapes without visual feedback (Lewis et al. 2003a). We selected this method for the following two reasons. First, unlike techniques such as factor analysis, the solutions generated by INDSCAL are not rotatable and thus lend themselves to unique interpretation. And, second, in addition to the creation of a reduced-dimension space representing the relations among the geometrical shapes copied, the method allows for the evaluation of the individual contribution of the different cortical areas potentially involved. In fact, our main objectives were to find out (1) which were the most influential aspects of the shapes copied in defining the derived MDS dimensions, and (2) how those aspects related to specific cortical areas demarcated as ROIs.
Materials and methods
The data for this analysis are a subset of a larger dataset (Lewis et al. 2003a). Details of data acquisition are given in that paper and summarized briefly below. Out of 20 subjects in the original study (Lewis et al. 2003a), data from 15 subjects were available for the present analyses; data from 5 subjects were unavailable due to technical reasons unrelated to this analysis.
Subjects
A total of 15 healthy, right-handed (Oldfield 1971) human subjects [8 men and 7 women, age (mean ± SD) 28.6 ± 6.9 and 24.7 ± 7.4 years, respectively] participated in these experiments as paid volunteers. The study protocol was approved by the University of Minnesota Institutional Review Board and informed consent was obtained from all subjects prior to the study according to the Declaration of Helsinki.
Stimuli and tasks
Stimuli were presented to subjects via a rear-projection screen and a mirror attached to the top of the head-gradient set. The stimuli were nine geometrical shapes (Fig. 1) possessing approximately the same surface area and subtending ~5 degree of visual angle. They were selected to cover a variety of features, such as the presence or absence of curves, different number of sides, different orientations of the same shape (e.g., square and diamond), and qualitatively distinct shapes (e.g., lemniscate and vertical trapezoid). These features were quantified using 12 measures shown in Table 1. In addition, motor performance was quantified using 6 measures (see Lewis et al. 2003a, b for details of calculating those measures), as shown in Table 2.
Fig. 1.
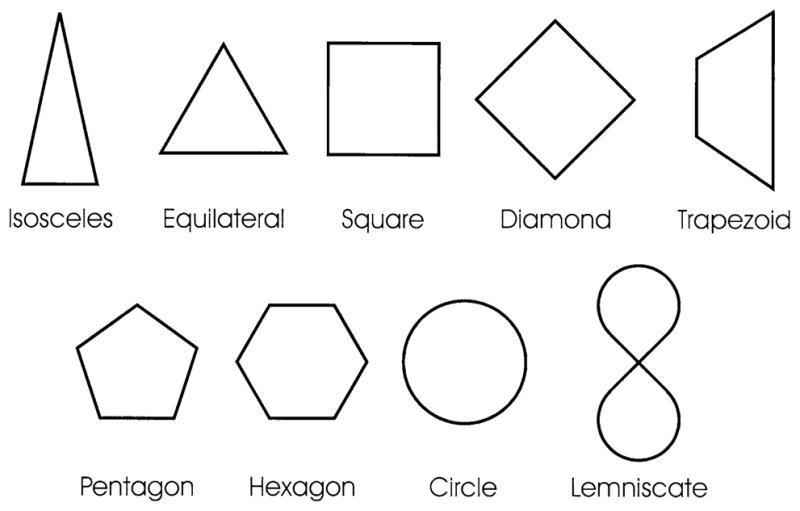
The nine shapes used
Table 1.
Features of shapes used (see Fig. 1)
| Shape | A | E | C | CR | P | H | MW | H/W | VS | HS | DS | O |
|---|---|---|---|---|---|---|---|---|---|---|---|---|
| Equilateral | 3 | 1 | 0 | 0 | 4.56 | 1.32 | 1.52 | 0.868 | 1 | 0 | 2 | 0 |
| Isosceles | 3 | 0 | 0 | 0 | 5.035 | 1.93 | 1.035 | 1.864 | 1 | 0 | 0 | 0 |
| Square | 4 | 1 | 0 | 0 | 4 | 1 | 1 | 1 | 1 | 1 | 2 | 0 |
| Diamond | 4 | 1 | 0 | 0 | 4 | 1.41 | 1.41 | 1 | 1 | 1 | 2 | 1 |
| Trapezoid | 4 | 0 | 0 | 0 | 4.83 | 2.12 | 0.71 | 2.985 | 0 | 1 | 0 | 1 |
| Pentagon | 5 | 1 | 0 | 0 | 3.81 | 1.17 | 1.22 | 0.959 | 1 | 0 | 4 | 0 |
| Hexagon | 6 | 1 | 0 | 0 | 3.72 | 1.11 | 1.24 | 0.895 | 1 | 1 | 2 | 0 |
| Circle | 0 | 0 | 1 | 0 | 3.54 | 1.13 | 1.13 | 1 | 1 | 1 | 0 | 0 |
| Lemniscate | 0 | 0 | 1 | 1 | 5.18 | 1.87 | 0.77 | 2.428 | 1 | 1 | 0 | 0 |
A number of angles, E all sides equal in length (1), C presence of curvature (1), CR presence of crossing (1), P perimeter, H height, MW maximum width (P, H and MW in arbitrary units), H/W ratio of height over width, VS presence of vertical symmetry, HS presence of horizontal symmetry, DS presence of diagonal symmetry, O orientation (1 denotes shapes with angles pointing up and down)
Table 2.
Descriptive statistics for motor parameters derived from copying during the 45 s task period
| Shape | Cycles | NS | ASL | APSS | APASA | AIAC |
|---|---|---|---|---|---|---|
| Equilateral | 16 | 52.9 | 3.0 | 7.8 | 27.2 | 114.8 |
| Isosceles | 15.4 | 55.3 | 3.2 | 8.0 | 27.0 | 109.4 |
| Square | 12.6 | 56.5 | 2.6 | 7.4 | 25.7 | 88.4 |
| Diamond | 11.8 | 54.6 | 2.5 | 6.9 | 24.1 | 89.1 |
| Trapezoid | 10.4 | 49.8 | 2.4 | 6.3 | 21.3 | 89.8 |
| Pentagon | 10 | 56.8 | 2.1 | 6.4 | 22.7 | 72.7 |
| Hexagon | 8.9 | 62.7 | 1.7 | 5.7 | 21.8 | 64.9 |
| Circle | 22.1 | 80.3 | 2.7 | 7.3 | 29.5 | 103.8 |
| Lemniscate | 12.8 | 80.0 | 2.4 | 6.2 | 23.3 | 98.1 |
Numbers are means of the following measures: Cycles number of shapes copied, NS number of shape segments copied, ASL average length (cm) of segments copied, APSS average peak speed (cm/s) per segment copied, APASA average peak absolute acceleration (cm/s2) per segment copied, AIAC average intersegment angular change (degree) between successively copied segments
N = 15 subjects per shape
Subjects performed three 45-s tasks for each shape in consecutive order. In the first task, they fixated a blue spot of light in the center of a black screen; in the second task, the light changed to red and a single white shape appeared around it; and in the third task, the light changed to green (a “go” signal) and the subjects drew the shape continuously by moving an X–Y joystick with their right hand (see Fig. 5 in Lewis et al. 2003a, b for examples of trajectories drawn). Subjects were instructed to fixate the spot of light during all tasks and to copy the shapes counterclockwise at their own speed during the copying task; no visual feedback was provided. The same sequence (fixation, visual presentation, copying) was repeated for each of the nine shapes, which were shown in a random order; separate randomization was done for each subject. The experiment was controlled by a personal computer.
The coordinates of the joystick position during the performance of the task were recorded with a sampling rate of 100 Hz. The x(t), y(t) components of the movement trajectories as a function of time t were computed using a cubic spline smoothing algorithm implemented in the IMSL Math Library Package (Visual Numerics, Houston, TX).
Volume acquisition
A four Tesla whole-body system with head gradients and a homogeneous radio frequency coil [Oxford (Oxford, UK)/Varian (Palo Alto, CA, USA)/Siemens (Erlangen, Germany)] was used. A head support system with foam pads was used to minimize head movements during the experiment. Multi-slice axial, sagittal, and coronal anatomic images (T1-weighted) were obtained using a turbo-FLASH sequence with 5 mm slice thickness and in-plane spatial resolution of 1.55 × 1.55 mm. For functional imaging, a T2*-weighted, single-shot echo-planar imaging (EPI) sequence was employed (TE = 25 ms). Imaging planes were axial, with 5 mm slice thickness and in-plane spatial resolution of 3.11 × 3.11 mm. In total, 25–29 slices were collected, covering the whole brain. The acquisition time for a single slice was 100 ms; for a complete multi-slice volume, the repetition time was 3.0 s. Images were collected continuously during the experiment. The duration of each study was 20 min and 15 s. In total, 405 multi-slice volumes were collected in each experiment (15 during each task) per subject. The fMRI analysis package STIMULATE (Strupp 1996, version 6.0.1, Center for Magnetic Resonance Research, University of Minnesota Medical School, Minneapolis, MN) was used to process the fMRI images. This paper reports the results of a MDS analysis of the patterns of BOLD activation in selected cortical areas (see below); a previous paper reported results from the cerebellum (Lewis et al. 2003a).
ROIs
Based on brain anatomy (pattern of sulci and gyri), regions of interest (ROI) were drawn on the multislice anatomical images. The following criteria were used to demarcate ROIs.
The superior frontal gyrus is defined anteriorly by the frontomarginal sulcus, posteriorly by the precentral sulcus, laterally by the superior frontal sulcus, and medially by the interhemispheric fissure. The middle frontal gyrus is defined anteriorly by the frontomarginal sulcus, posteriorly by the precentral sulcus, laterally by the inferior frontal sulcus, and medially by the superior frontal sulcus. The inferior frontal gyrus is defined anteriorly by the inferior frontal sulcus, posteriorly by the precentral sulcus, laterally by the sylvian fissure, and medially by the inferior frontal sulcus. The precentral gyrus is defined anteriorly by the precentral sulcus, posteriorly by the central sulcus, laterally by the sylvian fissure, and medially by the interhemispheric fissure. The postcentral gyrus is defined anteriorly by the central sulcus, posteriorly by the postcentral sulcus, laterally by the sylvian fissure, and medially by the interhemispheric fissure. The superior parietal lobule is defined anteriorly by the postcentral sulcus, posteriorly by the lateral extension of the parieto-occipital sulcus, laterally by the medial border of the intraparietal sulcus, and medially by the interhemispheric fissure. The inferior parietal lobule is defined anteriorly by the postcentral sulcus, posteriorly by the lateral extension of the parieto-occipital sulcus, laterally by the sylvian fissure, and medially by the lateral border of the intraparietal sulcus. The intraparietal sulcus is defined anteriorly by the postcentral sulcus, posteriorly by the lateral extension of the parieto-occipital sulcus, laterally by the inferior parietal lobule, and medially by the superior parietal lobule. The calcarine sulcus is defined from the occipital pole to its intersection with the parieto-occipital sulcus. The cuneus is the medial gray matter superior to the calcarine sulcus, extending anteriorly to the parieto-occipital sulcus. The precuneus is the medial gray matter defined anteriorly by the marginal ramus of the cingulate sulcus, posteriorly by the parieto-occipital sulcus, and inferiorly by the subparietal sulcus. The paracentral lobule is the medial gray matter defined anteriorly by the paracentral sulcus, posteriorly by the marginal ramus of the cingulate sulcus, and inferiorly by the cingulate sulcus. The medial frontal gyrus is the medial gray matter defined anteriorly to the medial extension of the frontomarginal sulcus, posteriorly to the paracentral sulcus, and inferiorly to the cingulate sulcus. The cingulate gyrus is defined anteriorly by the cingulate sulcus, posteriorly by the subparietal sulcus, superiorly by the cingulate sulcus and subparietal sulcus, and inferiorly by the corpus callosum. The sub-genu area is not included.
Data analysis
Preprocessing
Images were screened for motion artifacts by measuring variation in the center of mass of the functional images over the entire time course. This measurement was performed separately for the x, y, and z coordinates. Subject motion was further assessed by forming a cine loop of the images. Both measurements were performed using the fMRI analysis program STIMULATE and motion correction was performed using Automated Image Registration (AIR, Cox and Jesmanowicz 1999). The data were natural log-transformed (Lewis et al. 2003a, 2005) and detrended using a sliding regression window (45 images × 3 s = 135 s wide) to remove low frequency noise (Marchini and Ripley 2000).
fMRI signal extraction
Voxels with a coefficient of variation greater than 5%, as determined from the time course of blood oxygen level-dependent (BOLD) values during the rest period, were eliminated from further analysis. This criterion was used because it has been shown that the coefficient of variation is higher in the vicinity of large vessels as well as outside the brain (Kim et al. 1994). BOLD values for each voxel were averaged for each condition (Rest, Visual, Copying) after removing the first 2 time points for each condition to allow the hemodynamic response to stabilize. The means that were retained were thus made up of 13 distinct BOLD values. Differences in the averaged BOLD signal between the visual and the rest condition (Visual-Rest, VR), and between the copying and the visual condition (Copy-Visual, CV) were then calculated for each voxel per shape. This subtraction was done because the experimental task was set up in an incremental way, where each sequential condition added a level of complexity; thus, subtracting the signal from the previous condition allows for a clearer representation of the neural process of interest.
Next, the voxel VR and CV data were averaged by shape and ROI across subjects. The antilogarithms of the average VR and CV differences were then taken, and , respectively. This step effectively transformed the dataset from differences of log-transformed BOLD signals (see above) to ratios of “Visual/Rest” and “Copy/Visual” BOLD signal values, which were then analyzed by MDS at the ratio level of measurement.
MDS
This analysis was directed at deriving an MDS configuration for the nine shapes used. For that purpose, we constructed shapes dissimilarity matrices for each of the two conditions (VR and CV) and for each ROI (dissimilarities in this case are defined as the absolute difference in BOLD signal |BSa–BSb| between two shapes a and b). In total, there were 28 square matrices per condition (one for each ROI) of rank 9 × 9, corresponding to the 9 shapes. We used a weighted Euclidean model (INDSCAL option of the ALSCAL procedure of the SPSS statistical package for Windows, version 14.0, Chicago, IL). The level of measurement was “ratio” and the data were considered to be unconstrained (the “condition” subcommand in the AL-SCAL procedure above set to “unconditional”). Maximum dimensionality was set to be 3 (i.e., 3-D and 2-D solutions were considered). Solutions were arrived at by an iterative procedure aimed to minimize stress (Kruskal and Wish 1978), i.e. minimize the discrepancy between the MDS configuration and the data. The criteria for convergence were as follows: s-stress convergence = 0.001, minimum s-stress value = 0.005, maximum number of iterations = 30. When the optimal (i.e. minimal s-stress) solution was achieved, the quality of the solution was assessed using the percent variance explained (R2). The “unconditional” option for the MDS algorithm was selected as results are collapsed across subjects. In conventional INDSCAL, the data is considered to be “constrained” and no direct comparisons can be made between points in the space displaying the weights contributing to the final solution (here this refers to the space containing the ROIs). This was a feature of the technique essentially referring to the fact that the points in the weight space were different subjects, with individual and non-comparable perceptual/behavioral makeups. In this case, the points in weight-space are ROIs collapsed across subjects, hence comparisons are possible and the modified version of the original INDSCAL algorithm is justified (MacCallum 1977).
The MDS analysis yielded two sets of results for each of the two experimental conditions (VR, CV). The first set comprised the coordinates (3-D or 2-D) of the shapes in the shape configuration space. Initial exploratory analysis indicated that 2-D solutions were adequate and that a third dimension was not warranted. Therefore, the analysis was focused on 2-D solution. The second set comprised the weights of each ROI with respect to the shape-space dimension.
Regression analyses
A major challenge in MDS analysis concerns the interpretation of the derived dimensions. Since a weighted MDS was used in this study, the dimensions are fixed (i.e. the shape configuration plot is not rotatable) and, therefore, can be interpreted. For that purpose, we used a regression approach in which the derived X- and Y-values of the shapes in the shape configuration plot (corresponding to Dimension 1 and 2, respectively, for the 2-D solution) were regressed in a stepwise fashion against 18 stimulus (Table 1) and motor performance (Table 2) measures, separately for the VR and CV conditions. The results of this analysis identified the perceptual-motor features relevant for each MDS dimension.
As mentioned in the preceding paragraph, the weighted MDS analysis also provided information on the relation between a specific ROI and the MDS dimensions, based on the fact that an ROI can be associated predominantly to Dimension 1 or 2, or to both. Given that distinct perceptual-motor features can be associated with distinct MDS dimensions, as described above, it follows that ROIs associated with a specific MDS dimension (or both) could be related to the perceptual-motor features corresponding to that dimension. We investigated this idea by performing a separate regression analysis in which the geometric mean (i.e. antilog) of the ROI BOLD signal change (in the VR and CV conditions) was the dependent variable and the values of the perceptual-motor features relevant to the MDS dimension to which the ROI was related were the independent variables. The results of this analysis established a link (guided by MDS) between ROI activation and behavioral features.
Results
VR condition
Shape configuration space
The R2 was 0.62 for the 2-D solution, indicating a good fit. The shape configuration plot is shown in Fig. 2. Two separate stepwise, multiple regressions were performed, one for the X- and the other for the Y-values of the shapes against 18 perceptual and motor features (Tables 1, 2). The X- and Y-values refer to Dimension 1 and Dimension 2 in Fig. 2, respectively.
Fig. 2.
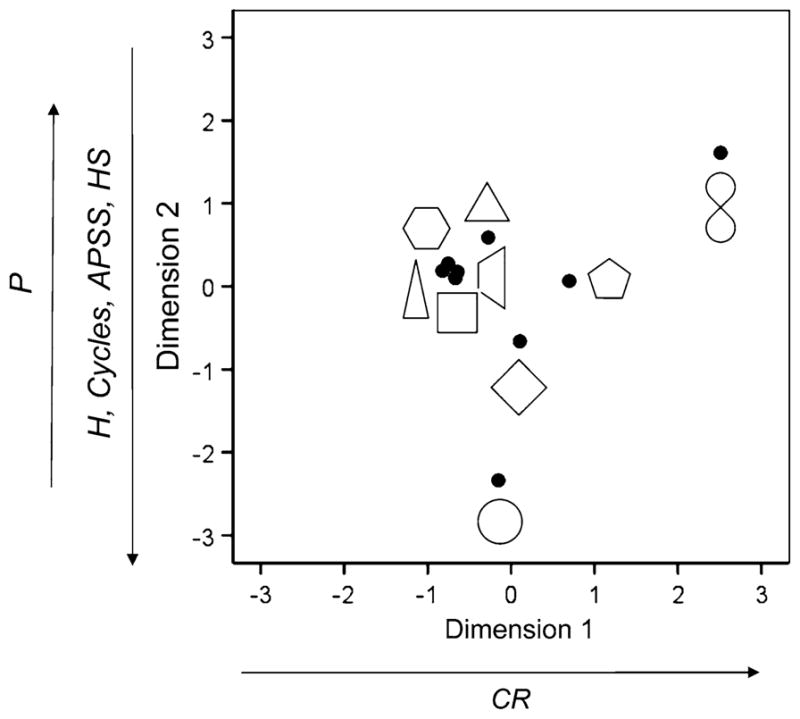
MDS space configuration space for the VR (viewing vs. rest) condition. Filled circles indicate the location of the associated shape in the plot. Labels in the dimensions indicate features (see Tables 1, 2) with significant effects on the X (Dimension 1) or Y (Dimension 2) values of the plotted shapes. P perimeter, CR presence of crossing, H height, Cycles number of shapes drawn per task period (45 s), APSS average peak speed per segment drawn, HS horizontal symmetry. Arrows indicate the direction of the effect reflected in the sign of the corresponding regression coefficient
For Dimension 1, the presence of crossing in a shape was the only statistically significant feature (P = 0.001), with positive slope. This reflects the location of the lemniscate towards far right in Fig. 2, since this is the only shape with crossing. The adjusted R2 for this regression model was 0.788. For Dimension 2, several perceptual and motor features were statistically significant, as follows: perimeter (P = 0.00001), height (P = 0.00004), cycles (P = 0.0003), peak segment speed (P = 0.0005), and horizontal symmetry (P = 0.006). The partial regression slope was positive for perimeter and negative for the other features. This is indicated by arrows in Fig. 2. Overall, the adjusted R2 for this regression model was 0.99.
It is interesting that BOLD signals during the VR condition were associated with upcoming motor features. It is possible (as suggested by an anonymous reviewer) that visual attributes of the stimuli are determinants of following motor performance. We examined this possibility by performing a stepwise multiple regression analysis where a specific motor feature (from Table 1) was the dependent variable and all the visual features (from Table 2) were independent variables. We found the following (Table 3). (1) Of six motor features, three (ASL, APSS, and APASA; see Table 2) did not show any significant association with any visual feature. These features reflect dynamic motor variables. (2) Of 12 visual features, 6 showed significant effects on motor features, as shown in Table 3. Specifically, the motor features affected by visual features referred to general spatiotemporal aspects of shape copying, including the number of cycles, the number of segments and the average intersegment angular change. Of the visual features involved, the number of angles in a shape had a highly significant effect on all three motor features above.
Table 3.
| Visual feature
|
|||||||
|---|---|---|---|---|---|---|---|
| A | C | CR | VS | DS | O | ||
| Motor feature | Cycles | <10−4 | <10−3 | <0.05 | |||
| NS | <10−3 | <10−5 | <10−3 | <10−2 | <0.025 | ||
| AIAC | <10−4 | <10−3 | |||||
Features not shown did not show a statistically significant effect (P >0.05)
Numbers indicate P values from stepwise regression analyses where the motor feature was the dependent variable and all visual features (see Table 1) were independent variables (see text)
Brain areas space
The contributions of brain areas to the two derived dimensions in the shape configuration space (Fig. 2) are shown in Fig. 3 as vectors emanating from the origin [0, 0]; the lengths of all ROI vectors are given in Table 4. The dimensions in this plot are the same as those in the plot of Fig. 2. The orientation of each vector indicates the relative contribution of that area to the 2 dimensions, whereas the length of the vector d is a measure of the strength of the contribution. Of the 28 areas studied, 11 exceeded an arbitrary threshold of , chosen after examination of the distribution of the area vector lengths. It can be seen that 2 sets of brain areas were clustered along the 2 dimensions, as follows. (1) Seven areas were associated mostly with Dimension 1, including (in order of vector length) left inferior frontal gyrus, left medial frontal gyrus, left cingulate gyrus, left intraparietal sulcus, right inferior frontal gyrus, right cingulate gyrus, and right medial frontal gyrus. These areas essentially comprise the medial frontal lobe bilaterally, the inferior frontal gyrus bilaterally, and the left intraparietal sulcus. (2) Four visual areas contributed mainly to Dimension 2, including the calcarine sulcus and cuneus bilaterally. Overall, the vector lengths of these areas were substantially higher than those associated with Dimension 1. The multiple regression analysis between ROI activation and relevant perceptual-motor features did not reveal any statistically significant effects.
Fig. 3.

ROI contribution plot for the VR condition. 1 left calcarine sulcus, 2 right calcarine sulcus, 3 left cuneus, 4 right cuneus, 5 left intraparietal sulcus, 6 left inferior frontal gyrus, 7 left medial frontal gyrus, 8 left cingulate gyrus, 9 right cingulate gyrus, 10 right medial frontal gyrus, 11 right inferior frontal gyrus. See text for explanation of the plot
Table 4.
Lengths of vector contributions of 28 ROIs (arbitrary units)
| VR condition
|
CV condition
|
||
|---|---|---|---|
| ROI | Vector length | ROI | Vector length |
| L calcarine | 2.601 | R superior parietal lobule | 2.862 |
| R calcarine | 1.391 | R intraparietal sulcus | 1.765 |
| L cuneus | 1.146 | R inferior parietal lobule | 1.338 |
| L inferior frontal gyrus | 1.061 | L superior parietal lobule | 1.270 |
| L medial frontal gyrus | 1.007 | L intraparietal sulcus | 1.197 |
| L cingulate gyrus | 0.843 | L inferior parietal lobule | 1.002 |
| L intraparietal sulcus | 0.661 | R postcentral gyrus | 0.931 |
| R inferior frontal gyrus | 0.659 | L superior frontal gyrus | 0.718 |
| R cingulate gyrus | 0.647 | R superior frontal gyrus | 0.691 |
| R cuneus | 0.639 | L postcentral gyrus | 0.607 |
| R medial frontal gyrus | 0.603 | R middle frontal gyrus | 0.603 |
| L superior frontal gyrus | 0.590 | R precentral gyrus | 0.493 |
| R superior frontal gyrus | 0.583 | L middle frontal gyrus | 0.463 |
| L middle frontal gyrus | 0.553 | R precuneus | 0.416 |
| R postcentral gyrus | 0.476 | L precentral gyrus | 0.354 |
| R middle frontal gyrus | 0.454 | R cuneus | 0.302 |
| L inferior parietal lobule | 0.453 | L precuneus | 0.288 |
| R intraparietal sulcus | 0.416 | L calcarine | 0.282 |
| L superior parietal lobule | 0.409 | L cuneus | 0.228 |
| L precuneus | 0.392 | L paracentral lobule | 0.215 |
| R precuneus | 0.373 | R paracentral lobule | 0.213 |
| R inferior parietal lobule | 0.256 | R inferior frontal gyrus | 0.136 |
| R superior parietal lobule | 0.188 | R cingulate gyrus | 0.132 |
| R precentral gyrus | 0.179 | R medial frontal gyrus | 0.128 |
| R paracentral lobule | 0.135 | L inferior frontal gyrus | 0.126 |
| L postcentral gyrus | 0.078 | L medial frontal gyrus | 0.109 |
| L paracentral lobule | 0.065 | R calcarine | 0.057 |
| L precentral gyrus | 0.059 | L cingulate gyrus | 0.035 |
CV condition
Shape configuration space
The R2 was 0.749 for the 2-D solution, indicating a good fit. The shape configuration plot is shown in Fig. 4. As for the VR condition, two separate stepwise, multiple regressions were performed, one for the X- and the other for the Y-values of the shapes against 18 perceptual and motor features (Tables 1, 2). The X- and Y-values refer to Dimension 1 and Dimension 2 in Fig. 4, respectively.
Fig. 4.

Space configuration plot for the CV (copying vs. viewing) condition. Details as in Fig. 2
For Dimension 1, one motor feature (number of segments copied P = 0.0001) and one perceptual feature (horizontal symmetry P = 0.02) were statistically significant, with positive and negative partial regression coefficients, respectively (see Fig. 4). The adjusted R2 for this regression model was 0.898. For Dimension 2, only the number of segments copied was statistically significant (P = 0.012), with positive slope. Overall, the adjusted R2 for this regression model was 0.565.
Brain areas space
The contributions of brain areas to the two derived dimensions in the shape configuration space (Fig. 4) are shown in Fig. 5; the lengths of all ROI vectors are given in Table 4. Of the 28 areas studied, 11 exceeded the threshold of d >0.6. In this case, there were three distinct groups of vector-areas, as follows.
Fig. 5.

ROI contribution plot for the CV condition. 1 left postcentral gyrus, 2 right superior frontal gyrus, 3 left superior frontal gyrus, 4 left inferior parietal lobule, 5 right middle frontal gyrus, 6 left intraparietal sulcus, 7 left superior parietal lobule, 8 right intraparietal sulcus, 9 right postcentral gyrus, 10 right superior parietal lobule, 11 right inferior parietal lobule
Four areas were associated mostly with Dimension 1, including right superior parietal lobule, right intraparietal sulcus, right inferior parietal lobule, and right postcentral gyrus. Essentially, these areas comprise the right lateral parietal lobe. Given that Dimension 1 was associated with the number of copied shape segments and horizontal shape symmetry (see above), we regressed the BOLD activation of each one of the four ROIs above against those measures. For the right superior parietal lobule, the regression model was statistically significant (P = 0.005, adjusted R2 = 0.77). Specifically, there was a statistically significant effect of the number of segments (P = 0.002) but not of horizontal symmetry (P = 0.146). For the right intraparietal sulcus, the regression model was statistically significant (P = 0.011, adjusted R2 = 0.708). There was a statistically significant effect of the number of segments (P = 0.004) and a marginal effect of horizontal symmetry (P = 0.058). For the right postcentral gyrus, the regression model was statistically significant (P = 0.002, adjusted R2 = 0.821). There was a statistically significant effect of the number of segments (P = 0.001) and of horizontal symmetry (P = 0.015). Finally, for the right inferior parietal lobule, the regression model was not significant (P = 0.247, R2 = 0.163).
Two areas of the left parietal lobe (left intraparietal sulcus and left superior parietal lobule) contributed almost equally to the 2 dimensions. For the left superior parietal lobule, the regression model was statistically significant (P = 0.011, adjusted R2 = 0.705). There was a statistically significant effect of the number of segments (P = 0.004) but not of horizontal symmetry (P = 0.32). For the left intraparietal sulcus, the regression model was statistically significant (P = 0.041, adjusted R2 = 0.541). There was a statistically significant effect of the number of segments (P = 0.016) but not of horizontal symmetry (P = 0.52).
Finally, (3) five areas contributed mainly to Dimension 2, including left inferior parietal lobule, left superior frontal gyrus, right superior frontal gyrus, left postcentral gyrus, and right middle frontal gyrus. None of these areas showed any statistically significant effect (P <0.05) of the number of segments copied, the only behavioral feature associated with this dimension.
Discussion
The present work is part of a larger study on brain mechanisms underlying copying of visual shapes. The fMRI results obtained in the cerebellum have been published (Lewis et al. 2003a), and preliminary findings on cerebral cortical activation have been presented (Lewis et al. 2003b). In parallel, electrophysiological recordings in monkeys copying geometrical shapes provided finer grain information on prefrontal (Averbeck et al. 2002, 2003a, b, 2008) and parietal (Averbeck et al. 2005, 2008) cortical mechanisms involved in this function. In addition, studies using artificial neural networks have provided insights into the possible underlying neural mechanisms (Lukashin and Georgopoulos 1994; Lukashin et al. 1994). As a complement to the studies and analyses above, the major objective of the present work was to gain an insight into the integrative neural mechanisms of copying, considered as a function to which several brain areas contribute. For that purpose we used MDS which is well suited to achieve this objective. We introduced MDS analysis to the fMRI field (Tagaris et al. 1998; Georgopoulos 1999) to successfully derive task configuration and ROI contribution spaces from fMRI results in studies of mental rotation and memory scanning. Since then, other studies have employed MDS in a variety of fMRI studies (Welchew et al. 2002, 2005; Kherif et al. 2003; Salvador et al. 2005).
In this study, we used the weighted (i.e. individual distances, INDSCAL) version of MDS where the BOLD activation for each ROI was treated (i.e. weighted) individually, on the reasonable assumption that different ROIs may be differentially engaged, depending on the visual and motor features of shapes being copied. The relative weights of each dimension for each ROI can be thought of as representing individual differences in perspective on a common configuration space, just as one’s angle of view affects the perceived relative dimensions of an ordinary object in space (Arabie et al. 1987).
A major benefit of the INDSCAL analysis is that it provides solutions that are non-rotatable and, hence, with interpretable dimensions. These dimensions reflect, in turn, aspects of the shapes copied (or viewed), since it was the set of nine shapes shown in Fig. 1 that was used as a probe for brain activation. Therefore, for the MDS, 9 × 9 shape dissimilarity matrices were constructed for each ROI (28 such matrices per condition), where the “dissimilarity” refers to the difference in average ROI activation (across subjects) observed during viewing (for the VR condition) or copying (for the CV condition) two specific shapes. This arrangement yielded a pair of basic plots for each condition, namely (1) a shape configuration plot, and (2) a ROI contribution plot. [These plots correspond to the “stimulus” and “subject” plots in early MDS work (Young and Harris 1990).] Thus the dimensions are the same in both plots and refer to some aspects of the shapes used; in the shapes plot, the individual shapes are plotted as points in 2-D space (given the 2-D solution employed) whereas in the ROI plot, individual ROIs are plotted as vectors emanating from the origin with (1) orientation varying from being parallel to the x-axis to being parallel to the y-axis, indicating exclusive contributions to Dimension 1 and 2, respectively, and (2) length proportional to the strength of contribution to the overall shapes configuration arrangement.
The challenge in any MDS analysis is the interpretation of the derived dimensions. Since these dimensions refer to the shapes used, their interpretation should stem from aspects of these shapes. Now, there were two relevant aspects of the shapes, one aspect stemming from internal, spatial “perceptual” characteristics of the shape, and the other stemming from performed “motor” characteristics. We attempted to quantify those aspects by deriving perceptual and motor “features” for each shape, given in Tables 1 and 2, respectively. We then used those features as independent variables in 2 multiple regression models, where the X- and Y-values of each shape in the shape configuration plot were the dependent variables.
VR condition
The analysis of data from the VR condition showed that six features were significantly related to the X/Y MDS dimensions; four of these features came from the perceptual set (presence of crossing, perimeter, horizontal symmetry, and height, see Table 1) and 2 came from the motor performance set (cycles, peak segment speed, see Table 2). The ROI contribution plot (Fig. 3) revealed a clear association of four visual areas bilaterally (calcarine sulcus and cuneus) to Dimension 2 which was, in turn, related to all (but crossing) of the perceptual and motor features above. The strength of contribution was highest for the calcarine sulcus. In contrast, there were contributions of lower strength related to Dimension 1 (crossing) by the left intraparietal sulcus, the medial frontal wall (medial frontal gyrus and cingulate) bilaterally, and the inferior frontal gyrus bilaterally. The relations between ROIs and features were indirect, mediated through the MDS dimensions, since a direct regression analysis did not show any significant effect of the features above on the BOLD ROI activation in the VR condition.
These findings are in accord with some common assumptions and some previous results. First, it is reasonable to suppose that visual areas are activated when a visual object is presented. Accordingly, the clear involvement of the calcarine sulcus (V1) and the cuneus is not surprising. And second, the relation to the speed of drawing shape segments is in accord with previous findings in the cerebellum where the BOLD activation during the VR condition was found to be significantly related to the speed of the upcoming shape copying (Lewis et al. 2003a). In general, these results support the hypothesis for a mental rehearsal of copying, as proposed previously (Lewis et al. 2003a; see also Deiber et al. 1996 and Porro et al. 1996).
CV condition
The analysis of data from the CV condition showed that practically one motor feature (number of segments drawn) dominated both dimensions, with a secondary engagement of horizontal symmetry in Dimension 1. It is interesting that this factor was involved in both dimensions, but with substantive differences, as follows. First, its significance was much higher for Dimension 1 (P = 0.0001) than for Dimension 2 (P = 0.012). Second, it was joined by horizontal symmetry in Dimension 1. Third, the ROIs involved differed between Dimension 1 and Dimension 2. In addition, the number of segments drawn may reflect more than one distinct neural process (e.g. planned change in direction, as in drawing a triangle, or motor segmentation while drawing a curve, e.g. circle, in the absence of explicit planning). These considerations, in conjunction with the fact that the MDS analysis indeed yielded a 2-dimensional shape space solution where shapes were spread out in the 2-D space instead of lying along a single dimension, indicates that the presence of the number of segments factor in both dimensions is complementary rather than redundant.
The ROI contribution plot (Fig. 5) revealed three separate ROI sets with different contributions to the two dimensions. The first set contributed to Dimension 1 (right postcentral gyrus, right intraparietal sulcus, right superior parietal lobule, right inferior parietal lobule); the second set contributed to Dimension 2 (superior frontal gyrus bilaterally, right middle frontal gyrus, left postcentral gyrus, left inferior parietal lobule); and the third set contributed to both dimensions, approximately equally (left superior parietal lobule, left intraparietal sulcus). It can be seen in Fig. 5 that the strongest contributions were for Dimension 1 and both dimensions. Indeed, there was a direct association between the CV BOLD activation of the ROIs in those clusters and the number of segments drawn, as documented by the statistically significant effect of this feature in the regression analysis. Although the same feature was involved in Dimension 2, no statistically significant effects were found for the ROIs in the Dimension 2 cluster, most probably due to the low strength of contribution.
An obvious interpretation of the number of segments drawn in the context of shape copying refers to the change in direction of the drawing movement. Therefore, we hypothesize that this factor of the frequency of directional change dominates cortical activation during copying. Interestingly, this feature is clearly a spatial aspect of drawing geometrical shapes. It is also interesting that the Dimension 1 cluster with ROIs directly related to this performance feature comprises essentially the right parietal lobe. To our knowledge, this is the first time that a clear association of the right parietal cortex to copying in general and to a spatial aspect of copying in particular has been reported using fMRI. This finding and the results above of involvement of other areas in the frontal and parietal lobes is in accord with a wealth of observations in patients with brain damage, as follows.
Disturbances in copying are commonly observed in clinical neurology and are typical findings in constructional apraxia (Kleist 1934; Benton 1962, 1967; Gainotti 1985). Damage to the posterior parietal cortex is frequently present, but constructional deficits can also result from damage to the prefrontal cortex (Luria and Tsvekova 1964; Benton 1968; Gainotti 1985; Koski et al. 2002). Although early studies pointed to a special role of the right cerebral hemisphere in constructional apraxia (Piercy et al. 1960; Benton 1967; Mack and Levine 1981), more systematic later work (reviewed in De Renzi 1982; Gainotti 1985) supported the notion that this function is most probably subserved by both hemispheres. The fact that lesions in widespread cortical areas can cause constructional deficits led (Benson and Barton 1970) to suggest that, “… drawing, by itself, is a reasonably good test for detecting brain damage”. In fact, copying objects has been used as a probe to detect brain damage since early in the last century (Poppelreuter 1917). One possible reason that constructional ability is easily disturbed is that it is a complex task requiring the functional coordination of many different processes, including visuospatial perception and spatial motor planning. These factors are commonly tested in a different context, namely route finding in simple drawings of mazes (Porteus Maze Test; Porteus 1965). Interestingly, the performance of right hemisphere damaged patients in copying is highly correlated with their performance in route finding (Angelini et al. 1992). Finally, copying from vision and drawing from memory can be intact in the presence of object agnosia (Behrmann et al. 1992), whereas copying from vision can be normal but drawing from memory defective, in the absence of object agnosia (Grossi et al. 1986). Such cases indicate that visual perception and visually guided action interact in a complex fashion even though both depend, and rely, on visual information, either real or imagined. The results of the present study for both the VR and CV conditions provide direct and specific information concerning brain activation in copying, with a focus on the right parietal cortex and spatial aspects of the copying function. It is interesting that areas previously shown to be involved in copying (inferior frontal gyrus, Krams et al. 1998) or modulation of motor planning (cingulate gyrus, Paus et al. 1993) were found in the present study to be associated with MDS dimensions in the VR condition. This finding lends further support to the hypothesis that the upcoming copying is mentally rehearsed during viewing the shape before copying it.
Finally, it should be noted that the whole MDS analysis in this study was focused on the shapes themselves, be it in the perceptual or motor domain. Indeed, the data that served as inputs to the analysis were matrices of dissimilarities in BOLD activation between shapes. The point is that, if such dissimilarities were minimal for a given ROI and condition, the contribution of that ROI would be accordingly minimal and the length of its vector in the relevant ROI contribution plot short. This, however, would by no means reduce the potential contribution of this ROI to the copying function: it would simply indicate that the role of that particular ROI in copying would not differ among different shapes, and the various features they might possess. For example, the left precentral gyrus was the most highly activated ROI during copying (Lewis et al. 2003b) but its contribution to the MDS dimensions was lower than other areas. This simply suggests that precentral activation does not differentiate shape copying as much as parietal areas, for example, the level of activation of which was overall lower than that of the precentral gyrus. On the other hand, areas associated in a substantial way to the MDS dimensions (as indicated by the length of their vector in the ROI contribution plots) would be considered to reflect differences among shapes and hence to reflect more specifically spatial perceptual-motor aspects of copying.
Acknowledgments
We thank Joshua Lynch for data preprocessing and Marc Coutanche for comments on the manuscript. This work was supported by US NIH grant NS32919, the US Department of Veterans Affairs, and the American Legion Chair in Brain Sciences.
Contributor Information
Charidimos Tzagarakis, Brain Sciences Center, Veterans Affairs Medical Center (11B), One Veterans Drive, Minneapolis, MN 55417, USA. NIHR and Department of Psychiatry, University of Oxford, Warneford Hospital, Oxford OX3 7JX, UK.
Trenton A. Jerde, Brain Sciences Center, Veterans Affairs Medical Center (11B), One Veterans Drive, Minneapolis, MN 55417, USA. Department of Psychology, New York University, New York, NY 10003, USA
Scott M. Lewis, Brain Sciences Center, Veterans Affairs Medical Center (11B), One Veterans Drive, Minneapolis, MN 55417, USA. Department of Neurology, University of Minnesota Medical School, Minneapolis, MN 55455, USA
Kâmil Uğurbil, Center for Magnetic Resonance Research, Department of Radiology, University of Minnesota Medical School, Minneapolis, MN 55455, USA.
Apostolos P. Georgopoulos, Email: omega@umn.edu, Brain Sciences Center, Veterans Affairs Medical Center (11B), One Veterans Drive, Minneapolis, MN 55417, USA. Department of Neurology, University of Minnesota Medical School, Minneapolis, MN 55455, USA. Department of Neuroscience, University of Minnesota Medical School, Minneapolis, MN 55455, USA. Department of Psychiatry, University of Minnesota Medical School, Minneapolis, MN 55455, USA. Center for Cognitive Sciences, University of Minnesota, Minneapolis, MN 55455, USA
References
- Angelini R, Frasca R, Grossi D. Are patients with constructional disorders different in visuo-spatial abilities? Acta Neurol. 1992;14:595–604. [PubMed] [Google Scholar]
- Arabie P, Carroll JD, DeSarbo WS. Three-way scaling and clustering. Sage; Newbury Park: 1987. [Google Scholar]
- Averbeck BB, Chafee MV, Crowe DA, Georgopoulos AP. Parallel processing of serial movements in prefrontal cortex. Proc Natl Acad Sci USA. 2002;99:13172–13177. doi: 10.1073/pnas.162485599. [DOI] [PMC free article] [PubMed] [Google Scholar]
- Averbeck BB, Chafee MV, Crowe DA, Georgopoulos AP. Neural activity in prefrontal cortex during copying geometrical shapes. I. Single cells encode shape, sequence, and metric parameters. Exp Brain Res. 2003a;150:127–141. doi: 10.1007/s00221-003-1416-6. [DOI] [PubMed] [Google Scholar]
- Averbeck BB, Crowe DA, Chafee MV, Crowe DA, Georgopoulos AP. Neural activity in prefrontal cortex during copying geometrical shapes II. Decoding shape segments from neural ensembles. Exp Brain Res. 2003b;150:142–153. doi: 10.1007/s00221-003-1417-5. [DOI] [PubMed] [Google Scholar]
- Averbeck BB, Chafee MV, Crowe DA, Georgopoulos AP. Parietal representation of hand velocity in a copy task. J Neurophysiol. 2005;93:508–518. doi: 10.1152/jn.00357.2004. [DOI] [PubMed] [Google Scholar]
- Averbeck BB, Crowe DA, Chafee MV, Crowe DA, Georgopoulos AP. Differential contribution of superior parietal and dorsal-lateral prefrontal cortices in copying. Cortex. 2008 doi: 10.1016/j.cortex.2008.02.007. [Epub ahead of print] [DOI] [PubMed] [Google Scholar]
- Behrmann M, Winocur G, Moscovitch M. Dissociation between mental imagery and object recognition in a brain-damaged patient. Nature. 1992;359:636–637. doi: 10.1038/359636a0. [DOI] [PubMed] [Google Scholar]
- Benson DF, Barton MI. Disturbances in constructional ability. Cortex. 1970;6:19–46. doi: 10.1016/s0010-9452(70)80034-x. [DOI] [PubMed] [Google Scholar]
- Benton AL. The visual retention test as a constructional praxis task. Confin Neurol. 1962;22:141–155. doi: 10.1159/000104348. [DOI] [PubMed] [Google Scholar]
- Benton AL. Constructional apraxia and the minor hemisphere. Confin Neurol. 1967;29:1–16. [PubMed] [Google Scholar]
- Benton AL. Differential behavioral effects in frontal lobe disease. Neuropsychologia. 1968;6:53–60. [Google Scholar]
- Carroll D, Chang J. Analysis of individual differences in multidimensional scaling via an n-way generalization of “Eck-art-Young” decomposition. Psychometrika. 1970;35:283–319. [Google Scholar]
- Cox RW, Jesmanowicz A. Real-time 3d image registration for functional MRI. Magn Reson Med. 1999;42:1014–1018. doi: 10.1002/(sici)1522-2594(199912)42:6<1014::aid-mrm4>3.0.co;2-f. [DOI] [PubMed] [Google Scholar]
- De Renzi E. Disorders of space exploration and cognition. Wiley; Baffins Lane: 1982. [Google Scholar]
- Deiber MP, Ibañez V, Sadato N, Hallett M. Cerebral structures participating in motor preparation in humans: a positron emission tomography study. J Neurophysiol. 1996;75:233–247. doi: 10.1152/jn.1996.75.1.233. [DOI] [PubMed] [Google Scholar]
- Gainotti G. Constructional apraxia. In: Frederiks JAM, editor. Handbook of clinical neurology. Amsterdam: Elsevier; 1985. pp. 491–506. [Google Scholar]
- Georgopoulos AP. Neural mechanisms of motor cognitive processes: functional MRI and neurophysiological studies. In: Gazzaniga MS, editor. The new cognitive neurosciences. 2. MIT; Cambridge: 1999. pp. 525–538. [Google Scholar]
- Grossi D, Orsini A, Modafferi A, Liotti M. Visuoimaginal constructional apraxia: on a case of selective deficit of imagery. Brain Cogn. 1986;5:255–267. doi: 10.1016/0278-2626(86)90030-8. [DOI] [PubMed] [Google Scholar]
- Kherif F, Poline JB, Mériaux S, Benali H, Flandin G, Brett M. Group analysis in functional neuroimaging: selecting subjects using similarity measures. Neuroimage. 2003;20:2197–2208. doi: 10.1016/j.neuroimage.2003.08.018. [DOI] [PubMed] [Google Scholar]
- Kim SG, Hendrich K, Hu X, Merkle H, Uğurbil K. Potential pitfalls of functional MRI using conventional gradient-recalled echo techniques. NMR biomed. 1994;7:69–74. doi: 10.1002/nbm.1940070111. [DOI] [PubMed] [Google Scholar]
- Kleist K. Gehirnpathologie. Barth; Leipzig: 1934. [Google Scholar]
- Koski L, Iacoboni M, Mazziotta JC. Deconstructing apraxia: understanding disorders of intentional movement after stroke. Curr Opin Neurobiol. 2002;15:71–77. doi: 10.1097/00019052-200202000-00011. [DOI] [PubMed] [Google Scholar]
- Krams M, Rushworth MFS, Deiber M-P, Frackowiak RSJ, Passingham RE. The preparation, execution and suppression of copied movements in the human brain. Exp Brain Res. 1998;120:386–398. doi: 10.1007/s002210050412. [DOI] [PubMed] [Google Scholar]
- Kruskal JB, Wish M. Multidimensional scaling. SAGE; Newbury Park: 1978. [Google Scholar]
- Laeng B. Constructional apraxia after left or right unilateral stroke. Neuropsychologia. 2006;44:1595–1606. doi: 10.1016/j.neuropsychologia.2006.01.023. [DOI] [PubMed] [Google Scholar]
- Lewis SM, Jerde TA, Tzagarakis C, Georgopoulos MA, Tsekos N, Amirikian B, Kim SG, Ug urbil K, Georgopoulos AP. Cerebellar activation during copying geometrical shapes. J Neurophysiol. 2003a;90:3874–3887. doi: 10.1152/jn.00009.2003. [DOI] [PubMed] [Google Scholar]
- Lewis SM, Jerde TA, Tzagarakis C, Tsekos N, Amirikian B, Georgopoulos MA, Kim SG, Ugurbil K, Georgopoulos AP. Activation in the frontal and parietal lobes during performance of a copy task: an fMRI study. Soc Neurosci Abstr. 2003b;620:1. [Google Scholar]
- Lewis SM, Jerde TA, Tzagarakis C, Gourtzelidis P, Georgopoulos MA, Tsekos N, Amirikian B, Kim SG, Ug urbil K, Georgopoulos AP. Logarithmic transformation for high-field BOLD fMRI data. Exp Brain Res. 2005;165:447–453. doi: 10.1007/s00221-005-2336-4. [DOI] [PubMed] [Google Scholar]
- Lukashin AV, Georgopoulos AP. A neural network for coding of trajectories by time series of neuronal population vectors. Neural Comput. 1994;6:19–28. [Google Scholar]
- Lukashin AV, Wilcox GL, Georgopoulos AP. Overlapping neural networks for multiple motor engrams. Proc Natl Acad Sci USA. 1994;91:8651–8654. doi: 10.1073/pnas.91.18.8651. [DOI] [PMC free article] [PubMed] [Google Scholar]
- Luria AR, Tsvetkova LS. The programming of constructive activity in local brain injuries. Neuropsychologia. 1964;2:95–107. [Google Scholar]
- MacCallum R. Effects of conditionality on indscal and alscal weights. Psychometrika. 1977;42:297–305. [Google Scholar]
- Mack JL, Levine RN. The basis of visual constructional disability in patients with unilateral cerebral lesions. Cortex. 1981;17:515–532. doi: 10.1016/s0010-9452(81)80059-7. [DOI] [PubMed] [Google Scholar]
- Makuuchi M, Kaminaga T, Sugishita M. Both parietal lobes are involved in drawing: a functional MRI study and implications for constructional apraxia. Brain Res Cogn Brain Res. 2003;16:338–347. doi: 10.1016/s0926-6410(02)00302-6. [DOI] [PubMed] [Google Scholar]
- Marchini JL, Ripley BD. A new statistical approach to detecting significant activation in functional MRI. Neuroimage. 2000;12:366–380. doi: 10.1006/nimg.2000.0628. [DOI] [PubMed] [Google Scholar]
- Oldfield RC. The assessment and analysis of handedness: the edinburgh inventory. Neuropsychologia. 1971;9:97–113. doi: 10.1016/0028-3932(71)90067-4. [DOI] [PubMed] [Google Scholar]
- Osterrieth PA. Le test de copie d’une figure complexe: contribution à l’étude de la perception et de la mémoire. Archives de Psychologie. 1944;30:206–356. [Google Scholar]
- Paus T, Petrides M, Evans AC, Meyer E. Role of the human anterior cingulate cortex in the control of oculomotor, manual, and speech responses: a positron emission tomography study. J Neurophysiol. 1993;70:453–469. doi: 10.1152/jn.1993.70.2.453. [DOI] [PubMed] [Google Scholar]
- Piercy M, Hécaen H, Ajuriaguerra J. Constructional apraxia associated with unilateral cerebral lesions. Left and right sided cases compared. Brain. 1960;83:225–242. doi: 10.1093/brain/83.2.225. [DOI] [PubMed] [Google Scholar]
- Pillon B. Troubles visuoconstructifs et methods de compensation: Resultats de 85 patients atteints de lesions cerebrales. Neuropsychologia. 1981;19:375–383. doi: 10.1016/0028-3932(81)90067-1. [DOI] [PubMed] [Google Scholar]
- Poppelreuter W. Die psychische Schadigungen durch Kopfschuss im Kriege. Vol. 1. Leipzig: Voss; 1917. [Google Scholar]
- Porro CA, Francescato MP, Cettolo V, Diamond ME, Baraldi P, Zuiani C, Bazzocchi M, di Prampero PE. Primary motor and sensory cortex activation during motor performance and motor imagery: a functional magnetic resonance imaging study. J Neurosci. 1996;16:7688–7698. doi: 10.1523/JNEUROSCI.16-23-07688.1996. [DOI] [PMC free article] [PubMed] [Google Scholar]
- Porteus SD. The Porteus maze test; 50 years’ application. Pacific books; Palo Alto: 1965. [Google Scholar]
- Rey A. Psychological examination of traumatic encephalopathy. Archives de Psychologie. 1941;28:286–340. [Google Scholar]
- Salvador R, Suckling J, Coleman MR, Pickard JD, Menon D, Bullmore E. Neurophysiological architecture of functional magnetic resonance images of human brain. Cereb Cortex. 2005;15:1332–1342. doi: 10.1093/cercor/bhi016. [DOI] [PubMed] [Google Scholar]
- Schwartz AB. Direct cortical representation of drawing. Science. 1994;265:540–542. doi: 10.1126/science.8036499. [DOI] [PubMed] [Google Scholar]
- Strupp JP. Stimulate: a gui based fMRI analysis software package. Neuroimage. 1996;3:S607. [Google Scholar]
- Suchan B, Yaguez L, Wunderlich G, Canavan AG, Herzog H, Tellmann L, Homberg V, Seitz RJ. Neural correlates of visuospatial imagery. Behav Brain Res. 2002;131:163–168. doi: 10.1016/s0166-4328(01)00373-4. [DOI] [PubMed] [Google Scholar]
- Tagaris GA, Richter W, Kim SG, Pellizzer G, Andersen P, Ugurbil K, Georgopoulos AP. Functional magnetic resonance imaging of mental rotation and memory scanning: a multidimensional scaling analysis of brain activation patterns. Brain Res Rev. 1998;26:106–112. doi: 10.1016/s0165-0173(97)00060-x. [DOI] [PubMed] [Google Scholar]
- Turner RS, Grafton ST, Votaw JR, Delong MR, Hoffman JM. Motor subcircuits mediating the control of movement velocity: a pet study. J Neurophysiol. 1998;80:2162–2176. doi: 10.1152/jn.1998.80.4.2162. [DOI] [PubMed] [Google Scholar]
- Viviani P, Terzuolo C. Trajectory determines movement dynamics. Neuroscience. 1982;7:431–437. doi: 10.1016/0306-4522(82)90277-9. [DOI] [PubMed] [Google Scholar]
- Welchew DE, Honey GD, Sharma T, Robbins TW, Bullmore ET. Multidimensional scaling of integrated neurocognitive function and schizophrenia as a disconnexion disorder. Neuroimage. 2002;17:1227–1239. doi: 10.1006/nimg.2002.1246. [DOI] [PubMed] [Google Scholar]
- Welchew DE, Ashwin C, Berkouk K, Salvador R, Suckling J, Baron-Cohen S, Bullmore E. Functional disconnectivity of the medial temporal lobe in Asperger’s syndrome. Biol Psychiatry. 2005;57:991–998. doi: 10.1016/j.biopsych.2005.01.028. [DOI] [PubMed] [Google Scholar]
- Young FW, Harris DF. SPSS base system user’s guide. SPSS; Chicago: 1990. Multidimensional scaling: procedure ALSCAL; pp. 397–461. [Google Scholar]