

Abstract
Alternative splicing (AS) allows increased diversity and orthogonal regulation of the transcriptional products of mammalian genomes. To assess the distribution and variation of alternative splicing across cell lineages of the immune system, we comprehensively analyzed RNA sequencing and microarray data generated by the Immunological Genome Project Consortium. AS is pervasive: 60% of genes showed frequent AS isoforms in T or B lymphocytes, with 7,599 previously unreported isoforms. Distinct cell specificity was observed, with differential exon skipping in 5% of genes otherwise coexpressed in both B and T cells. The distribution of isoforms was mostly all or none, suggesting on/off switching as a frequent mode of AS regulation in lymphocytes. From the identification of differential exon use in the microarray data, clustering of exon inclusion/exclusion patterns across all Immunological Genome Project cell types showed that ∼70% of AS exons are distributed along a common pattern linked to lineage differentiation and cell cycling. Other AS events distinguished myeloid from lymphoid cells or affected only a small set of exons without clear lineage specificity (e.g., Ptprc). Computational analysis predicted specific associations between AS exons and splicing regulators, which were verified by detection of the hnRPLL/Ptprc connection.
Alternative splicing (AS), the process of selectively including or removing exons to create a variety of transcripts from the same pre-mRNA, plays an important role in amplifying the diversity and flexibility of genome-encoded molecules (1, 2). AS can result in different protein isoforms or generate mRNAs of identical coding sequence but varying in their stability, localization, susceptibility to translational control, or microRNA regulation. AS is frequent and ubiquitous, affecting 55–95% of multiexon genes in mammals in different estimates (3–6). It is involved in a wide range of biological phenomena, ranging from sex determination to apoptosis or tumor formation. It also allows evolutionary tinkering with transcript structure and gradual transitions in gene function (7).
Splicing events are overrepresented in genes involved in signaling and transcriptional regulation (receptors, signaling transduction, and transcription factors) and immune and nervous system processes. It has been hypothesized that alternative splicing is particularly valuable in complex systems, where information is processed differently at different times (immune response) or fine-tuning of signal integration is important (5). In the immune system, the first instance of AS recognized was the now textbook case of differential processing of primary Ig transcripts generating either a membrane receptor in naïve B cells or a secreted protein after antigen-induced differentiation (8). Other notable examples are the splicing of transcripts encoding adhesion molecules such as PECAM1 or CD44, which modulate cell–stroma interactions, or the extracellular domain of the coinhibitory molecule CTLA4 (9). A particularly well-studied example is CD45, with isoforms that are distinct in B and T lymphocytes and vary with the differentiation/activation state of the cell under the control of the splicing regulator hnRPLL (10–12). Despite these important roles that AS plays in immune cells, a comprehensive evaluation has not been done to assess the distribution and variation across different lineages of the immune system.
To sample alternative splicing events on a genome scale, microarrays have been designed or adapted to identify mRNA splice junctions and alternative exon expression. These technologies include custom-designed arrays that probe exon–exon junctions (4, 13) or quantify exon expression (14). Methods to detect splice variants from microarrays often focus on identifying an alternatively expressed exon within a gene by comparing two conditions (15) or identifying residual expression of multiple sequential exons compared with the gene’s expression level (16). More recently, high-throughput cDNA sequencing (RNA-seq) has been used to identify and quantify splice junctions (1, 13), and computational methods have been developed for such analyses (17, 18).
The Immunological Genome Project (ImmGen) performs a thorough dissection of gene expression in all lineages of the mouse immune system using a controlled data generation pipeline (19). Gene expression profiles have been generated from >250 distinct cell types, including very rare subsets. Data were produced primarily using microarrays, but they were complemented and cross-verified by RNA-seq profiling on a few cell types. The RNA-seq data yield the most direct identification of splice junctions, but the microarray platform used by ImmGen also provides exon-level resolution, from which exon inclusion or exclusion can be ascertained. Thus, we have used this combination of datasets to analyze AS at great depth in B and T lymphocytes (RNA-seq data) and across the entire spectrum of ImmGen cell types (microarray data). We find that AS is pervasive across the immune system but still incompletely charted, such that 30% of the events that we uncovered were not in existing databases. Some specific patterns of exon use seem broadly linked to differentiation or proliferative states, but others seem applicable only to one or a few genes. This paper summarizes our observations, which can be more specifically queried on a dedicated portal of the ImmGen website (www.immgen.org).
Results
We used two complementary technologies to characterize splicing events. First, we performed a deep RNA-seq analysis of transcripts from naïve CD4+ T and CD19+ B cells, from which we extracted all splice junctions, canonical or alternative. Second, we searched, across the wide panel of microarray datasets from all immune cell lineages profiled by ImmGen groups, for signals that denote the under- or overutilization of individual exons and reflect differential splicing events. To enable cross-validation between the two approaches, we analyzed the relationship between expression intensity in the two platforms. Integrated gene expression values correlated well (Fig. S1A, Left) [correlation coefficient (cc) = 0.82 and 0.79 for CD4+ T and CD19+ B cells, respectively]; values for individual exons were noisier and less well-correlated, which was expected, because they rely on fewer reads in the RNA-seq and usually two to three oligonucleotide probes on the microarray (Fig. S1A). Consequently, cross-comparisons between the two focused on genes and exon signals that correlated well overall.
Canonical and Alternative Splice Sites Identified by RNA-Seq Junction Reads.
Naïve CD4+ T- and CD19+ B-cell populations were sorted from C57BL/6 mice and processed for Illumina paired-end sequencing, generating 146 × 106 and 159 × 106 genome-mappable reads for B and T cells, respectively. For reads that did not have contiguous sequence alignment on the genome and represented RNA splice junctions, we used the TopHat tool to identify splice junctions (20) (SI Materials and Methods). To minimize noise for subsequent analysis, we only considered junctions identified in at least 10 independent reads of one dataset, requiring that reads map uniquely to different start coordinates. All splice junction data are available for browsing at www.immgen.org.
We characterized splice junctions as canonical or alternative using the University of California, Santa Cruz (UCSC) known gene annotations as a reference. Because annotated isoforms are an evolving reference, we collapsed all exons in their linear order on the mouse genome, irrespective of prior isoform assignment. A junction that perfectly linked two consecutive exons was classified as canonical, whereas all others were classified as alternative in the various categories denoted in Fig. 1A (Dataset S1 shows a full list). In CD4+ T cells, 82.6% of all junctions were perfectly matched to canonical boundaries; 4.6% matched known exon boundaries but with a skipped exon, and 12.48% used alternative splice donors or acceptors. Frequencies were essentially identical in B cells; 59.8% and 60.8% of expressed genes in CD4+ T and CD19+ B cells, respectively, had alternatively spliced isoforms in these datasets. In 44.3% of cases, the encoded protein would be changed, because either or both sides of the splice junction mapped to protein-coding regions of mRNAs.
Fig. 1.
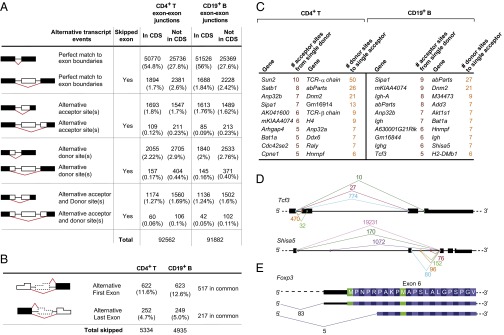
Characterization of splicing junctions from RNA-seq data in CD4+ T and CD19+ B cells. (A) Number (and percent) of reads falling into each of the categories separated by junctions affecting or not affecting the protein-coding sequence (CDS). (B) Number (and percent) of reads affecting the first (denoting an alternative transcriptional start site) or last (denoting alternative polyadenylation) exons in transcripts. (C) Genes with instances of multiple acceptors for a single splice donor and vice versa. (D) Examples of such multiple acceptor or donor sites (Shisa5 and Tcf3) with the number of reads. (E) Alternative acceptor in the sixth exon of Foxp3, which encodes an N-truncated protein.
Among these AS events, we detected expected variation, such as the differential splicing in T and B cells of exons 4–6 of the Ptprc gene, encoding the functionally distinct isoforms of CD45; 33.7% of these AS forms had not been described previously in mRNA isoforms recognized by the major databases. For example, we noted an isoform of Foxp3 occurring in 6.5% of transcripts, with an acceptor site just downstream of the normal initiation codon, which resulted in an 8-aa N-terminal truncation (Fig. 1E). Because an insertion mutation in the same region of FoxP3 affects its ability to interact with particular cofactors and modulates the ability of regulatory T cells (Tregs) to control Thelper-, Th1-, or Th17-type responses (21, 22), this natural FoxP3 isoform may differentially control Treg subphenotypes (23).
In addition to AS events, junction analysis identified 1,012 cases where the junction fell outside the confines of the nominal first exon, indicating that 5.5% of genes use alternative promoters (Fig. 1B). Conversely, differential signals in the 3′ UTRs may reflect AS or alternative polyadenylation sites.
AS events have the potential to generate thousands of protein isoforms from a single gene. For instance, the Drosophila Dscam locus produces a large number of isoforms important in neural development and immune recognition by mutually exclusive AS of tandem duplicated exons (24, 25). Motivated by these examples, we searched for instances of multiple acceptors to a single donor exon (or multiple donors to the same acceptor). As might have been expected, genes encoding antigen-specific receptors appeared prominently in this selection: Ig in B cells or T-cell receptor segments in T cells. Although no other genes exhibited the same degree of diversity, multiple variants were identified in several genes (Fig. 1C). Intriguing examples include Shisa5, which encodes Scotin, a p53-inducible proapoptotic protein that also affects the Wnt signaling pathway. A few C-terminal isoforms of Shisa5 have been previously reported, but these seven variants (Fig. 1D) seem likely to affect the specificity of its interactions. Tcf3 encodes E2A, an E-box binding transcription factor with key roles in lymphocyte differentiation, and these numerous variants (Fig. 1D) bring additional diversity to the known variants of its helix–loop–helix domain.
Exon inclusion or exclusion (skipping) evolves and partakes closely in cell differentiation. To analyze the tissue specificity of exon skipping, we defined a skipping ratio [the ratio between junctions in which an exon is skipped divided by those junctions in which it is included (defining an exon as present in junctions that map within ±4 bp of its annotated boundaries)]. From the comparison of skipping ratios in T and B cells (Fig. 2A), 22.9% of the skipping events were cell type specific, although exons were mostly included or mostly excluded in equivalent proportions in B and T cells. Exons exclusively skipped in one cell type exhibited two patterns: some trivially belonged to genes only expressed in that cell (23.5% and 31.6% in CD4 and CD19 cells, respectively). However, many of these cell-specific skipping events corresponded to genes expressed in both cell types (falling along the diagonal in Fig. 2 B and D and Dataset S3 has the listing). This observation suggests that sizeable differential control of exon use exists between cells as closely related as T and B lymphocytes.
Fig. 2.

Relative abundance of skipped exons in CD4+ T and CD19+ B cells. (A) Skipping ratio is defined as the number of RNA-seq reads in which an exon is skipped relative to the total number of reads (estimated from neighboring exons reads), and it is plotted for B and T lymphocytes. (B–D) Integrated gene-level expression of CD4+ T and CD19+ B cells, highlighting genes with (C) exons equally skipped in both cells (blue) or (B and D) exons exclusively skipped in B or T cells, respectively.
Exons that were skipped in both CD4+ T and CD19+ B cells belonged to genes equally expressed in both populations (Fig. 2C). Gene ontology representation analysis showed that loci with exons skipped in the two cell types included many genes related to histone modification (acetylation and methylation), such as Myst2, Myst3, and Dnmt3b, but also splicing regulators, such as Hnrnpf and Hnrnpd (Dataset S2).
Differential Exon Use Across ImmGen Populations.
Next, we exploited the unique opportunity provided by the ImmGen microarray data to characterize AS across a wide range of immunologic lineages. We sought to identify differentially expressed exons relative to integrated signals for the gene as a whole, analyzing the distribution in different populations to distinguish true differential splicing from technical variation in probe performance. ImmGen uses Affymetrix mouse 1.0ST arrays, which do not contain probes spanning splice junctions, but each exon is targeted by at least one and sometimes, several oligonucleotide probes, such that exon-specific signals can be parsed, which was previously proposed in refs. 16 and 26. Because we used the RNA-seq data from CD4+ T and B lymphocytes to validate the microarray findings, we restricted the analysis to genes correlated between RNA-seq and microarray data (171,000 probes in 75,673 exons from 7,261 genes) (SI Materials and Methods) and 172 ImmGen cell populations with the highest-quality datasets.
We developed two complementary methods to discover AS exons. In the exon-centric approach, we tested whether some populations were discordant for the expression of a given probe relative to the gene as a whole by fitting a linear regression model between the expression values across all cell types of an individual feature and the corresponding gene (summarized from all probes). As illustrated for Slc20a (Fig. 3A), most probes yielded signals well-correlated with expression of the gene (Fig. 3A, Left), but a fraction showed a clear separation of signals for a group of cell types [dendritic cell (DC) populations] (Fig. 3A, Right). In many cases, the divergent cell types proved to belong to a particular lineage or differentiation state. This fit generated residual values for each sample and each probe. We combined the residual values from probes mapping to the same exon and profiling replicates to generate a metric for a given exon and a given population as a measure of deviation of the exon’s expression. For robust detection, voluntarily erring on the side of underdetection, we only flagged AS events by high residual value and exon expression lower than gene expression, retaining instances only when all probes within an exon were concordant and showed similar behavior in five or more cell types. This process flagged 1,761 probes in 865 genes. For validation, we asked whether the T- and B-cells RNA-seq data contained the skipped exon junction sequences predicted from the AS exons thus flagged. Indeed, the exons flagged with the highest residual metric (top 50 AS exons in a given population) yielded a good rate of confirmation in the junction reads (20% or better; the frequency dropped at lower ranks) (Fig. S2). We interpret the unconfirmed hits as representing the limitation of junction read representation, which was discussed above for exon quantitation by RNA-seq.
Fig. 3.

Alternative splicing revealed by feature-level analysis of ST1.0 microarray data. (A) Examples showing the expression of a single exon vs. expression of the corresponding gene across all ImmGen cell types; red highlights (Right) denote DC lineage cells. (B) Plot of every exon’s expression vs. the integrated expression of the corresponding gene in one cell type (here, CD19+ B cells). Exons found to be skipped in the RNA-seq junction data are highlighted (skipping ratio ≥ 0.5).
In the population-centric approach, we tested which exons had a skewed expression in a given cell type by flagging all exons with a low exon to gene expression ratio using the process validated above for RNA-seq data. As illustrated in Fig. 3B for CD19+ B cells, a shoulder was observed in the gene/exon scatter plot (low exon/high gene expressions), and these exons were enriched for AS events identified in the RNA-seq junction sequences (Fig. 3B, red dots). Such a bias can also result as an artifact of hybridization noise or from poorly performing probes (dead probes). Thus, we dropped from consideration exons for which the exon/gene bias was present in >95% or <5% of populations (SI Materials and Methods). This process identified 3,556 exons in 1,654 genes with a differential exon use pattern.
Combining the exons flagged by either approach identified 4,321 differentially spliced exons in 1,842 genes (listed in Dataset S4). Although the stringent selection criteria dropped many true signals, they minimized false positives, and the results have sufficient breadth to cover a large number of events and discern general structure in the patterns of alternative splicing. These analyses captured only AS events that varied between immunologic cell types and unavoidably missed AS events with uniform distribution.
On this basis, we asked how patterns of exon exclusion or inclusion distribute across cell types. Using the inclusion/exclusion estimate of AS exons as a metric, we applied an optimized k-means clustering to group exons according to their use patterns. Overall, 1,447 exons (33.5%) did not follow any recognizable or repeated pattern, reflecting unique or rare patterns, or noise. However, 2,872 alternatively spliced exons (66.4%) fell into specific patterns (Fig. 4). There was a clear symmetry in the pattern of inclusion, such that one cluster could often be paired with a mirror image of exclusion in another cluster (e.g., cl3 and -4). Some clusters followed a clear demarcation between myeloid and lymphoid cell types (cl7 and -8); several distinguished granulocytes from all other cell types (cl5, -2, -3, -4, and -5). The functional similarity between natural killer (NK) cells and activated CD8+ T cells was reflected in cl11. A dominant trend, visible in all clusters but most apparent in some clusters (particularly clear in cl3, -4, -23, and -24), distinguished early differentiation (stem and progenitor cells, pre/pro-B cells, and preselection thymic T cells) and activated effectors from resting mature cells.
Fig. 4.

Distribution of exon inclusion/exclusion patterns across all cell types. Optimized k-means clustering of 4,321 flagged exons across the ImmGen cell types partitioned exon distributions into 28 clusters. Inclusion/exclusion ratios (exon/gene expression ratios) are shown (Dataset S4 has a full listing). Clusters 25–28 (1,447 exons, 33.5% of exons considered) did not follow any strong or reproducible pattern, reflecting unique, rare patterns or noise.
The AS discovery strategy flagged exon 6 of Ptprc, although it did not belong to the large cospliced clusters. On closer examination, it appeared that Ptprc-ex6 has an inclusion/exclusion pattern shared by only a small number of genes (including Dnajc8, Lonp1, and Pfkl, with Atp11a showing an antithetical pattern). Thus, of all of the exons listed in Dataset S4, some seem to have a cell specificity that is shared with many others, whereas others seem to follow more specific patterns. A full list of populations included in the analysis is provided in Dataset S5.
Correlation with Splicing Regulators.
Splicing involves an array of factors that partake in the different steps of the splicing process, a number of which confer the cell type specificities highlighted above (27). We attempted to associate the patterns of exon inclusion/exclusion observed across the ImmGen cell types with expression of known splicing factors. From gene ontology annotation, we compiled a list of 165 genes associated with mRNA processing and AS and reliably expressed across immunologic cell types. We then correlated the expression patterns of these candidate regulators with the matrix of exon exclusion/inclusion indices. Probabilities of association were derived from the distribution of correlation coefficients (per regulator and per exon) relative to a random selection of genes across ImmGen datasets, and a false discovery rate was calculated by the Benjamini–Hochberg procedure; 7,536 such pairs scored at a corrected false discovery rate < 0.5%. Examination of these pairs revealed many regulators correlated with many exons, which was explained by the expression patterns of many regulators expressed along the same differentiation/proliferation pattern that was observed in the dominant inclusion/exclusion clusters of Fig. 4. However, a group of 27 regulators showed different expression patterns (Fig. 5B and Dataset S6) and significantly correlated with a small number of target exons (Fig. 5C). This group included Ptprc_ex6 paired with Hnrpll. Because hnRPLL has been convincingly shown to regulate Ptprc splicing (10–12), this rediscovery through unsupervised analysis provided a measure of verification of the process.
Fig. 5.
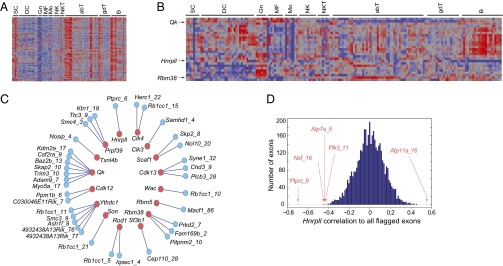
Relation between exon differential use and expression of splicing regulators. Expression of splicing regulators across the ImmGen populations; (A) 27 regulators have distinct patterns of expression, and (B) 138 splicing regulators cluster around one pattern of expression. (C) Significant associations between splicing regulators and inclusion/exclusion of individual exons. (D) Correlation between Hnrpll expression and inclusion/exclusion ratios of all 4,321 flagged exons.
Discussion
We have performed an in-depth analysis of splicing events in immune cells, thus beginning the development of a reference map cataloguing splicing events in the immune system. It is clear that there are still many surprises in the exploration of AS: 30% of AS junctions identified by RNA-seq had not been previously noted, and casual browsing revealed an isoform of Foxp3, with a position that suggests a function in the differential control of Treg function.
Algorithms that parse exon elements in short-read RNA-seq are not completely codified and still evolving. For instance, very short exons can be missed. The analysis of microarray data for differential exon use by both paths used detects only events that vary between cell types, and our deliberate strategy to flag only the most robust AS signals certainly left out many events.
In addition to the identification of AS events affecting internal exons, analysis of exon expression from the microarray data showed that many differentially included exons are located at the 5′ or 3′ end of the genes (40% of the events identified). Some of the 5′ events denote transcriptional pausing, in which RNA polymerase II initiates transcription, even in cell types in which the gene is not effectively expressed, but without additional elongation (28). Others denote alternative promoters and initiation sites, which may affect translational control pathways. Conversely, differential signals in the 3′ UTRs may reflect AS or alternative polyadenylation sites, and they may lead to different sensitivities to regulation by microRNAs (15).
Although most splicing events were among canonical neighboring exons and mapped perfectly to annotated exon boundaries, 17% of junctions corresponded to some form of AS, affecting 60% of expressed genes. This number is on the low end of the range mentioned in the literature (55–95%) (3–6), perhaps because we focused on a single system; also, we ignored junctions observed in one or a few independent reads, and hence, they were more likely to represent noise. AS expands the genome’s coding capacity and provides an orthogonal mode of regulation throughout cell differentiation or activation. Indeed, we observed that the distribution of alternative isoforms differed between B and T cells for genes that were otherwise equally expressed in both cell types. Splicing regulators themselves are subject to AS (e.g., Hnrnpc, Hnrnpd, and Hnrnpm), potentially providing fine combinatorial control.
Isoforms that included or skipped individual exons in T and B cells tended to be preferentially very frequent or very rare. Cases of balanced representation of inclusion and exclusion were clearly the minority (as shown in Fig. 2), a distribution that may point to an all or none biochemistry of AS, which has been noted in myocyte differentiation (29).
However, a proportion of AS events may have little or no functional significance with regard to the encoded protein (3, 30): 45% fall outside of the protein-coding region, and some modify only a few amino acids in structurally tolerant domains, such as leader peptides or Gln-rich domains.
The dominant patterns of differential exon inclusion/exclusion across immunologic cell types did not map to single differentiated lineages. Only a minority separated myeloid/lymphoid lines. Granulocytes were perhaps the exception, clearly standing out among the inclusion/exclusion clusters shown in Fig. 4. Instead, a dominant watermark corresponded to immature precursors and responding effector T cells. These cell types also correspond to active cell cycling. Thus, a major adaptation of splicing pattern seems to accompany the exit from cell cycling and differentiation, to mature resting states. Correspondingly, we observed that many of the genes with products that partook in mRNA splicing and processing were transcriptionally regulated along the same lines.
Several instances of AS showed distinct patterns (some corresponding with correlated expression of a candidate splicing regulator). Among these instances was the well-known example of Ptprc-ex6, and we rediscovered its regulation hnRPLL (10–12). The cell type distribution of this AS event seems to be shared with only a few other transcripts [of 134 candidate targets proposed in the work by Oberdoerffer et al. (10) from transfection experiments and addressed by our analyses, none seemed to correlate with Ptprc-ex6 exclusion or Hnrpll expression], perhaps suggesting a dedicated mode of control of this essential modulator of lymphocyte activation (31).
This analysis provides an initial comparison of AS events across the immune system. The data presented here and the interactive website of the ImmGen project should serve as valuable community resources.
Materials and Methods
RNA-Seq Data.
RNA from CD4+ T and CD19+ B cells was processed for paired-end sequencing (2 × 76 bp; Illumina Hiseq-2), resulting in 146 × 106 and 159 × 106 mappable reads. We estimated gene expression level using Cufflinks software, a transcript assembly and abundance estimator algorithm (29). We mapped the RNA-seq data to the mm9 (NCBIM37) genome assembly using TopHat (18), version 1.1.4, and required that reads map uniquely. Using the UCSC known gene annotations, we computed gene expression estimates using Cufflinks (29). Sequencing reads mapping to predicted splice junctions were extracted from the TopHat junctions output file. RNA-seq quality control metrics are listed in Dataset S6.
Microarray Data.
All data were generated within the ImmGen Consortium on Affymetrix MoGene1.0 ST microarrays; most have been reported, and all are accessible in the GEO with accession number GSE15907. The analysis was limited to 172 populations (listed in Dataset S5), excluding nonhematopoietic cell types and samples with lesser dynamic range.
Supplementary Material
Acknowledgments
We thank Dr. Vincent Butty for discussion. This work was supported by National Institutes of Health/National Institute of Allergy and Infectious Diseases Grant R24AI072073 (to D.M. and C.B.).
Footnotes
The authors declare no conflict of interest.
2A complete list of the ImmGen Consortium can be found in SI Materials and Methods.
This article contains supporting information online at www.pnas.org/lookup/suppl/doi:10.1073/pnas.1311839110/-/DCSupplemental.
Contributor Information
Collaborators: David A. Blair, Michael L. Dustin, Susan A. Shinton, Richard R. Hardy, Tal Shay, Aviv Regevc, Nadia Cohen, Patrick Brennan, Michael Brenner, Francis Kim, Tata Nageswara Rao, Amy Wagers, Tracy Heng, Jeffrey Ericson, Katherine Rothamel, Adriana Ortiz-Lopez, Diane Mathis, Christophe Benoist, Taras Kreslavsky, Anne Fletcher, Kutlu Elpek, Angelique Bellemare-Pelletier, Deepali Malhotra, Shannon Turley, Jennifer Miller, Brian Brown, Miriam Merad, Emmanuel L. Gautier, Claudia Jakubzick, Gwendalyn J. Randolph, Paul Monach, Adam J. Best, Jamie Knell, Ananda Goldrath, Vladimir Jojic, Daphne Koller, David Laidlaw, Jim Collins, Roi Gazit, Derrick J. Rossi, Nidhi Malhotra, Katelyn Sylvia, Joonsoo Kang, Natalie A. Bezman, Joseph C. Sun, Gundula Min-Oo, Charlie C. Kim, and Lewis L. Lanier
References
- 1.Wang ET, et al. Alternative isoform regulation in human tissue transcriptomes. Nature. 2008;456(7221):470–476. doi: 10.1038/nature07509. [DOI] [PMC free article] [PubMed] [Google Scholar]
- 2.Kelemen O, et al. Function of alternative splicing. Gene. 2013;514(1):1–30. doi: 10.1016/j.gene.2012.07.083. [DOI] [PMC free article] [PubMed] [Google Scholar]
- 3.Tress ML, et al. The implications of alternative splicing in the ENCODE protein complement. Proc Natl Acad Sci USA. 2007;104(13):5495–5500. doi: 10.1073/pnas.0700800104. [DOI] [PMC free article] [PubMed] [Google Scholar]
- 4.Johnson JM, et al. Genome-wide survey of human alternative pre-mRNA splicing with exon junction microarrays. Science. 2003;302(5653):2141–2144. doi: 10.1126/science.1090100. [DOI] [PubMed] [Google Scholar]
- 5.Modrek B, Lee C. A genomic view of alternative splicing. Nat Genet. 2002;30(1):13–19. doi: 10.1038/ng0102-13. [DOI] [PubMed] [Google Scholar]
- 6.Pan Q, Shai O, Lee LJ, Frey BJ, Blencowe BJ. Deep surveying of alternative splicing complexity in the human transcriptome by high-throughput sequencing. Nat Genet. 2008;40(12):1413–1415. doi: 10.1038/ng.259. [DOI] [PubMed] [Google Scholar]
- 7.Merkin J, Russell C, Chen P, Burge CB. Evolutionary dynamics of gene and isoform regulation in Mammalian tissues. Science. 2012;338(6114):1593–1599. doi: 10.1126/science.1228186. [DOI] [PMC free article] [PubMed] [Google Scholar]
- 8.Alt FW, et al. Synthesis of secreted and membrane-bound immunoglobulin mu heavy chains is directed by mRNAs that differ at their 3′ ends. Cell. 1980;20(2):293–301. doi: 10.1016/0092-8674(80)90615-7. [DOI] [PubMed] [Google Scholar]
- 9.Martinez NM, Lynch KW. Control of alternative splicing in immune responses: Many regulators, many predictions, much still to learn. Immunol Rev. 2013;253(1):216–236. doi: 10.1111/imr.12047. [DOI] [PMC free article] [PubMed] [Google Scholar]
- 10.Oberdoerffer S, et al. Regulation of CD45 alternative splicing by heterogeneous ribonucleoprotein, hnRNPLL. Science. 2008;321(5889):686–691. doi: 10.1126/science.1157610. [DOI] [PMC free article] [PubMed] [Google Scholar]
- 11.Topp JD, Jackson J, Melton AA, Lynch KW. A cell-based screen for splicing regulators identifies hnRNP LL as a distinct signal-induced repressor of CD45 variable exon 4. RNA. 2008;14(10):2038–2049. doi: 10.1261/rna.1212008. [DOI] [PMC free article] [PubMed] [Google Scholar]
- 12.Wu Z, et al. Memory T cell RNA rearrangement programmed by heterogeneous nuclear ribonucleoprotein hnRNPLL. Immunity. 2008;29(6):863–875. doi: 10.1016/j.immuni.2008.11.004. [DOI] [PMC free article] [PubMed] [Google Scholar]
- 13.Castle JC, et al. Expression of 24,426 human alternative splicing events and predicted cis regulation in 48 tissues and cell lines. Nat Genet. 2008;40(12):1416–1425. doi: 10.1038/ng.264. [DOI] [PMC free article] [PubMed] [Google Scholar]
- 14.Laderas TG, et al. Computational detection of alternative exon usage. Front Neurosci. 2011;5:69. doi: 10.3389/fnins.2011.00069. [DOI] [PMC free article] [PubMed] [Google Scholar]
- 15.Sandberg R, Neilson JR, Sarma A, Sharp PA, Burge CB. Proliferating cells express mRNAs with shortened 3′ untranslated regions and fewer microRNA target sites. Science. 2008;320(5883):1643–1647. doi: 10.1126/science.1155390. [DOI] [PMC free article] [PubMed] [Google Scholar]
- 16.Robinson MD, Speed TP. Differential splicing using whole-transcript microarrays. BMC Bioinformatics. 2009;10:156. doi: 10.1186/1471-2105-10-156. [DOI] [PMC free article] [PubMed] [Google Scholar]
- 17.Katz Y, Wang ET, Airoldi EM, Burge CB. Analysis and design of RNA sequencing experiments for identifying isoform regulation. Nat Methods. 2010;7(12):1009–1015. doi: 10.1038/nmeth.1528. [DOI] [PMC free article] [PubMed] [Google Scholar]
- 18.Trapnell C, Pachter L, Salzberg SL. TopHat: Discovering splice junctions with RNA-Seq. Bioinformatics. 2009;25(9):1105–1111. doi: 10.1093/bioinformatics/btp120. [DOI] [PMC free article] [PubMed] [Google Scholar]
- 19.Heng TS, Painter MW. Immunological Genome Project Consortium The Immunological Genome Project: Networks of gene expression in immune cells. Nat Immunol. 2008;9(10):1091–1094. doi: 10.1038/ni1008-1091. [DOI] [PubMed] [Google Scholar]
- 20.Trapnell C, et al. Differential gene and transcript expression analysis of RNA-seq experiments with TopHat and Cufflinks. Nat Protoc. 2012;7(3):562–578. doi: 10.1038/nprot.2012.016. [DOI] [PMC free article] [PubMed] [Google Scholar]
- 21.Darce J, et al. An N-terminal mutation of the Foxp3 transcription factor alleviates arthritis but exacerbates diabetes. Immunity. 2012;36(5):731–741. doi: 10.1016/j.immuni.2012.04.007. [DOI] [PMC free article] [PubMed] [Google Scholar]
- 22.Bettini ML, et al. Loss of epigenetic modification driven by the Foxp3 transcription factor leads to regulatory T cell insufficiency. Immunity. 2012;36(5):717–730. doi: 10.1016/j.immuni.2012.03.020. [DOI] [PMC free article] [PubMed] [Google Scholar]
- 23.Feuerer M, Hill JA, Mathis D, Benoist C. Foxp3+ regulatory T cells: Differentiation, specification, subphenotypes. Nat Immunol. 2009;10(7):689–695. doi: 10.1038/ni.1760. [DOI] [PubMed] [Google Scholar]
- 24.Graveley BR. Alternative splicing: Increasing diversity in the proteomic world. Trends Genet. 2001;17(2):100–107. doi: 10.1016/s0168-9525(00)02176-4. [DOI] [PubMed] [Google Scholar]
- 25.Pal S, Wu LP. Pattern recognition receptors in the fly: Lessons we can learn from the Drosophila melanogaster immune system. Fly (Austin) 2009;3(2):121–129. doi: 10.4161/fly.8827. [DOI] [PubMed] [Google Scholar]
- 26.Della Beffa C, Cordero F, Calogero RA. Dissecting an alternative splicing analysis workflow for GeneChip Exon 1.0 ST Affymetrix arrays. BMC Genomics. 2008;9:571. doi: 10.1186/1471-2164-9-571. [DOI] [PMC free article] [PubMed] [Google Scholar]
- 27.Wang Z, Burge CB. Splicing regulation: From a parts list of regulatory elements to an integrated splicing code. RNA. 2008;14(5):802–813. doi: 10.1261/rna.876308. [DOI] [PMC free article] [PubMed] [Google Scholar]
- 28.Giraud M, et al. Aire unleashes stalled RNA polymerase to induce ectopic gene expression in thymic epithelial cells. Proc Natl Acad Sci USA. 2012;109(2):535–540. doi: 10.1073/pnas.1119351109. [DOI] [PMC free article] [PubMed] [Google Scholar]
- 29.Trapnell C, et al. Transcript assembly and quantification by RNA-Seq reveals unannotated transcripts and isoform switching during cell differentiation. Nat Biotechnol. 2010;28(5):511–515. doi: 10.1038/nbt.1621. [DOI] [PMC free article] [PubMed] [Google Scholar]
- 30.Leoni G, Le Pera L, Ferrè F, Raimondo D, Tramontano A. Coding potential of the products of alternative splicing in human. Genome Biol. 2011;12(1):R9. doi: 10.1186/gb-2011-12-1-r9. [DOI] [PMC free article] [PubMed] [Google Scholar]
- 31.Hermiston ML, Xu Z, Weiss A. CD45: A critical regulator of signaling thresholds in immune cells. Annu Rev Immunol. 2003;21:107–137. doi: 10.1146/annurev.immunol.21.120601.140946. [DOI] [PubMed] [Google Scholar]
Associated Data
This section collects any data citations, data availability statements, or supplementary materials included in this article.