

Abstract
We sought to advance methodology for studying microglial activation and putative therapeutic downregulation in response to minocycline by means of noninvasive in vivo imaging. A reproducible focal white matter lesion was used to reliably compare treatment conditions.
Methods
The corpus callosum of female Sprague Dawley rats was injected with zymosan to promote microglial activation as confirmed by hematoxylin and eosin staining, 3H-PK11195 autoradiography, and CD11b immunohistochemistry. A subset of subjects was treated systemically with minocycline to potentially alter microglial activation. Seven days after zymosan injection, subjects were imaged with PET using the radiotracer 11C-(R)-PK11195. In vivo binding was evaluated using the distribution volume ratio (DVR) with respect to a reference region.
Results
At the lesion site, the observed 11C-(R)-PK11195 DVR for each treatment was as follows: mean saline DVR ± SD, 1.17 ± 0.05 (n = 5); zymosan-only DVR, 1.96 ± 0.33 (n = 10); and zymosan with minocycline DVR, 1.58 ± 0.12 (n = 9). Therefore, compared with controls, zymosan increased binding (P = 0.0001, 2-tailed t test) and minocycline treatment reduced zymosan-induced binding by 46% (P = 0.004, 2-tailed t test).
Conclusion
Zymosan-induced microglial activation and its response to minocycline can be quantitatively imaged in the rat brain using 11C-(R)-PK11195 PET. The ability to detect a treatment effect in a focal white-matter lesion may be of use in studying therapies for multiple sclerosis (MS).
Keywords: Microglia, zymosan, minocycline, positron emission tomography, multiple sclerosis
The ability to monitor white-matter inflammation in the central nervous system and detect changes after the administration of antiinflammatory compounds is of great importance in several diseases, including multiple sclerosis (MS). We sought to determine whether PET could detect increases in binding of 11C-(R)-PK11195 in focal white-matter inflammatory lesions in the rat brain and could detect reduction of this effect by minocycline treatment.
Under normal physiologic conditions, microglia are distributed throughout the central nervous system in a quiescent state (1). However, microglia become activated in response to a pathologic insult, primarily at the site of injury (2). The prolonged release of proinflammatory cytokines by microglia is thought to play a critical role in chronic inflammation and long-term damage in the central nervous system of MS patients (3). Activation of the components of the innate immune system, such as microglia, is mediated by Toll-like receptors (1,4). The injection of zymosan, a cell wall preparation from Saccharomyces cerevisiae that acts as a Toll-like receptor-2 agonist, into white matter has been found to activate resident microglia and produce focal inflammatory lesions that resemble certain aspects of those found in MS patients (5–7).
Minocycline is a second-generation tetracycline that displays antibiotic activity across a wide range of bacterial types and also possesses antiinflammatory activity (8). Mino-cycline is being tested in clinical trials in MS patients and has thus far shown great promise as a potential MS treatment (9–12). In contrast to most of the immunosuppressive treatments available for MS patients, which predominantly target components of the adaptive immune system, minocycline also exhibits direct effects on components of the innate immune system, including microglia (13,14).
The isoquinoline PK11195 binds to the translocator protein (18 kDa), whose expression is thought to be enhanced in microglia during activation (2,15–17). The radiolabeled isomer 11C-(R)-PK11195 has been imaged with PET in humans, including MS patients in whom its uptake has been correlated with MRI measures and postmortem histology (15,18–21). 11C-(R)-PK11195 has also been used with PET to detect microglial activation in rodent models of human disease involving neuroinflammation (22–25).
This study was designed to establish a focal model of inflammation in the corpus callosum of the rat brain and determine whether this inflammation led to increased 11C-(R)-PK11195 binding as measured by PET and whether systemic treatment with the antiinflammatory compound minocycline would reduce this effect.
MATERIALS AND METHODS
Animal Model
Sprague Dawley rats (Harlan) (female; n = 26; mean weight ± SD, 250 ± 19 g) were used in these experiments. All procedures were approved by the University of Wisconsin–Madison Animal Care and Use Committee. Under isoflurane anesthesia, rats were placed in a stereotactic apparatus. A midline incision was made in the scalp to expose the skull, and a microdrill was used to drill a burr hole 2 mm lateral to the bregma. A pulled glass micropipette was loaded with either saline or a 25 mg/mL concentration of zymosan A (Sigma-Aldrich) and lowered vertically to a depth of 2.5 mm through the burr hole, to position the tip of the micropipette in the corpus callosum. Using a microsyringe pump, 2 μL of saline or zymosan A were injected into the corpus callosum over 5 min. A subset of zymosan-injected rats received daily intraperitoneal injections of saline-dissolved minocycline (Sigma-Aldrich) starting on the day of zymosan injection at a dose of 45 mg/kg of body weight (13,14,26,27). Seven days after saline or zymosan injection, subjects were scanned with 11C-(R)-PK11195 PET.
Histologic Analysis of Saline- and Zymosan-Injected Brain Sections
Hematoxylin and Eosin Staining of Paraffin-Embedded Tissue
Seven days after saline or zymosan injection, rats to be used for hematoxylin and eosin staining were euthanized and perfused transcardially with phosphate-buffered saline and 4% paraformaldehyde in 0.1 M phosphate buffer. The brain was removed and postfixed in 4% paraformaldehyde overnight. The following day, brains were trimmed to a 2-mm coronal section containing the saline or zymosan injection site and fixed in 10% formalin for paraffin embedding. Paraffin-embedded brain sections were cut at 3 mm and mounted on slides for hematoxylin and eosin staining. These rats did not undergo PET.
Autoradiography and Immunohistochemistry of Frozen Brain Tissue
After PET scanning, rats to be used for autoradiographic studies were euthanized, and their brains were removed and flash-frozen in liquid nitrogen. Transverse brain sections were cut with a chilled cryotome at 20 μm, thaw-mounted on poly-L-lysine slides, and stored at −80oC for future use. 3H-PK11195 binding studies were performed as described in the study by Vowinckel (18). Briefly, slide-mounted brain sections were thawed, rehydrated in Tris buffer, and incubated with 1 nM 3H-PK11195 (specific activity, 3.1 MBq/nmol; Perkin-Elmer) at room temperature for 60 min. Following washes with Tris buffer and water, brain slices were exposed to 3H-Hyperfilm (Amersham) for 10–14 days. Nonspecific binding was determined by including 10 μM unlabeled PK11195 in some binding reactions. To confirm 3H-PK11195 binding to sites of microglial activation, adjacent slide-mounted brain sections were thawed and incubated with anti-CD11b monoclonal antibody (OX42; Serotec) after endogenous peroxidase was quenched. Brain sections were subsequently incubated with biotinylated horse antimouse IgG (Vector Laboratories) for 3,39′-diaminobenzidine colorimetric staining.
11C-(R)-PK11195 Radiochemistry
The R isomer of PK11195 was labeled with 11C as described elsewhere (28). Briefly, 11C-methane, produced by proton irradiation of a 90:10 mixture of N2:H2, was converted to 11C-methyl iodide, which was in turn used to methylate the precursor (R)-N-desmethyl-PK11195 (ABX). The product was extracted in 10% ethanol:90% bacteriostatic saline before 0.22-μm filtration and injection.
PET Scans
Rats were imaged in the University of Wisconsin–Madison microPET P4 small-animal scanner (Concorde Microsystems Inc.), which provides 7.8-cm axial and 19-cm transaxial fields of view, a 2% sensitivity, and an isotropic reconstructed image resolution of 1.8 mm in full width at half maximum (FWHM) at the center of the field of view (29). To more efficiently use the shortlived radiotracer, rats were scanned 4 at a time, positioned with their brains offset radially 5 cm from the center of the field of view, which is expected to reduce the volumetric resolution (product of radial, axial, and tangential FWHM) from 6 to 21 μL (29). Rats were anesthetized for the duration of the scan session with isoflurane (1%–2% in oxygen) using a system built in-house, which combined the fixed output of a single vaporizer (3% in oxygen) in variable ratios with pure oxygen such that the isoflu-rane concentration for each rat was individually adjustable. Rats were monitored for peripheral oxygen saturation, heart rate, and rectal temperature. Rats were thermally insulated with bubble wrap and warmed with heated blown air. For injection of the radiotracer, 24-gauge catheters were placed in a lateral tail vein and flushed every 15 min with a total of up to 0.5 mL of a heparin solution (10 units/mL) to maintain the patency of the line. Rats were placed on a device built in-house consisting of upper and lower pairs of holders. Each holder used adjustable tooth and ear bars to hold the head fixed. After a 57Co transmission scan (120- to 125-keV energy window), a 90-min emission scan was begun (350–650 keV, 6-ns coincidence window). A single bolus of 11C-(R)-PK11195 was injected (36 ± 5 MBq; specific activity, 35 ± 19 MBq/nmol, intravenously) in each of the 4 rats, with the injection times staggered at 1, 3, 5, and 7 min after scan start. Tracer injections were followed by a 0.25-mL saline flush.
PET Image Reconstruction
Images were reconstructed using the software (microPET Manager 2.3.3.6; ASIPro 6.3.3.0 [Siemens]) provided by the scanner vendor. List data were framed at 20 × 1 min + 4 × 5 min + 5 × 10 min. Events were binned into 3-dimensional sinograms (168 projection angles × 192 bins; span, 3; ring difference, 31; 11 segments), and corrected for detector sensitivity, random coincidences, and dead time. 57Co transmission sinograms were reconstructed to form attenuation coefficient maps (μ-maps), scaled so a region of interest (ROI) in soft tissue had an average value of μ = 0.095 cm−1, and forward-projected to yield calibrated attenuation sinograms. Attenuation and scatter corrections were applied, and images were reconstructed using filtered backprojection with zooms and offsets centered on each rat (Fourier 2-dimensional rebinning; image matrix size, 128 × 128; pixel size, 0.47 mm × 0.47 mm in-plane × 1.21-mm slice thickness, ramp filter). Images were decay-corrected to scan start. For each rat, an alignment reference image was created by summing over 0–4 min after injection of tracer and smoothing with an isotropic 2.0-mm gaussian kernel.
PET Image Alignment
For anatomic identification, the following steps were taken to align the PET images to a cryosection atlas of a 320-g Sprague Dawley rat head (30). The atlas whole brain ROI (2,045 μL) was smoothed with an isotropic 2 mm in FWHM gaussian kernel to approximate the scanner resolution. The summed 0- to 4-min postinjection images of 3 rats were each coarsely aligned manually (Spamalize; http://brainimaging.waisman.wisc.edu/~oakes/spam/spam_frames.htm) and then finely aligned to the brain template using an automated coregistration algorithm with a correlation ratio cost function and 6 degrees of freedom (FSL FLIRT, version 5; Oxford Centre for Functional MRI of the Brain). These images were averaged and used as a target template for all subsequent scans. For all rats, the 0- to 4-min postinjection images were aligned manually and then automatically to the template, and the same transformation matrices were applied to the dynamic images.
Pharmacokinetic Modeling
11C-(R)-PK11195 binding was determined using the Logan graphical reference tissue method (31). A template reference region (280 μL) was drawn in areas of low baseline binding while avoiding the lesion site. The resulting reference region encompassed portions of subcortical structures including thalamus and hippocampus (Supplemental Fig. 1; supplemental materials are available online only at http://jnm.snmjournals.org), and this same reference region was used for all subjects. Distribution volume ratio (DVR) maps were generated (Spamalize) and used for the zymosan and zymosan-plus-minocyline subjects to manually place 16-μL spheric ROIs on the highest-binding portion of the lesion while keeping the ROI within the brain (Supplemental Fig. 2). The mean position of the lesion ROI was determined for these subjects (n = 19). In the cryosection atlas image, this mean lesion position fell on the corpus callosum at 1.7 mm right of the sagittal midplane, 0.4 mm anterior to the bregma, and 1.9 mm ventral to the bregma. Template ROIs (16-μL spheres) were placed at the mean lesion position and contralateral as well as ventrolateral to the mean lesion and contralateral to that position. For each subject, time–activity curves were determined for each ROI. For the subjects that underwent no treatment or saline injection, the template lesion ROI was used, whereas for the zymosan- and zymosan-plus-minocycline–treated subjects, each rat’s individual lesion ROI was used. Time–activity curves were shifted and decay-corrected so time 0 corresponded to the start of 11C-(R)-PK11195 injection for each subject. The Logan graphical reference tissue method was applied with the slope of ∫ target/target versus ∫ reference/target for the period 35–80 min after injection taken as the target-to-reference DVR. All time–activity curves were then linearly interpolated to a set of standard time frames to calculate average time–activity curves for the various treatments. Occupancy of the translocator protein in the target region by nonradioactive tracer can reduce the observed DVR; therefore, tracer mass concentration in the reference region measured in pmol/mL was calculated according to massref = radioactivityref/SA, where radioactivityref was the radioactivity concentration in the reference region 35–80 min after injection of tracer measured in MBq/mL and SA was the tracer specific activity measured in MBq/pmol. To the extent that the reference region was devoid of specific binding, this serves as an estimate of free tracer mass in the target region.
RESULTS
Previous reports have determined that zymosan injection into white matter produces significant proinflammatory effects at 7 d after injection (5–7). To confirm that zymosan injection into the brain produced a localized region of microglial activation that would be detected by PK11195 binding within a similar time frame, saline- and zymosan-injected rats were sacrificed at 7 d after injection (Fig. 1). Brains from these rats were then stained with hematoxylin and eosin to identify white-matter lesions. In contrast to saline-injected brains, which failed to form significant lesions (Fig. 1A), zymosan-injected brains exhibited extensive lesion formation at 7 d after injection (Fig. 1B). Then, to determine whether zymosan-generated inflammatory lesions displayed PK11195 binding, we mounted frozen brain sections from saline- and zymosan-injected rats on slides and incubated them with 3H-PK11195. Injection of saline resulted in minimal binding of 3H-PK11195 (Fig. 1C). However, injection of zymosan resulted in significant 3H-PK11195 binding at the site of the injection (Fig. 1D). The specificity of 3H-PK11195 binding was confirmed by the inclusion of excessive nonradiolabeled PK11195 in binding reactions, which resulted in the disappearance of radioligand binding to the zymosan injection site (Supplemental Fig. 3). Adjacent brain sections were stained with CD11b antibody, a marker for microglia and macrophages. Saline-injected brains demonstrated little detectable CD11b staining (Fig. 1E), whereas zymosan-injected brains displayed significant CD11b staining that localized to the site of radioligand binding, confirming that 3H-PK11195 binding was restricted to sites of microglial accumulation and activation (Fig. 1F).
FIGURE 1.
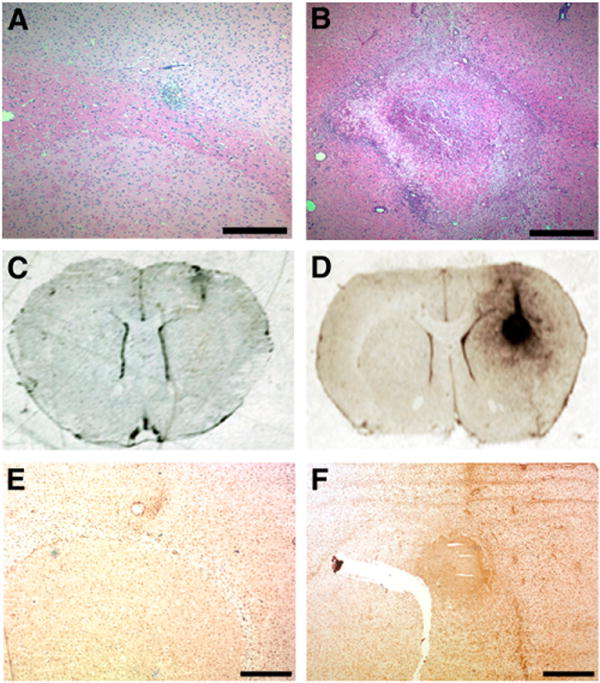
Injection of zymosan into corpus callosum generates inflammatory lesion detectable by 3H-PK11195 binding. Rats receiving either saline (A, C, and E) or zymosan (B, D, and F) injections were sacrificed at 7 d after injection. Brains from these rats were then collected for paraffin embedding and subsequent hema-toxylin and eosin staining (A and B) or for autoradiography (C–D) and immunohistochemistry (E–F). Saline injection failed to produce significant lesion at injection site (A), whereas zymosan injection produced extensive lesion in corpus callosum (B). To confirm that zymosan-triggered lesions exhibited PK11195 binding activity, slide-mounted brain sections from saline- or zymosan-injected rats were incubated with 1 nM 3H-PK11195, washed, and incubated with 3H-Hyperfilm. Injection of saline produced little radioligand binding (C), whereas zymosan insult produced region of strong 3H-PK11195 binding (D). Staining of adjacent brain sections with CD11b antibody confirmed that site of 3H-PK11195 binding in zymosan-injected brain was also region composed of activated microglia (F). In contrast, saline injection resulted in little CD11b staining (E). Scale bar in A and B, 0.5 mm; scale bar in E and F, 1 mm.
Steps in the procedure for alignment of the PET images and placement of ROIs are illustrated in Figure 2. In the zymosan and zymosan-plus-minocycline subjects, the center-to-center distance from the ROIs placed on the lesions to the mean lesion position was 1.2 ± 0.6 mm (n = 19). Average time–activity curves and typical Logan plots are shown in Figure 3.
FIGURE 2.
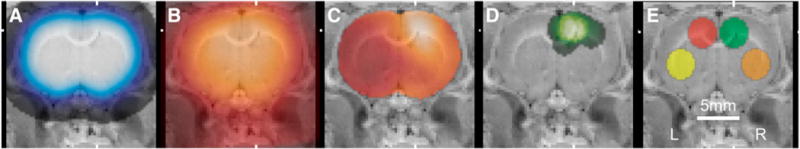
Alignment of PET images and placement of ROIs. Coronal slices were overlaid on cryosection atlas at mean position of zymosan lesion. (A) Smoothed template brain ROI used for initial alignment. (B) Average of 3 aligned images at 0–4 min after injection of 11C-(R)-PK11195 used for subsequent alignment. (C) DVR map of typical subject treated with zymosan. (D) Sum image of spheric ROIs placed on hot spot in zymosan and zymosan-plus-minocycline studies (n = 19). (E) Template ROIs: lesion (green), contralateral (red), ipsilateral ventrolateral (orange), and contralateral ventrolateral (yellow).
FIGURE 3.
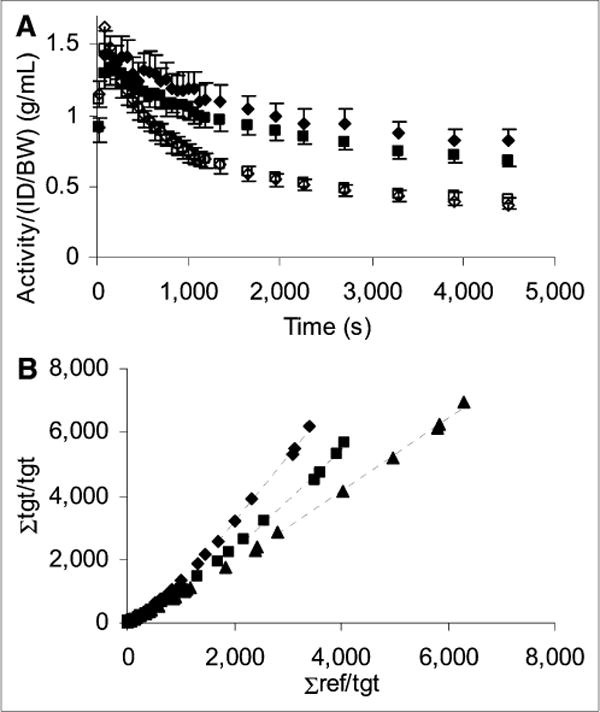
Average time–activity curves and typical Logan plots. (A) Average time–activity curves for zymosan reference (◊) and lesion (◆) (n = 10) and zymosan with minocycline reference (□) and lesion (■) (n = 9). SEM is shown. (B) Logan plots from 3 typical studies: zymosan (◆), zymosan with minocycline (■), and saline (▲). Slope of linear fit (—) yields DVR of lesion site with respect to reference region. ID/BW = injected dose per body weight; ref = reference; tgt = target.
The 11C-(R)-PK11195 PET measures of the effect of the zymosan and zymosan-plus-minocycline treatments are summarized in Figure 4 and Table 1. The lesion-to-reference DVR in the zymosan-treated subjects was greater than that in the saline-treated subjects (P = 0.00012, 2-tailed t test). In the zymosan-plus-minocycline–treated subjects, excess binding in the lesion ROI relative to saline-treated subjects was 46% lower than in the zymosan-treated subjects (P = 0.004, 2-tailed t test). There was no correlation between the lesion DVR and reference region tracer mass concentration in the zymosan-treated rats (not shown, Pearson r2 = 0.01, n = 7, specific activity measures unavailable for 2 of 9 subjects).
FIGURE 4.
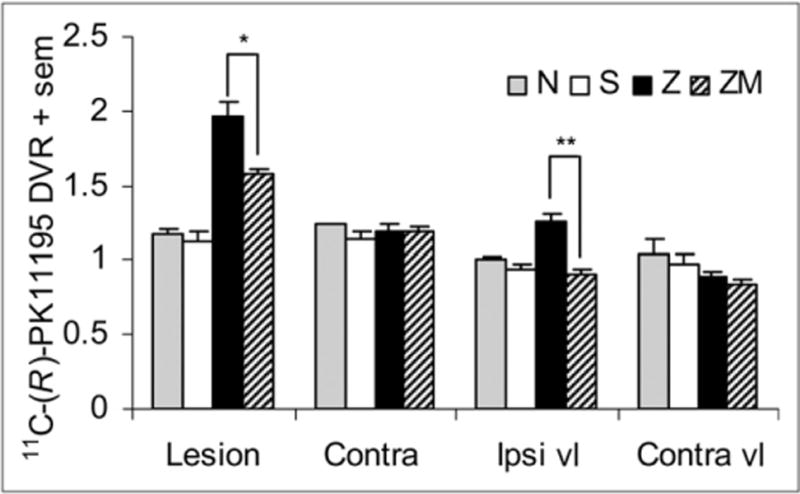
Effect of zymosan and zymosan-plus-minocycline treatment on 11C-(R)-PK11195 binding. Mean DVR for no treatment (N, n = 2), saline injection (S, n = 5), zymosan injection (Z, n = 10), and zymosan injection with minocycline treatment (ZM, n = 9) is shown. Lesion ROIs were drawn individually for Z and ZM whereas a template ROI was applied for N and S. contra = contralateral ROI; ipsi vl = ROI ipsilateral and ventrolateral to template lesion; contra vl = ROI contralateral and ventrolateral to template lesion. Significant differences exist between Z and ZM at lesion ROI (*P = 0.004) and ipsi vl ROI (**P = 0.0001).
TABLE 1.
Effect of Zymosan and Zymosan-Plus-Minocycline Treatment on PET Measures of 11C-(R)-PK11195 Binding
| Treatment
|
|||||
|---|---|---|---|---|---|
| Data | None | Saline | Zymosan | Zymosan plus minocycline | Zymosan vs. zymosan plus minocycline P |
| ROI | |||||
| Lesion | 1.17 ± 05 | 1.13 ± 15 | 1.96 ± 33 | 1.58 ± 12 | 0.004 |
| Contralateral | 1.24 ± 01 | 1.14 ± 12 | 1.19 ± 17 | 1.19 ± 10 | 0.958 |
| Ipsilateral, ventrolateral | 1.01 ± 01 | 0.94 ± 07 | 1.26 ± 18 | 0.91 ± 11 | 0.0001 |
| Contralateral, ventrolateral | 1.04 ± 15 | 0.98 ± 13 | 0.89 ± 13 | 0.84 ± 10 | 0.351 |
|
| |||||
| Experimental parameters | |||||
| n | 2 | 5 | 10 | 9 | |
| Body weight immediately before PET scan (g) | 278 ± 25 | 259 ± 15 | 254 ± 15 | 236 ± 11 | 0.011 |
| ID/BW (kBq/g) | 127 ± 11 | 153 ± 22 | 143 ± 27 | 143 ± 19 | 0.960 |
| SA (MBq/nmol) | 15 ± 05 | 29 ± 20 | 37 ± 23 | 42 ± 15 | 0.608 |
| IM/BW (pmol/g) | 9.5 ± 4.2 | 7.4 ± 3.9 | 8.2 ± 8.9 | 4.3 ± 3.3 | 0.269 |
| Activityref (g/mL) | 0.37 ± 04 | 0.36 ± 05 | 0.43 ± 11 | 0.45 ± 08 | 0.827 |
| Massref (pmol/mL) | 2.9 ± 1.5 | 2.3 ± 1.2 | 3.1 ± 3.1 | 1.5 ± 0.9 | 0.175 |
Activityref = reference region radioactivity/(ID/BW) 35–80 min after injection; ID/BW = injected dose per body weight; IM/BW = injected mass per body weight; Massref = reference region tracer mass concentration at 35–80 min after injection; SA = specific activity. ROI values are 11C-(R)-PK11195 DVRs; all values are mean ± SD; P was calculated by 2-tailed t test.
DISCUSSION
We report here a noninvasive in vivo imaging study of the effect of minocycline on microglial activation within a focal white-matter inflammatory lesion. Because of its potent antiinflammatory effects, minocycline has come under great interest as a potential therapeutic agent in the treatment of MS and other inflammation-mediated diseases. Thus far, the potential antiinflammatory effects of minocycline in MS patients have not been demonstrated by PET using markers of microglial activation such as 11C-(R)-PK11195. However, a recent 1-y trial has shown that minocycline reduced 11C-(R)-PK11195 binding in patients with multiple-system atrophy, Parkinson-type (32). Similar results may be achieved in PET studies with MS patients.
Regarding the results of this study, the PET image alignment and ROI placement procedure yielded approximately 1-mm repeatability in the lesion position in the template image space across subjects (Fig. 2D). This repeatability is good given uncertainties associated with the zymosan injection, anatomic variation, scanner resolution, image alignment, and placement of the ROI. The time–activity curves were generally smooth, and the Logan plots became linear within 30 min of tracer injection (Fig. 3). The similarity of the reference region time–activity curves between conditions suggests that the region is appropriately defined and not significantly affected by the treatments. Qualitatively, there is a clear distinction between the lesion time–activity curves indicating a treatment effect in that region—a distinction that is visually apparent in the Logan plots as well (Fig. 3). There were no significant differences between treatment groups in radiotracer injected dose per body weight (ID/BW), injected tracer mass per body weight (IM/BW), radioactivity per radiotracer injected dose per body weight in the reference region at 35–80 min after injection, or tracer mass in the reference region (Table 1). The zymosan subjects were on average 18 g heavier than the zymosan-plus-minocycline subjects at the time of the PET scan.
The daily administration of minocycline to zymosantreated rats resulted in reduced binding of 11C-(R)-PK11195 at the site of the zymosan insult. The dosage of minocycline used in these studies (45 mg/kg of body weight) has previously been demonstrated to reduce the severity of experimental autoimmune encephalomyelitis in rats (13,14,26,27). The only noticeable side effect of minocycline treatment was a slight reduction in body weight (less than 10% of starting weight). In contrast to the intraperitoneal delivery of minocycline used in this study, minocycline is typically administrated orally in human subjects. A limitation of this study is that there was no daily intraperitoneal control injection of vehicle in the animals that were not treated with minocycline. Although animal models have repeatedly demonstrated the antiinflammatory properties of minocycline by ex vivo analysis of affected tissues, this is the first study, to our knowledge, to demonstrate that PET is capable of monitoring the ability of minocycline to attenuate microglial activation in white-matter inflammatory lesions in the rat brain in vivo.
It is interesting that zymosan caused increased 11C-(R)-PK11195 binding at the region 4 mm ventrolateral to the lesion but that no increased binding was observed at the less distant (3 mm) region contralateral to the lesion. This finding perhaps suggests that recruitment of microglia occurs at significant distances from the site of the insult but not isotropically. Also, minocycline treatment reduced 11C-(R)-PK11195 binding in the ventrolateral region to control levels—that is, roughly 100%—compared with the 46% reduction seen at the lesion itself. It may be speculated that the mechanism for recruiting microglia becomes more amenable to the effect of minocycline as the distance from the site of the insult increases. Longitudinal within-subject studies of this model might shed more light on this question by measuring the time course of microglial activation and response to minocycline.
CONCLUSION
In this study, which demonstrates the ability of highresolution PET to quantify drug efficacy in a small-animal model, microglial activation induced by zymosan and response to minocycline were measured in the rat brain. In zymosan-treated rats at the lesion site in the corpus callosum, the 11C-(R)-PK11195 DVR was 1.96 ± 0.33 (n = 10) versus 1.17 ± 0.05 (n = 5) in saline-treated controls (P = 0.00012, 2-tailed t test). In subjects treated with zymosan-plus-minocycline, DVR was 1.58 ± 0.12 (n = 9), which corresponds to a 46% reduction in excess binding (P = 0.004, 2-tailed t test).
Supplementary Material
Acknowledgments
We are grateful to Elizabeth N. Houser for assistance with radiotracer production; Joseph A. Hampel, Kacey V. Kronenfeld, Jeffrey M. Moirano, and Elizabeth O. Ahlers for microPET operation, anesthesia, intravenous line placement, and radiotracer injections; Terrence R. Oakes for Spamalize assistance; and James E. Holden and Andrew D. Roberts for useful discussions. Funding was primarily provided by National Multiple Sclerosis Society grant TR3761. Additional support was provided by NIH grants S10RR015801 and P30HD003352.
References
- 1.Lehnardt S. Innate immunity and neuroinflammation in the CNS: the role of microglia in toll-like receptor-mediated neuronal injury. Glia. 2010;58:253–263. doi: 10.1002/glia.20928. [DOI] [PubMed] [Google Scholar]
- 2.Banati RB. Visualising microglial activation in vivo. Glia. 2002;40:206–217. doi: 10.1002/glia.10144. [DOI] [PubMed] [Google Scholar]
- 3.Gandhi R, Laroni A, Weiner HL. Role of the innate immune system in the pathogenesis of multiple sclerosis. J Neuroimmunol. 2010;221:7–14. doi: 10.1016/j.jneuroim.2009.10.015. [DOI] [PMC free article] [PubMed] [Google Scholar]
- 4.Drexler SK, Foxwell BM. The role of toll-like receptors in chronic inflammation. Int J Biochem Cell Biol. 2010;42:506–518. doi: 10.1016/j.biocel.2009.10.009. [DOI] [PubMed] [Google Scholar]
- 5.Fitch MT, Doller C, Combs CK, Landreth GE, Silver J. Cellular and molecular mechanisms of glial scarring and progressive cavitation: in vivo and in vitro analysis of inflammation-induced secondary injury after CNS trauma. J Neurosci. 1999;19:8182–8198. doi: 10.1523/JNEUROSCI.19-19-08182.1999. [DOI] [PMC free article] [PubMed] [Google Scholar]
- 6.Popovich PG, Guan Z, McGaughy V, Fisher L, Hickey WF, Basso DM. The neuropathological and behavioral consequences of intraspinal microglial/macrophage activation. J Neuropathol Exp Neurol. 2002;61:623–633. doi: 10.1093/jnen/61.7.623. [DOI] [PubMed] [Google Scholar]
- 7.Schonberg DL, Popovich PG, McTigue DM. Oligodendrocyte generation is differentially influenced by toll-like receptor (TLR) 2 and TLR4-mediated intraspinal macrophage activation. J Neuropathol Exp Neurol. 2007;66:1124–1135. doi: 10.1097/nen.0b013e31815c2530. [DOI] [PubMed] [Google Scholar]
- 8.Tilley BC, Alarcon GS, Heyse SP, et al. Minocycline in rheumatoid arthritis: a 48-week, double-blind, placebo-controlled trial. Ann Intern Med. 1995;122:81–89. doi: 10.7326/0003-4819-122-2-199501150-00001. [DOI] [PubMed] [Google Scholar]
- 9.Metz LM, Zhang YY, Yeung M, et al. Minocycline reduces gadolinium-enhancing magnetic resonance imaging lesions in multiple sclerosis. Ann Neurol. 2004;55:756. doi: 10.1002/ana.20111. [DOI] [PubMed] [Google Scholar]
- 10.Zabad RK, Metz LM, Todoruk TR, et al. The clinical response to minocycline in multiple sclerosis is accompanied by beneficial immune changes: a pilot study. Mult Scler. 2007;13:517–526. doi: 10.1177/1352458506070319. [DOI] [PubMed] [Google Scholar]
- 11.Zhang Y, Metz LM, Yong VW, et al. Pilot study of minocycline in relapsing-remitting multiple sclerosis. Can J Neurol Sci. 2008;35:185–191. doi: 10.1017/s0317167100008611. [DOI] [PubMed] [Google Scholar]
- 12.Metz LM, Li D, Traboulsee A, et al. Glatiramer acetate in combination with minocycline in patients with relapsing-remitting multiple sclerosis: results of a Canadian, multicenter, double-blind, placebo-controlled trial. Mult Scler. 2009;15:1183–1194. doi: 10.1177/1352458509106779. [DOI] [PubMed] [Google Scholar]
- 13.Nikodemova M, Duncan ID, Watters JJ. Minocycline exerts inhibitory effects on multiple mitogen-activated protein kinases and I kappa B alpha degradation in a stimulus-specific manner in microglia. J Neurochem. 2006;96:314–323. doi: 10.1111/j.1471-4159.2005.03520.x. [DOI] [PubMed] [Google Scholar]
- 14.Nikodemova M, Watters JJ, Jackson SJ, Yang SK, Duncan ID. Minocycline down-regulates MHC II expression in microglia and macrophages through inhibition of IRF-1 and protein kinase C (PKC)alpha/beta II. J Biol Chem. 2007;282:15208–15216. doi: 10.1074/jbc.M611907200. [DOI] [PubMed] [Google Scholar]
- 15.Banati RB, Newcombe J, Gunn RN, et al. The peripheral benzodiazepine binding site in the brain in multiple sclerosis: quantitative in vivo imaging of microglia as a measure of disease activity. Brain. 2000;123:2321–2337. doi: 10.1093/brain/123.11.2321. [DOI] [PubMed] [Google Scholar]
- 16.Cagnin A, Kassiou M, Meikle SR, Banati RB. Positron emission tomography imaging of neuroinflammation. Neurotherapeutics. 2007;4:443–452. doi: 10.1016/j.nurt.2007.04.006. [DOI] [PMC free article] [PubMed] [Google Scholar]
- 17.Doorduin J, de Vries EF, Dierckx RA, Klein HC. PET imaging of the peripheral benzodiazepine receptor: monitoring disease progression and therapy response in neurodegenerative disorders. Curr Pharm Des. 2008;14:3297–3315. doi: 10.2174/138161208786549443. [DOI] [PubMed] [Google Scholar]
- 18.Vowinckel E, Reutens D, Becher B, et al. PK11195 binding to the peripheral benzodiazepine receptor as a marker of microglia activation in multiple sclerosis and experimental autoimmune encephalomyelitis. J Neurosci Res. 1997;50:345–353. doi: 10.1002/(SICI)1097-4547(19971015)50:2<345::AID-JNR22>3.0.CO;2-5. [DOI] [PubMed] [Google Scholar]
- 19.Debruyne JC, Versijpt J, Van Laere KJ, et al. PET visualization of microglia in multiple sclerosis patients using [11C]PK11195. Eur J Neurol. 2003;10:257–264. doi: 10.1046/j.1468-1331.2003.00571.x. [DOI] [PubMed] [Google Scholar]
- 20.Versijpt J, Debruyne JC, Van Laere KJ, et al. Microglial imaging with positron emission tomography and atrophy measurements with magnetic resonance imaging in multiple sclerosis: A correlative study. Mult Scler. 2005;11:127–134. doi: 10.1191/1352458505ms1140oa. [DOI] [PubMed] [Google Scholar]
- 21.Vas A, Shchukin Y, Karrenbauer VD, et al. Functional neuroimaging in multiple sclerosis with radiolabelled glia markers: preliminary comparative PET studies with [11C]vinpocetine and [11C]PK11195 in patients. J Neurol Sci. 2008;264:9–17. doi: 10.1016/j.jns.2007.07.018. [DOI] [PubMed] [Google Scholar]
- 22.Cicchetti F, Brownell AL, Williams K, Chen YI, Livni E, Isacson O. Neuroinflammation of the nigrostriatal pathway during progressive 6-OHDA dopamine degeneration in rats monitored by immunohistochemistry and PET imaging. Eur J Neurosci. 2002;15:991–998. doi: 10.1046/j.1460-9568.2002.01938.x. [DOI] [PubMed] [Google Scholar]
- 23.Venneti S, Lopresti BJ, Wang GJ, et al. A comparison of the high-affinity peripheral benzodiazepine receptor ligands DAA1106 and (R)-PK11195 in rat models of neuroinflammation: implications for PET imaging of microglial activation. J Neurochem. 2007;102:2118–2131. doi: 10.1111/j.1471-4159.2007.04690.x. [DOI] [PubMed] [Google Scholar]
- 24.Boutin H, Chauveau F, Thominiaux C, et al. 11C-DPA-713: a novel peripheral benzodiazepine receptor PET ligand for in vivo imaging of neuroinflammation. J Nucl Med. 2007;48:573–581. doi: 10.2967/jnumed.106.036764. [DOI] [PubMed] [Google Scholar]
- 25.Rojas S, Martin A, Arranz MJ, et al. Imaging brain inflammation with [11C] PK11195 by PET and induction of the peripheral-type benzodiazepine receptor after transient focal ischemia in rats. J Cereb Blood Flow Metab. 2007;27:1975–1986. doi: 10.1038/sj.jcbfm.9600500. [DOI] [PubMed] [Google Scholar]
- 26.Popovic N, Schubart A, Goetz BD, Zhang SC, Linington C, Duncan ID. Inhibition of autoimmune encephalomyelitis by a tetracycline. Ann Neurol. 2002;51:215–223. doi: 10.1002/ana.10092. [DOI] [PubMed] [Google Scholar]
- 27.Nikodemova M, Lee J, Fabry Z, Duncan ID. Minocycline attenuates experimental autoimmune encephalomyelitis in rats by reducing T cell infiltration into the spinal cord. J Neuroimmunol. 2010;219:33–37. doi: 10.1016/j.jneuroim.2009.11.009. [DOI] [PubMed] [Google Scholar]
- 28.Engle JW, Barnhart TE, Murali D, Converse AK, Nickles RJ. Assisting the alkylation reaction in the preparation of (R)-[11C]PK11195 by solvating KOH in added water. J Labelled Comp Radiopharm. 2009;52:S281. [Google Scholar]
- 29.Tai C, Chatziioannou A, Siegel S, et al. Performance evaluation of the microPET P4: a PET system dedicated to animal imaging. Phys Med Biol. 2001;46:1845–1862. doi: 10.1088/0031-9155/46/7/308. [DOI] [PubMed] [Google Scholar]
- 30.Rubins DJ, Melega WP, Lacan G, et al. Development and evaluation of an automated atlas-based image analysis method for microPET studies of the rat brain. Neuroimage. 2003;20:2100–2118. doi: 10.1016/j.neuroimage.2003.07.011. [DOI] [PubMed] [Google Scholar]
- 31.Logan J, Fowler JS, Volkow ND, Wang GJ, Ding YS, Alexoff DL. Distribution volume ratios without blood sampling from graphical analysis of PET data. J Cereb Blood Flow Metab. 1996;16:834–840. doi: 10.1097/00004647-199609000-00008. [DOI] [PubMed] [Google Scholar]
- 32.Dodel R, Spottke A, Gerhard A, et al. Minocycline 1-year therapy in multiplesystem-atrophy: Effect on clinical symptoms and [11C] (R)-PK11195 PET (MEMSA-trial) Mov Disord. 2010;25:97–107. doi: 10.1002/mds.22732. [DOI] [PubMed] [Google Scholar]
Associated Data
This section collects any data citations, data availability statements, or supplementary materials included in this article.