

Abstract
Development of portable biosensors has broad applications in environmental monitoring, clinical diagnosis, public health, and homeland security. There is an unmet need for pathogen detection at the point-of-care (POC) using a fast, sensitive, inexpensive, and easy-to-use method that does not require complex infrastructure and well-trained technicians. For instance, detection of Human Immunodeficiency Virus (HIV-1) at acute infection stage has been challenging, since current antibody-based POC technologies are not effective due to low concentration of antibodies. In this study, we demonstrated for the first time a label-free electrical sensing method that can detect lysed viruses, i.e. viral nano-lysate, through impedance analysis, offering an alternative technology to the antibody-based methods such as dipsticks and Enzyme-linked Immunosorbent Assay (ELISA). The presented method is a broadly applicable platform technology that can potentially be adapted to detect multiple pathogens utilizing impedance spectroscopy for other infectious diseases including herpes, influenza, hepatitis, pox, malaria, and tuberculosis. The presented method offers a rapid and portable tool that can be used as a detection technology at the POC in resource-constrained settings, as well as hospital and primary care settings.
1. Introduction
Rapid, inexpensive, and early detection of infectious virus diseases is an urgent unmet need with diverse applications ranging from clinical diagnosis, public health, and homeland security. Among these applications, human immunodeficiency virus (HIV-1) diagnostics in resource-constrained settings plays a critical role to provide appropriate and timely care to patients. More than 95% of deaths due to infectious diseases such as malaria, acquired immune deficiency syndrome (AIDS), and tuberculosis (TB) have been reported to occur in developing countries.[1,2,3,4,39] A significant ratio (67%) of the 33.3 million HIV-1 infected population live in sub-Saharan Africa.[5,6] In addition, mother-to-child transmission (MTCT) remains the primary cause of AIDS in children in developing countries, with approximately 1500 children infected per day.[7] The total medicare costs for HIV/AIDS care spent in 2008 was $11.6 billion. Despite the medicare costs, there is still high worldwide mortality rate due to late diagnosis of AIDS (2.5 million deaths in 2011).[8] There are 1.2 million HIV infected people in the US, 20% of which are not aware of their HIV status.[9] Further, 72% of the HIV infected population in the US is not suppressed with antiretroviral drugs.[9] These statistics clearly highlight the urgent demand for rapid, inexpensive, and simple screening tests to identify infected individuals for HIV/AIDS treatment. However, current HIV-1 diagnostics such as lateral flow assays, including dipsticks or enzyme immunoassays (ELISA), and OraQuick HIV test kit lack the capability to detect acute HIV-1 infection even at high HIV-1 viral load.[10,11] Antibodies against HIV-1 begin to appear 3 to 8 weeks after HIV-1 infection. Detecting persons with acute HIV-1 infection is crucial since viral replication and shedding occur in this stage before detectable HIV-1 antibodies appear.[12,13] Persons with acute HIV-1 infection are unaware of their disease and therefore contribute substantially to HIV-1 transmission.[14,15] Current point-of-care (POC) HIV-1 detection methods target antibodies against HIV-1 generated after infection. Regardless of the sensitivity of these immunoassay methods, there is a period of HIV-1 infection (acute HIV-1), during which infected persons have false negative test results. At this stage, there is maximum viral replication and shedding (106-108 copies/mL).[16] Hence, nucleic acid testing (NAT) represents the state-of-the-art technologies for HIV-1 detection. Despite the sensitivity and specificity, this technology cannot be implemented at the POC due to prohibitive cost and demand for skilled operators.[5] Thus, there is an immediate need for an easy to use, portable, and inexpensive diagnostic tool for acute HIV-1 detection (seroconversion and asymptomatic stages[5]) at the POC.
In this study, we have successfully isolated, enriched, and detected viruses by a micro-electromechanical systems (MEMS) device that utilizes impedance analysis of viral nano-lysates using HIV-1 and its multiple subtypes as a model system. To the best of our knowledge, there is no accurate, inexpensive, and POC HIV-1 detection method to diagnose the disease at the early stage of HIV-1 infection (3-8 weeks).[10,11] This label-free electrical sensing method is the first demonstration of viral detection utilizing viral nano-lysate at virus concentrations that occur at the acute stage of HIV-1 infection (106-108 copies/mL)[16] in a rapid, simple, and inexpensive fashion.
2. Results
To develop a label-free electronic biosensor for pathogen detection, we investigated the impedance spectroscopy response of viral nano-lysate of multiple HIV-1 subtypes. Figure 1a schematically represents the mechanism of the sensing platform. The virus capture mechanism in the presented method was validated using fluorescent and scanning electron microscopy (SEM) imaging of green fluorescent protein (GFP) tagged HIV-1 captured by streptavidin-coated magnetic beads conjugated with anti-gp120 antibody (Figure 1b,c, and Supporting Information Figures S1,S2).
Figure 1.
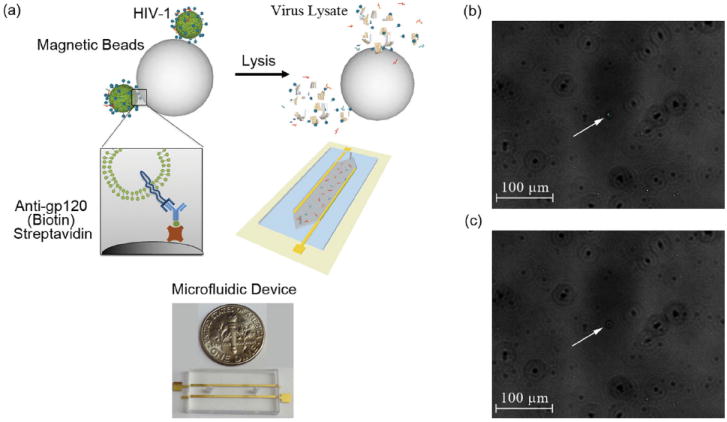
3D schematic of the electrical sensing system and fluorescent images of captured HIV-1 (a) 3D Schematic of viral capture and detection using magnetic beads conjugated with anti-gp120 antibodies (Biotin) and label-free electrical sensing of viral lysate. Streptavidin-coated magnetic beads were conjugated with anti-gp120 antibodies (Biotin). Samples were washed 4 times with 20% glycerol in grade water to remove electrically conductive DPBS. Captured viruses were then lysed using 1% Triton X-100 in grade water. The viral nano-lysate samples were used for impedance analysis by the microfluidic device with two rail electrodes. (b) Bright-field and fluorescent-field images of GFP tagged captured viruses fixed with 4% paraformaldehyde attached to magnetic beads were superimposed. White arrow points out the GFP tagged HIV-1 captured on a magnetic bead. (c) Corresponding bright-field image of the captured and fixed GFP tagged HIV-1 on the magnetic beads shown in Figure 1b. White arrow points out the corresponding magnetic bead shown in Figure 1b in bright-field.
To detect HIV-1 particles through impedance analysis of viral nano-lysate, we evaluated the washing step to achieve robust and repeatable measurements with a high signal to noise ratio. Control samples were streptavidin-coated magnetic beads suspended in Dulbecco’s phosphate buffered saline (DPBS, 1X). Samples were washed up to seven times using 20% glycerol in grade water repeating the same washing procedure, and the impedance for each sample was measured at 1000 Hz and 1 V (Figure 2). The impedance magnitude change of the samples after each washing step was maximal at 1000 Hz. Thus, this frequency, i.e. 1000 Hz, was selected as the frequency to monitor the impedance magnitude to evaluate the washing steps. The impedance magnitude (Figure 2a) and phase (Figure 2b) measured after the first three washes were statistically different from impedance magnitude measured after the 4th, 5th, 6th, and 7th wash (n = 3, p<0.05) (Figure 2). However, there was no significant difference between the impedance magnitude (Figure 2a) and phase (Figure 2b) measured after the 4th wash and those measured after 5th, 6th, and 7th washes (n = 3, p>0.05). Based on these results, 4 washes were adequate to fully remove the electrically conductive DPBS from the magnetic bead solution, eliminating a potential conductive bias. These results show that washing 4 times with an electrically low conductive solution (20% glycerol) removes electrically conductive solutions from the sample thus enabling the electrical sensing signal due to the viral lysate. It addresses a key point in the system design given that biological fluids are electrically conductive.
Figure 2.
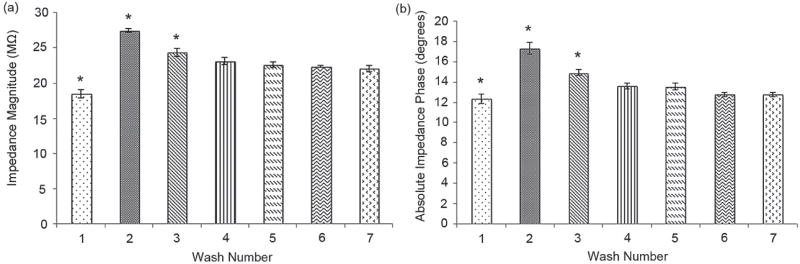
Washing step evaluation of magnetic beads to remove the electrically conductive solution (DPBS) from the samples with streptavidin-coated magnetic beads using 20% glycerol in grade water. Impedance magnitude (a) and phase (b) of the supernatant solution after each wash was measured at 1000 Hz and 1 V. “*” indicates statistically significant impedance magnitude change compared to all other groups. Statistical assessment on the results was performed using ANOVA with Tukey posthoc test for multiple comparisons. Statistical significance threshold was set at 0.05, p<0.05. Error bars represent standard error of the mean (n = 3). No significant difference between the impedance magnitude measured after the 4th wash and the impedance magnitude measured after 5th, 6th, and 7th washes was observed (n = 3, p<0.05). Based on these results, 4 washes were adequate to fully remove the electrically conductive DPBS from the magnetic bead solution, eliminating a potential conductive bias.
To evaluate the effect of antibody conjugation onto magnetic beads, the impedance magnitude and phase of samples with streptavidin-coated magnetic beads and magnetic beads conjugated with anti-gp120 antibodies in 1% Triton X-100 were measured (Figure 3). Compared to unmodified magnetic beads, the impedance magnitude of the samples with conjugated magnetic beads in 1% Triton X-100 is higher at frequencies ranging from 100 Hz to 10 000 Hz (Figure 3a). The antibodies are considered nonconductive if they are incapable of passing along electrons which occurs when the amino acid R groups for the amino acids are not charged.[44] Looking at a mouse derived antibody for HIV-1 (National Center of Biotechnology Information, ncbi.nlm.nih.gov) under acidic conditions in 1% Triton-X 100 (pH~3.7), there are only 20 ionized amino acids out of 200 per each L-chain and H-chain of the protein. Even though the antibody possesses some charged groups, these portions may not be sterically accessible making the protein a poor charge carrier. Therefore, the presence of antibodies on the beads would not be able to efficiently pass along electrons, and we observed an increase in impedance as observed in Figure 3a,b.
Figure 3.
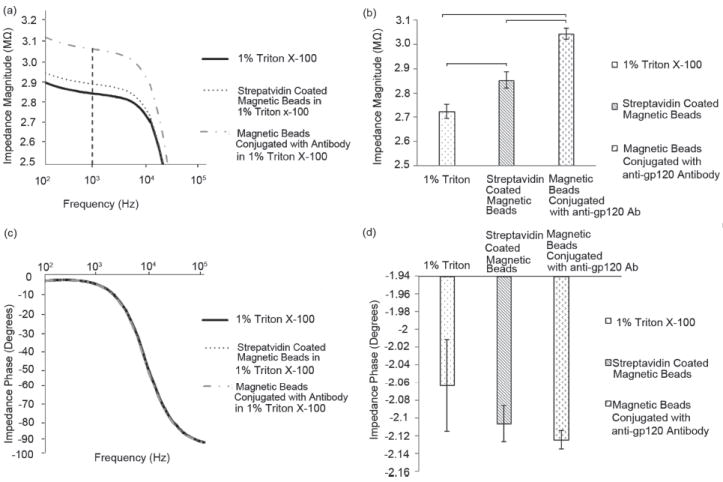
Evaluation of the impedance magnitude and phase change of streptavidin-coated magnetic beads in 1% Triton X-100 before and after anti-gp120 antibody conjugation. The impedance spectrum of the impedance magnitude (a) and phase (c) was measured and recorded over a range of frequencies from 100 Hz to 1 MHz. The impedance magnitude (b), and phase (d) of 1% Triton X-100, streptavidin-coated magnetic beads, and magnetic beads conjugated with anti-gp120 antibody in 1% Triton X-100 at 1000 Hz and 1 V were measured. Statistical significance threshold was set at 0.05. Brackets connecting individual groups indicate statistically significant peak shift (n=6). Error bars represent standard error of the mean.
The impedance magnitudes of 1% Triton X-100, magnetic beads, and conjugated beads were measured at 1000 Hz as shown in Figure 3a. This frequency falls within the steady-state range for the impedance magnitude and is utilized to calculate the maximum impedance magnitude shift. The steady-state frequency range is where the impedance magnitude change is almot negligible (100–10 000 Hz). The impedance magnitudes of 1% Triton X-100, streptavidin-coated magnetic beads in 1% Triton X-100, and magnetic beads conjugated with anti-gp120 antibody in 1% Triton X-100 were observed to be 2.72 ± 0.03 MΩ, 2.85 ± 0.03 MΩ, and 3.05 ± 0.02 MΩ, respectively (Figure 3b). Statistical analysis showed that the impedance magnitude of magnetic beads conjugated with biotinylated anti-gp120 antibodies in 1% Triton X-100 and unmodified streptavidin-coated magnetic beads in 1% Triton X-100 were significantly different compared to the impedance magnitude of 1% Triton X-100 (Figure 3b) (n = 6, p<0.05). The impedance phase of each sample (1% Triton X-100, streptavidin-coated magnetic beads, and magnetic beads conjugated with anti-gp120 antibody) was also measured at frequencies between 100 Hz and 1 MHz (Figures 3c and d). The impedance phase of the samples at 1000 Hz and 1 V is shown in Figure 3d. We observed that statistically there was no significant difference between the impedance phase of 1% Triton X-100, streptavidin-coated magnetic beads, and magnetic beads conjugated with anti-gp120 antibody in 1% Triton X-100 at 1000 Hz and 1 V (Figure 3d) (n = 6, p>0.05). We also observed that the incubation time of magnetic beads in 1% Triton X-100 does not have any significant effect on the impedance measurements (Supporting Information Figure S3).
Consistently repeatable impedance magnitude was observed for HIV-1 nano-lysate samples in 1% Triton X-100. The impedance magnitude of the lysed HIV-1 samples is lower at frequencies below 10 000 Hz (in the steady-state range) compared to the impedance magnitude of control samples (Figure 4a). The drop in magnitude occurs in the presence of viruses, indicating that this change can be utilized for detection of viruses. The impedance phase (Figure 4b) of the HIV-1 nano-lysate samples was not statistically different compared to the impedance phase of the control samples for frequencies below 1000 Hz. These magnitudes begin to differentiate just before 1000 Hz (n = 6, p>0.05). Maximum impedance magnitude shift occurs in the frequency range of 100 Hz and 10 000 Hz and the maximum impedance phase shift occurs at frequencies between 1000 Hz and 1 MHz. Therefore, all the data was collected from the range of 100 Hz to 1 MHz.
Figure 4.
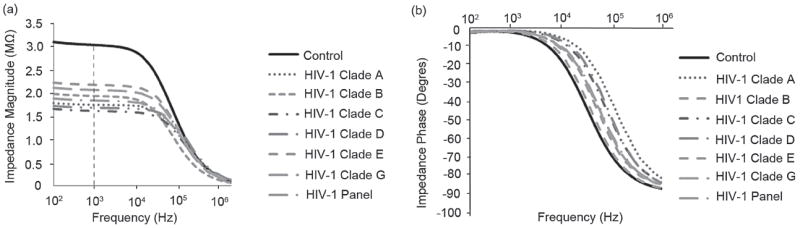
Average impedance magnitude (a) and phase (b) spectra over a range of frequencies between 100 Hz and 1MHz for HIV-1 subtypes A, B, C, D, E, G, and a panel of HIV-1 subtypes (A, B, C, D, and circulating recombinant forms, CRF01_AE and CRF02_AG). Control samples were prepared by mixing streptavidin-coated magnetic beads conjugated with anti-gp120 antibodies in DPBS without HIV-1. The test and control samples were washed with 20% glycerol (4×) and resuspended in 1% Triton X-100. The viral loads of 1.74 × 10⁸, 1.2 × 10⁸, 1.17 × 10⁸, 2.9 × 10⁸, 8.39 × 10⁸, 6.53 × 10⁸, and 1.49 × 10⁹ copies/mL were measured for subtypes A, B, C, D, E, G, and the panel, respectively.
Based on the results represented in Figure 4, impedance magnitude was selected as the detection signal and frequencies between 100 Hz and 10 000 Hz were used for detection where maximum impedance magnitude shift occurred. The impedance magnitude of the viral nano-lysate samples of HIV-1 subtypes (A, B, C, D, E, G, and panel) was measured at 1000 Hz and 1V where maximum impedance magnitude shift occurred (Figure 4a). Control samples were streptavidin-coated magnetic beads conjugated with biotinylated anti-gp120 antibodies diluted in DPBS without viruses. To measure the impedance change, the samples were washed four times with 20% glycerol as described in the method section and were resuspended in 1% Triton X-100. The impedance magnitudes of the control samples and lysed HIV-1 subtypes A, B, C, D, E, G, and panel were 3.05 ± 0.02 MΩ, 1.75 ± 0.26 MΩ, 1.8 ± 0.18 MΩ, 1.62 ± 0.21 MΩ, 1.68 ± 0.1 MΩ, 2 ± 0.22 MΩ, 1.88 ± 0.23 MΩ, 1.84 ± 0.1 MΩ at 1000 Hz and 1 V, respectively (Figure 4a).
The antibody-virus bond does not have any significant effect on the impedance spectroscopy. We did not observe impedance change in samples with streptavidin coated magnetic beads conjugated with anti-gp120 antibodies in 20% glycerol and samples with HIV-1 captured and fixed on conjugated magnetic beads in 20% glycerol (Supporting Information Figure S4).
We modeled the impedance spectrum of the device using the equivalent electronic circuit model shown in Figure 5a, and used MATLAB to determine the parameter values by minimizing the respective error between the experimental data and the proposed model. The errors were calculated by subtracting the theoretical impedance from the experimental.
Figure 5.
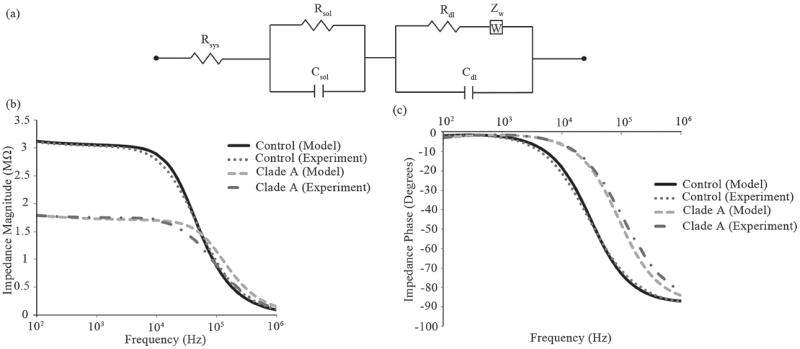
Electronic circuit model of the microfluidic device with corresponding theoretical versus experimental impedance and phase spectra. (a) The equivalent circuit used for extracting different electrical parameters in the system including the impedance magnitude of the bulk solution (Rsol of the viral lysate). Rdl, Rsol, and Rsys are the resistance of double layer, the solution (viral nano-lysate), and the external system (wires and impedance analyzer), respectively. Zw is the warburg impedance and Csol and Cdl are the capacitance of the solution and the double layer, respectively. Impedance magnitude and phase spectra fits between the experimental results and theoretical modeling for control and HIV-1 subtype A lysate are shown in Figure 5b and c, respectively.
Figure 5a shows the electronic circuit model of the microfluidic system in this work. Experimental data and the simulated impedance magnitude (Figure 5b) and phase (Figure 5c) spectrum for samples with and without viral nano-lysates (HIV-1 Subtype A, 1.74 × 10⁸ copies/mL) were presented in Figure 5b and c. The close match between the theoretical simulation and the measured results demonstrates the accuracy of the chosen model. The experimental data was compared to the simulated results using a two-tailed paired t-test. The statistical analysis showed no significant deviation from experimental and theoretical values with a threshold of 1%. The values for the electrical parameters in the microsystem for all the HIV-1 subtypes (A, B, C, D, E, G, and panel) were calculated through multiple iterations using the theoretical electronic circuit model (Table S1). These theoretical and experimental results confirm that the solution resistance (Rs) is the primary factor in the impedance shift between samples of viral lysates.
Impedance magnitude change measurements were analyzed by normalizing the impedance magnitude of the viral nano-lysate samples with respect to the impedance magnitude of the control samples (Figure 6a). Control samples were the supernatant of the streptavidin-coated magnetic beads conjugated with anti-gp120 antibodies in 1% Triton X-100. Normalized impedance magnitude shifts were measured and calculated at 1000 Hz where maximum impedance magnitude change occurred (Figure 4a). These results show that the impedance magnitude shift of the lysed HIV-1 samples was significantly different compared to the impedance magnitude of the control samples (Figure 6a) (n = 6, p<0.05). The statistical analysis also indicates that that there was no significant difference between the normalized impedance magnitude shift for different HIV-1 subtypes A, B, C, D, E, G, and panel (Figure 6a) (n = 6, p>0.05). Therefore, the system performance was independent of the HIV-1 subtypes. HIV-1 lysates of subtypes A, B, C, D, E, G, and panel samples spiked in DPBS resulted in significantly greater shift than control samples (n = 6, p<0.05) with 42.7%, 41.2%, 47%, 44.8%, 34%, 38%, and 40% of normalized impedance magnitude shift, respectively (Figure 6a). These results also showed comparable repeatability values in multiple HIV-1 subtypes. The repeatability of the presented electrical sensing technology was evaluated based upon the following repeatability parameter definition:
where I.M. is the impedance magnitude of the measured signal. The repeatability parameter was calculated and plotted for the measured impedance magnitude change of each HIV-1 subtype and control samples (Figure 6b). The repeatability parameter for the control, subtypes A, B, C, D, E, G, and panel were 94%, 81%, 86%, 86%, 89%, 84%, 81%, and 92%, respectively (Figure 6b).
Figure 6.
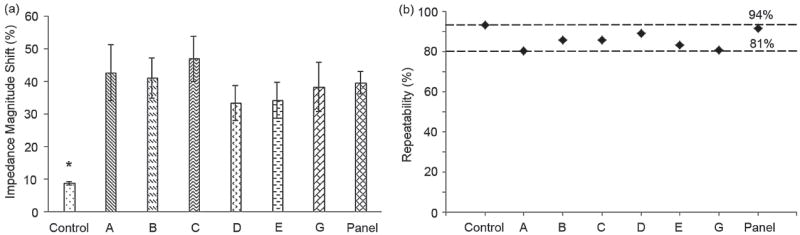
Normalized impedance magnitude shift of HIV-1 lysate and repeatability evaluation. (a) Evaluation of impedance magnitude change caused by lysed HIV-1 subtypes (subtypes A, B, C, D, E, and G) at the stock concentrations as well as a panel of HIV-1 subtypes (A, B, C, D, and circulating recombinant forms, CRF01_AE and CRF02_AG). Impedance magnitude measured at 1000Hz and 1 V. The impedance magnitude shift of samples after viral lysis was normalized with respect to the impedance magnitude of the control samples. Control samples were the supernatant of the streptavidin-coated magnetic beads conjugated with anti-gp120 antibodies (Biotin) in 1% Triton X-100. “*” indicates statistically significant impedance magnitude change compared to all other groups. Statistical assessment on the results was performed using ANOVA with Tukey posthoc test for multiple comparisons. Statistical significance threshold was set at 0.05, p<0.05. Error bars represent standard error of the mean (n = 6). (b) Repeatability of the measured impedance magnitude for HIV-1 subtypes A, B, C, D, E, and G as well as a panel of HIV-1 subtypes (A, B, C, D, and circulating recombinant forms, CRF01_AE and CRF02_AG). The viral loads of 1.74 × 10⁸, 1.2 × 10⁸, 1.17 × 10⁸, 2.9 × 10⁸, 8.39 × 10⁸, 6.53 × 10⁸, and 1.49 × 10⁹ copies/mL were measured for subtypes A, B, C, D, E, G, and the panel, respectively.
We further evaluated the specificity of the electrical sensing platform in the presence of another virus, where Epstein Barr Virus (EBV) was chosen as a model virus. Impedance magnitude and phase spectra of samples with HIV-1 subtype B, EBV, and mixture of HIV-1 and EBV were measured over a range of frequencies between 100 Hz and 1 MHz (Figure 7a,b). The impedance magnitude and phase spectra of the EBV samples did not change with respect to the control samples without viruses. However, the impedance magnitude spectra for HIV-1 as well as mixture of HIV and EBV samples were significantly below the impedance magnitude spectra of the control samples. Figure 7c shows the impedance magnitude of the samples used in Figure 7a, b at single frequency of 1000 Hz and 1 V. 1000 Hz was in the frequency range where the maximum impedance magnitude change was observed. The normalized impedance magnitude change due to viral lysate of control, HIV-1, EBV, and mixture of HIV and EBV samples were shown in Figure 7d. The impedance magnitude shift was measured at 1000 Hz frequency. The impedance magnitude shift of the EBV samples was not statistically different compared to the control samples without viruses. However, the impedance magnitude shift of HIV-1 and mixture of HIV and EBV samples were significantly higher than control samples. These results show that the electrical sensing platform can specifically detect HIV using the anti-gp120 antibody surface chemistry.
Figure 7.
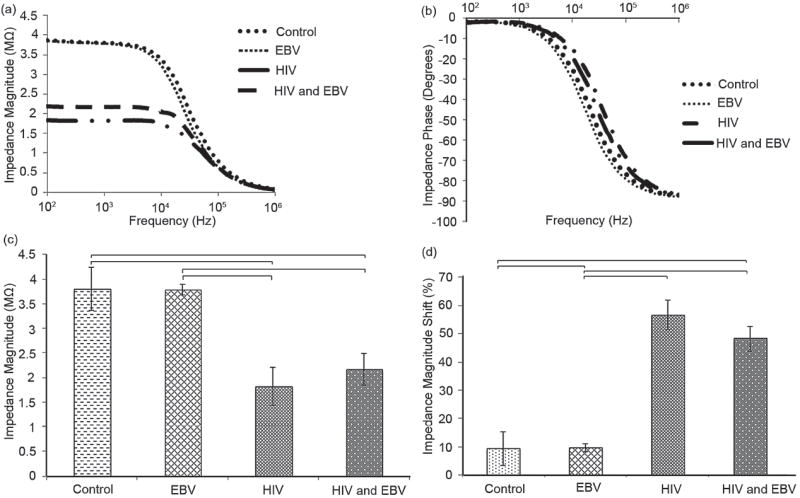
Specificity evaluation of the electrical sensing platform. Average impedance magnitude (a) and phase (b) spectra over a range of frequencies between 100 Hz and 1MHz for HIV-1 subtype B, EBV, and the mixture of HIV-1 and EBV. Control samples were prepared by mixing streptavidin-coated magnetic beads conjugated with anti-gp120 antibodies in DPBS without viruses. (c) Impedance magnitude of the samples at 1,000 Hz and 1 V. (d) Evaluation of impedance magnitude change caused by lysed HIV-1 subtype B, EBV, and mixture of HIV-1 and EBV. Impedance magnitude measured at 1,000 Hz and 1 V. The impedance magnitude shift of samples after viral lysis was normalized with respect to the impedance magnitude of the control samples. Statistical significance threshold was set at 0.05, p<0.05. The viral loads of HIV-1 subtype B and EBV were 1.2 × 10⁸ and 1.9 × 10⁸ copies/mL, respectively. The viral load of sample with mixture of HIV and EBV was 1.6 × 10⁸ copies/mL. Error bars represent standard error of the mean (n = 3). Brackets connecting individual groups indicate statistically significant impedance magnitude and impedance magnitude shift.
We were also able to improve the sensitivity of the microchip and detect samples with viral load of 106 copies/mL by increasing the sample volume of HIV up to 5 mL (Fig. S5). The impedance magnitude (Fig. S5a) and impedance magnitude shift (Fig. S5b) of HIV subtype C lysate samples were significantly different compared to control samples (n = 3, p < 0.05).
3. Discussion and Conclusion
Technical approaches for HIV-1 diagnosis in the developed world utilizing Immunoglobulin G (IgG), IgG/p24, DNA, RNA, or reverse-transcriptase activity biomarkers are time consuming and require sophisticated laboratory infrastructures, and consequently are not compatible with resource-constrained settings.[5,17] We presented a method to capture and detect viruses using impedance spectroscopy of viral nano-lysate in a microfluidic chip. Facile microfabrication of electrodes using photolithography and integration of microelectrodes into multi-array or microprocessor-controlled diagnostic tools establish electrochemical sensing and impedance measurement as a promising and powerful technology. Microfluidic-based electrical measurements on mammalian cells through Coulter counting,[18] impedance spectroscopy,[19] capacitance,[20] and dielectrophoresis (DEP)[21,40,41] have provided means of probing cellular concentration, size, membrane capacitance, cytoplasmic conductivity and permittivity.[22] The electrical data recorded by electrical sensing techniques can be used to distinguish cells without using fluorescent markers.[23] Impedance change in a biosensor can be due to binding of target molecules to receptors,[24] conductivity change of the medium by growth of cells,[25] capturing bacteria cells with DEP,[26,27] and conductivity change due to ion concentration.[28,29] There have been successful efforts to utilize electrical sensing using carbon nanotubes to detect a single virus,[30] however, current designs only detect viruses that pass by and these systems are not adaptable for the POC in resource-constrained settings. In addition, magnetic particles have been used to capture viral particles, although, separating nanoparticles with or without captured viruses is challenging for the counting step, especially for POC applications.[31]
The presented label-free electrical sensing technology provides a novel, rapid, simple, and inexpensive virus detection method that directly targets intact viruses and then detects them by viral nano-lysate impedance spectroscopy. This technology utilizes the immobilization of highly specific anti-viral antibodies on the streptavidin-coated magnetic beads for selective/specific capture and detection of nano-lysate from intact viruses. Virus lysing step releases ions and charged molecules of the virus into a non-ionic background solution, which consequently changes the impedance spectrum of the sample. This method requires multiple sample washings to remove electrical conductive media. However, the washing volume is very small (100 μL), hence, the multiple washing steps can be automated as shown in methods utilized earlier.[32]
The impedance spectroscopy results revealed that the maximum impedance magnitude shift occurred in frequencies between 100 Hz and 10 000 Hz. Thus, the bulk conductance of the sample can be evaluated in seconds by measuring the impedance magnitude of the viral nano-lysate at a single frequency (e.g. 1000 Hz) in the frequency range of 100 Hz to 1 MHz. Except for polymerase chain reaction (PCR), which is time consuming, requires expensive equipment, utilizes many reagents and must be performed by skilled technicians, there is no accurate POC HIV-1 detection method to diagnose the HIV-1 disease at acute stage.[10] This is due to very low concentration of antibodies at the acute satge, which is beyond the detection limit of the current antibody-based POC detection technologies.
The label-free electrical sensing method presented in this paper is the first demonstration of viral detection using impedance spectroscopy of viral nano-lysate in a rapid, simple, and inexpensive fashion. The high viral replication and shedding occur at the early stage of HIV-1 (106–108 copies/mL)[16] where antibody concentration is not detectable with the current POC technologies. A dynamic range of viral concentrations between 106 to 109 copies/mL was detected in our experimental results representing the ability of our platform to detect HIV-1 at clinically relevant viral concentrations that appear at the acute stage of the disease (3 to 8 weeks after infection). The electrical sensing of the nano-lysate demonstrated the capability to directly detect viral pathogens simply by impedance-based read-outs, suggesting a promising alternative to traditional PCR or optic-based assays. The total cost of the reagents (antibodies and streptavidin-coated magnetic beads) and fabrication of the MEMS device without considering the labor or commercialization scale-up costs is less than $2 which makes this label-free electrical detection method an affordable tool at the POC. Our results represent that the electrical sensing platform offers a highly selective and sensitive detection method for acute HIV-1 diagnostics.
Utilizing pathogen nano-lysate electrical fingerprint in an electronic read-out as a powerful and sensitive detection signal could potentially open exciting avenues in creating practical POC diagnostic tools for infectious diseases. We expect that these results would create a positive impact on the pathogen sensing field for use as threat agent detection or rapid infectious disease diagnosis. There are a number of steps that needs to be taken in investigating the applicability beyond viral agents to bacterial and fungal pathogens. This label-free electrical sensing method of pathogen detection using impedance spectroscopy of pathogen lysate is potentially applicable for the detection of other viral or bacterial particles in infectious diseases with well-described biomarkers including herpes, influenza, hepatitis, pox, malaria, and tuberculosis. The label-free electrical sensing technology can potentially provide tools and methods for direct multiple pathogen detection using electrical fingerprint of viral lysate. Finally, significantly enhanced sensing can be potentially attainable by decreasing the sensor size down to nanoscale.
4. Experimental Section
Reagents
HyPure Molecular Biology Grade Water was purchased from Fisher Scientific (Agawam, MA). Ethanol (200 proof) was purchased from Sigma Aldrich (Sheboygan, WI). Biotinylated polyclonal goat anti-gp120 antibody (4 mg/mL) was purchased from Abcam (Cambridge, MA). Bovin Serum Albumin (BSA, 10%), Triton X-100 (100%), and glycerol (100%) were bought from Sigma-Aldrich (St Louis, MO). Dulbecco’s Phosphate Buffered Saline (DPBS, 1X) was obtained from Life Technologies (Grand Island, NY).
Microchip Fabrication Using MEMS Fabrication Techniques
The microchip for impedance analysis was fabricated out of pyrex wafers (University Wafers, Cambridge, MA), polymethylmetacrylate (PMMA), and double sided adhesive film (DSA). The gold electrodes were patterned on the pyrex wafer. The microfluidic channels and inlet/outlet for the device were fabricated from DSA and PMMA, respectively. Pyrex wafers were first cleaned by spraying acetone (5 s) and isopropanol (1 s) on a spinner at 2000 rpm. Hexamethyldisilazane (HMDS) (MicroChem Corp., Newton, MA) was spun on the substrate at 3000 rpm for 1 minute. MicroChem Lift-Off-Resist 3A (LOR3A) was then spun onto the substrate at an initial speed of 500 rpm for 5 s and then ramped up at 1000 rpm/s to 3000 rpm. The final spin speed was maintained for 40 s and then ramped down at 1000 rpm/s. The substrate was then placed on a hot plate to bake the resist at 180 °C for 4 min. The second photoresist (Shipley 1805, S1805) was spun onto the substrate at 4000 rpm for 40 s and baked on a hot plate at 115 °C for 1 min. S1805 photoresist was exposed with UV light (50 mJ/cm2 at 405 nm). The baked photoresist was then developed using CD-26 resist developer for 75 s. The substrate with the developed photoresist was cleaned with an oxygen plasma system at 75 W RF, 20 second etching time, and 40 SCCM O2 flow rate. Ti/Au electrodes (10 nm/100 nm) were evaporated on the pyrex wafer using Denton E-beam evaporator. The photoresists were then removed using remover-PG at 80 °C. The width and spacing of the electrodes were 500 μm and 2 mm, respectively.
Using the Versa LASER Platform (Universal Laser Systems Inc., VLS2.3, Scottsdale, AZ), microchannels (11 mm × 4 mm) were cut on DSA and inlet/outlets (0.55 mm) were cut on PMMA sheets.[33,42] To cut the 3 mm PMMA, power, scan speed, pulse per inch rate, and height of the laser were set to 83 W, 6 mm/s, 500 pulses/inch, and 0.125 inches, respectively. To cut the 50 μm thick DSA, power, scan speed, pulse repulsion rate, and height of the laser were set to 10 W, 6 mm/s, 500 pulses/inch, and 0.05 inches, respectively. One of the protective layers of the DSA film was peeled off and manually attached to one side of the PMMA sheet. The other side of the DSA film was attached to the pyrex wafer with the microfabricated two rail gold electrodes (Figure 1a).
Magnetic Beads/Antibody Conjugation
1 μm diameter streptavidin-coated magnetic beads (Thermo Scientific, Rockford, IL) were first diluted in DPBS by 1:10 (v/v). The beads were washed three times with DPBS (1.5 mL) and resuspended with DPBS in a microcentrifuge tube. All washing steps were performed using a BioMag multistep magnetic separator (Polyscience Inc., Warrington, PA) to effectively remove the supernatant from the beads. Biotinylated anti-gp120 antibodies (15 μg/mL) were directly added to the magnetic beads solution and conjugation occurred on a rotator (30 rpm) at 4 °C for 2 h. After antibody conjugation, the solution was washed three times with DPBS to remove unbound antibodies.
HIV-1 Capture Utilizing Conjugated Magnetic Beads
Following the antibody conjugation, various HIV-1 subtypes (A, B, C, D, E, G, and panel) at the concentrations of 1.74 × 10⁸ (subtype A), 1.2 × 10⁸ (subtype B), 1.17 × 10⁸ (subtype C), 2.9 × 10⁸ (subtype D), 8.39 × 10⁸ (subtype E), 6.53 × 10⁸ (subtype G), and 1.48 × 10⁹ (panel) copies/mL in cultured media were mixed with the streptavidin-coated magnetic beads conjugated with anti-gp120 antibodies (Figure 1a). Previously, we have shown that anti-gp120 antibody can selectively capture HIV-1.[43] The samples were incubated at room temperature on a rotator (15 rpm) for half an hour. Control samples were prepared by adding viral-free DPBS solution into the streptavidin-coated magnetic beads conjugated with anti-gp120 antibodies.
Magnetic Beads Washing Step Evaluation
100 μL of streptavidin-coated magnetic beads (1 mg/mL) was washed three times with DPBS and resuspended in 1 mL DPBS. The beads were then washed with grade water (100 μL) seven times and the impedance magnitude and phase of the supernatant after each wash step was recorded at 1 V and 1000 Hz using the microfluidic device.
Magnetic Bead Incubation in 1% Triton X-100
Streptavidin-coated magnetic beads and magnetic beads conjugated with anti-gp120 antibodies were washed four times with 20% glycerol in grade water. The samples were then resuspended in 1% Triton X-100 and incubated for 1, 5, 10, 20, and 30 min. The supernatant of the samples were collected after each incubation time for impedance measurement.
Viral Lysis Using 1% Triton X-100
HIV-1 samples mixed with anti-gp120 antibody conjugated magnetic beads were washed four times with 20% glycerol (diluted in grade water) to remove electrically conductive media. During each washing step, samples were placed on the magnetic stand to completely remove the supernatant. 1% Triton-X 100 (diluted in grade water) was added to each sample and incubated for 5 minutes to lyse the virus and bring membrane phospholipids and proteins, capsid proteins, intracellular ions, retroviral enzymes, and nucleic acids into solution. 1% Triton-X 100 breaks down the lipid bilayer and compromises the virus capsid allowing interaction of viral RNA.[34,35]
Impedance Measurement
A small volume of viral lysate sample (10 μL) was injected into the two rail electrode microfluidic device and the impedance and phase spectrum were measured and recorded for frequencies ranging between 100 Hz and 1 MHz at 1 V (Figure 1a).
Modeling of Impedance Spectrum
The impedance spectrum measured with the microfluidic device was modeled by the equivalent electronic circuit shown in Figure 5 a, where Cs and Rs are the solution capacitance and resistance, respectively. Rsys is the internal resistance of the measuring device, Rdl is the charge transfer resistance (the resistance of electron flow between the electrode and electrolyte or double layer resistance), Cdl is the double layer capacitance (conductance formed between the electrode and electrolyte), and ZW is the Warburg impedance (accounts for diffusion of electrolytes to the electrode). The Warburg impedance is given by:[36,37]
where is the frequency, and σ is the Warburg coefficient that is determined experimentally. The chosen model is the simplest depiction that most closely fits our experimental data.
HIV-1 Virus Preparation and Quantification
HIV-1 subtypes A, B, C, D, E, G, and a panel of HIV-1 subtypes (consisting of A, B, C, D, and circulating recombinant forms, CRF01_AE and CRF02_AG) (catalogue number 11259) were obtained from NIH under AIDS Research and Reference Reagent Program and cultured in peripheral blood mononuclear cells (PBMCs). These HIV-1 subtypes were isolated from clinical samples, which were collected from the United States and Uganda. The international panel of HIV-1 virus isolates representing six major globally prevalent strains of genetically and biologically characterized HIV-1 isolates[38] consists of virus mixture of subtypes A, B, C, D, and circulating recombinant forms, CRF01_AE and CRF02_AG isolated from chronically infected individuals subtype. Virus stocks of each HIV-1 subtype were cultured using a standard co-culture protocol. PBMCs from HIV-1 negative donors were extracted by Ficoll Hypaque density gradient centrifugation (Histopaque 1077 Sigma H8889). After three-day PHA stimulation (0.25 μg/mL), donor PBMCs were co-cultured with PBMCs extracted from HIV-1 positive patients. Cultures were maintained in R20/IL-2 (100 U/mL): RPMI-1640 (Cellgro Mediatech 10-040-CV) implemented with L-glutamine (300 mg/mL), 20% heat inactivated fetal bovine serum (FBS; Gemini), penicillin (50 U/mL), streptomycin (50 μg/mL), HEPES buffer (10 mM), and recombinant human interleukin-2 (100 U/mL, Roche). The culture was incubated at 37 °C in a humidified 5% CO2 atmosphere. Culture supernatants were exchanged bi-weekly and replaced by fresh medium. Three-day PHA stimulated donor PBMCs were added once a week. Supernatants were collected and tested for 24 levels (Perkin Elmer, NEK050b). Cultures were terminated when p24 levels reached at least 20 ng/mL in cell-free supernatant. Virus supernatants were stored at −80 °C for future testing. Further, the viral load of the supernatant was measured using Roche-COBAS AmpliPrep/COBAS TaqMan HIV-1 Test, v2.0 system at the microbiology laboratory at the Brigham and Women’s Hospital. The viral loads of 1.74 × 10⁸, 1.2 × 10⁸, 1.17 × 10⁸, 2.9 × 10⁸, 8.39 × 10⁸, 6.53 × 10⁸, and 1.49 × 10⁹ copies/mL were measured for subtypes A, B, C, D, E, G, and the panel, respectively.
Specificity Validation Using Epstein-Barr Virus (EBV)
HIV-1 subtype B at viral load of 1.2 × 10⁸, and Epstein-Barr Virus (EBV, Human Herpesvirus 4, HHV-4) at viral load of 1.90 × 10⁸ copies/mL, and mixture of HIV-1 and EBV at viral load of 1.55 × 10⁸ copies/mL were mixed with the streptavidin-coated magnetic beads conjugated with anti-gp120 antibodies. EBV was chosen as a model virus to evaluate the specificity of the platform. EBV was purchased from Advanced Biotechnologies Inc. (Columbia, MD) at stock concentration of 1.9 × 10¹⁰ virus particles/mL. The samples were incubated at room temperature on a rotator (15 rpm) for half an hour. Control samples were prepared by adding viral-free DPBS solution into the streptavidin-coated magnetic beads conjugated with anti-gp120 antibodies.
Large Volume (5 mL) HIV Sample Preparation for Improving Sensitivity
Anti-gp120 conjugated magnetic beads (100 μL) were mixed with DPBS-diluted HIV-1 (subtype C, 1.17 × 10⁶ copies/mL) in cultured media to produce a high sample volume (5 mL). It is noteworthy to mention that the number of magnetic beads used to capture viruses in the large volume samples (5 mL) was the same as what was used for small samples (100 μL). The samples were incubated at room temperature on a rotator (15 rpm) for one hour, compared to half an hour incubation time for samll samples (100 μL), to ensure effective capture of virus onto the magnetic beads. Control samples were prepared by adding viral-free DPBS solution into the streptavidin-coated magnetic beads conjugated with anti-gp120 antibodies.
Statistical Analysis
The experimental results were analyzed using Analysis of Variance (ANOVA) with Tukey’s post-hoc test for multiple comparisons with statistical significance threshold set at 0.05 (n = 3 to 6, p<0.05). Statistical analyses were performed with Minitab software (V14, Minitab Inc., State College, PA, USA).
Supplementary Material
Acknowledgments
The authors would like to thank Dr. Zixin Hu at the Division of Infectious Diseases, Brigham and Women’s Hospital for his generous help on providing GFP tagged HIV-1 samples. The devices were fabricated using facilities at the Center for Nanoscale Systems (CNS), a member of the National Nanotechnology Infrastructure Network (NNIN). This work was supported by the National Institute of Health under NIH award numbers RO1AI093282, RO1AI081534, R21AI087107, 1F32AI102590 and NIH U54EB15408. This work was also supported by a research grant that was awarded and administered by the US Army Medical Research and Materiel Command and the Telemedicine and Advanced Technology Research Center (TATRC), at Fort Detrick, MD.
Footnotes
Supporting Information
Supporting Information is available from the Wiley Online Library or from the author.
Contributor Information
Hadi Shafiee, Bio-Acoustic-MEMS in Medicine (BAMM) Laboratory, Division of Biomedical Engineering, Department of Medicine, Brigham and Women’s Hospital, Harvard Medical School, Boston, MA, USA.
Muntasir Jahangir, Bio-Acoustic-MEMS in Medicine (BAMM) Laboratory, Division of Biomedical Engineering, Department of Medicine, Brigham and Women’s Hospital, Harvard Medical School, Boston, MA, USA.
Fatih Inci, Bio-Acoustic-MEMS in Medicine (BAMM) Laboratory, Division of Biomedical Engineering, Department of Medicine, Brigham and Women’s Hospital, Harvard Medical School, Boston, MA, USA.
ShuQi Wang, Bio-Acoustic-MEMS in Medicine (BAMM) Laboratory, Division of Biomedical Engineering, Department of Medicine, Brigham and Women’s Hospital, Harvard Medical School, Boston, MA, USA.
Remington B. M. Willenbrecht, Bio-Acoustic-MEMS in Medicine (BAMM) Laboratory, Division of Biomedical Engineering, Department of Medicine, Brigham and Women’s Hospital, Harvard Medical School, Boston, MA, USA
Francoise F. Giguel, Division of Infectious Diseases, Massachusetts General Hospital, Harvard Medical School, Boston, MA, USA
Athe M. N. Tsibris, Division of Infectious Diseases, Brigham and Women’s Hospital, Harvard Medical School, Boston, MA, USA
Daniel R. Kuritzkes, Division of Infectious Diseases, Brigham and Women’s Hospital, Harvard Medical School, Boston, MA, USA
Utkan Demirci, Email: udemirci@rics.bwh.harvard.edu, Bio-Acoustic-MEMS in Medicine (BAMM) Laboratory, Division of Biomedical Engineering, Department of Medicine, Brigham and Women’s Hospital, Harvard Medical School, Boston, MA, USA; Division of Biomedical Engineering, Division of Infectious Diseases, Department of Medicine, Brigham and Women’s Hospital, Harvard Medical School, Cambridge, MA, USA.
References
- 1.Yager P, Domingo GJ, Gerdes J. Annu Rev Biomed Eng. 2008;10:107. doi: 10.1146/annurev.bioeng.10.061807.160524. [DOI] [PubMed] [Google Scholar]
- 2.Urdea M, Penny LA, Olmsted SS, Giovanni MY, Kaspar P, Shepherd A, Wilson P, Dahl CA, Buchsbaum S, Moeller G, Hay Burgess DC. Nature. 2006;444(Suppl 1):73. doi: 10.1038/nature05448. [DOI] [PubMed] [Google Scholar]
- 3.Hay Burgess DC, Wasserman J, Dahl CA. Nature. 2006;444(Suppl 1):1. doi: 10.1038/nature05440. [DOI] [PubMed] [Google Scholar]
- 4.Girosi F, Olmsted SS, Keeler E, Hay Burgess DC, Lim YW, Aledort JE, Rafael ME, Ricci KA, Boer R, Hilborne L, Derose KP, Shea MV, Beighley CM, Dahl CA, Wasserman J. Nature. 2006;444(Suppl 1):3. doi: 10.1038/nature05441. [DOI] [PubMed] [Google Scholar]
- 5.Wang S, Xu F, Demirci U. Biotechnol Adv. 2010;28:770. doi: 10.1016/j.biotechadv.2010.06.004. [DOI] [PMC free article] [PubMed] [Google Scholar]
- 6. [December, 2010];UNAIDS Global Report 2010. http://www.unaids.org/globalreport/global_report.htm.
- 7. [August, 2008];UNAIDS Global Report 2008. http://data.unaids.org/pub/GlobalReport/2008/JC1510_2008GlobalReport_en.zip.
- 8. [November 2011];UNAIDS Report on the global AIDS epidemic, 2011. http://www.unaids.org/en/media/unaids/contentassets/documents/unaidspublication/2011/20111130_ua_report_en.pdf.
- 9.Cohen J. Science. 2012;337:168. doi: 10.1126/science.337.6091.168. [DOI] [PubMed] [Google Scholar]
- 10.Rosenberg NE, Kamanga G, Phiri S, Nsona D, Pettifor A, Rutstein SE, Kamwendo D, Hoffman IF, Keating M, Brown LB, Ndalama B, Fiscus SA, Congdon S, Cohen MS, Miller WC. J Infect Dis. 2012;205:528. doi: 10.1093/infdis/jir789. [DOI] [PMC free article] [PubMed] [Google Scholar]
- 11.Busch MP, Lee LL, Satten GA, Henrard DR, Farzadegan H, Nelson KE, Read S, Dodd RY, Petersen LR. Transfusion. 1995;35:91. doi: 10.1046/j.1537-2995.1995.35295125745.x. [DOI] [PubMed] [Google Scholar]
- 12.Daar ES, Moudgil T, Meyer RD, Ho DD. N Engl J Med. 1991;324:961. doi: 10.1056/NEJM199104043241405. [DOI] [PubMed] [Google Scholar]
- 13.Patel P, Klausner JD, Bacon OM, Liska S, Taylor M, Gonzalez A, Kohn RP, Wong W, Harvey S, Kerndt PR, Holmberg SD. J Acquir Immune Defic Syndr. 2006;42:75. doi: 10.1097/01.qai.0000218363.21088.ad. [DOI] [PMC free article] [PubMed] [Google Scholar]
- 14.Powers KA, Ghani AC, Miller WC, Hoffman IF, Pettifor AE, Kamanga G, Martinson FE, Cohen MS. Lancet. 2011;378:256. doi: 10.1016/S0140-6736(11)60842-8. [DOI] [PMC free article] [PubMed] [Google Scholar]
- 15.Koopman JS, Jacquez JA, Welch GW, Simon CP, Foxman B, Pollock SM, Barth-Jones D, Adams AL, Lange K. J Acquir Immune Defic Syndr Hum Retrovirol. 1997;14:249. doi: 10.1097/00042560-199703010-00009. [DOI] [PubMed] [Google Scholar]
- 16.Rouet F, Ekouevi DK, Chaix ML, Burgard M, Inwoley A, Tony TD, Danel C, Anglaret X, Leroy V, Msellati P, Dabis F, Rouzioux C. J Clin Microbiol. 2005;43:2709. doi: 10.1128/JCM.43.6.2709-2717.2005. [DOI] [PMC free article] [PubMed] [Google Scholar]
- 17.Fiscus SA, Cheng B, Crowe SM, Demeter L, Jennings C, Miller V, Respess R, Stevens W. PLoS Med. 2006;3:e417. doi: 10.1371/journal.pmed.0030417. [DOI] [PMC free article] [PubMed] [Google Scholar]
- 18.Coulter WH. Proc Natl Electron Conf. 1956;12:1034. [Google Scholar]
- 19.Fricke H, Curtis HJ. Nature. 1935;135:436. [Google Scholar]
- 20.Sohn LL, Saleh OA, Facer GR, Beavis AJ, Allan RS, Notterman DA. Proc Natl Acad Sci USA. 2000;97:10687. doi: 10.1073/pnas.200361297. [DOI] [PMC free article] [PubMed] [Google Scholar]
- 21.Morgan H, Hughes MP, Green NG. Biophys J. 1999;77:516. doi: 10.1016/S0006-3495(99)76908-0. [DOI] [PMC free article] [PubMed] [Google Scholar]
- 22.Asami K. Prog Polym Sci. 2002;27:1617. [Google Scholar]
- 23.Cheung K, Gawad S, Renaud P. Cytometry A. 2005;65:124. doi: 10.1002/cyto.a.20141. [DOI] [PubMed] [Google Scholar]
- 24.Yang L, Li Y, Erf GF. Anal Chem. 2004;76:1107. doi: 10.1021/ac0352575. [DOI] [PubMed] [Google Scholar]
- 25.Madhukar Varshney YL, Srinivasan B, Tung S. Sensor Actuat B—Chemical. 2007;128:99. [Google Scholar]
- 26.Li H, Bashir R. Sens Actuat B—Chemical. 2002;86:215. [Google Scholar]
- 27.Aldaeus F, Lin Y, Roeraade J, Amberg G. Electrophoresis. 2005;26:4252. doi: 10.1002/elps.200500068. [DOI] [PubMed] [Google Scholar]
- 28.Cheng X, Liu YS, Irimia D, Demirci U, Yang L, Zamir L, Rodriguez WR, Toner M, Bashir R. Lab Chip. 2007;7:746. doi: 10.1039/b705082h. [DOI] [PMC free article] [PubMed] [Google Scholar]
- 29.Kim SK, Hesketh PJ, Li C, Thomas JH, Halsall HB, Heineman WR. Biosens Bioelectron. 2004;20:887. doi: 10.1016/j.bios.2004.04.004. [DOI] [PubMed] [Google Scholar]
- 30.Patolsky F, Zheng G, Hayden O, Lakadamyali M, Zhuang X, Lieber CM. Proc Natl Acad Sci USA. 2004;101:14017. doi: 10.1073/pnas.0406159101. [DOI] [PMC free article] [PubMed] [Google Scholar]
- 31.Chen GD, Alberts CJ, Rodriguez W, Toner M. Anal Chem. 2010;82:723. doi: 10.1021/ac9024522. [DOI] [PMC free article] [PubMed] [Google Scholar]
- 32.Chin CD, Laksanasopin T, Cheung YK, Steinmiller D, Linder V, Parsa H, Wang J, Moore H, Rouse R, Umviligihozo G, Karita E, Mwambarangwe L, Braunstein SL, van de Wijgert J, Sahabo R, Justman JE, El-Sadr W, Sia SK. Nat Med. 2011;17:1015. doi: 10.1038/nm.2408. [DOI] [PubMed] [Google Scholar]
- 33.Moon S, Keles HO, Ozcan A, Khademhosseini A, Haeggstrom E, Kuritzkes D, Demirci U. Biosens Bioelectron. 2009;24:3208. doi: 10.1016/j.bios.2009.03.037. [DOI] [PMC free article] [PubMed] [Google Scholar]
- 34.Warrilow D, Stenzel D, Harrich D. Retrovirology. 2007;4:77. doi: 10.1186/1742-4690-4-77. [DOI] [PMC free article] [PubMed] [Google Scholar]
- 35.Warrilow D, Warren K, Harrich D. PLoS One. 2010;5:e13229. doi: 10.1371/journal.pone.0013229. [DOI] [PMC free article] [PubMed] [Google Scholar]
- 36.Varshney M, Li Y. Biosens Bioelectron. 2009;24:2951. doi: 10.1016/j.bios.2008.10.001. [DOI] [PubMed] [Google Scholar]
- 37.Chang BY, Park SM. Annu Rev Anal Chem. 2010;3:207. doi: 10.1146/annurev.anchem.012809.102211. [DOI] [PubMed] [Google Scholar]
- 38.Brown BK, Darden JM, Tovanabutra S, Oblander T, Frost J, Sanders-Buell E, de Souza MS, Birx DL, McCutchan FE, Polonis VR. J Virol. 2005;79:6089. doi: 10.1128/JVI.79.10.6089-6101.2005. [DOI] [PMC free article] [PubMed] [Google Scholar]
- 39.Wang S, Inci F, Libero GD, Singhal A, Demirci U. J Biotechadv. 2013 doi: 10.1016/j.biotechadv.2013.01.006. [DOI] [Google Scholar]
- 40.Shafiee H, Sano MB, Henslee EA, Caldwell JL, Davalos RV. Lab Chip. 2010;10:438. doi: 10.1039/b920590j. [DOI] [PubMed] [Google Scholar]
- 41.Salmanzadeh A, Romero L, Shafiee H, Gallo-Villanueva RC, Stremler MA, Cramer SD, Davalos RV. Lab Chip. 2012;12:182. doi: 10.1039/c1lc20701f. [DOI] [PubMed] [Google Scholar]
- 42.Moon S, Gurkan UA, Blander J, Fawzi WW, Aboud S, Mugusi F, Kuritzkes DR, Demirci U. PLoS One. 6:21406. doi: 10.1371/journal.pone.0021409. [DOI] [PMC free article] [PubMed] [Google Scholar]
- 43.Wang S, Esfahani M, Gurkan UA, Inci F, Kuritzkes DR, Demirci U. Lab on a Chip. 2012;12:1508. doi: 10.1039/c2lc20706k. [DOI] [PMC free article] [PubMed] [Google Scholar]
- 44.Yang L, Bashir R. Biotechnol Adv. 2008;26:135. doi: 10.1016/j.biotechadv.2007.10.003. [DOI] [PubMed] [Google Scholar]
Associated Data
This section collects any data citations, data availability statements, or supplementary materials included in this article.