Abstract
Aims/Hypothesis
Diabetic peripheral neuropathy (DN) is a common complication of diabetes; however, the mechanisms leading to positive or negative symptoms are not well understood. GLO1 is an enzyme that detoxifies reactive carbonyls that form advanced glycation endproducts (AGEs), and GLO1 may affect how sensory neurons respond to heightened AGE levels in DN. We hypothesize differential GLO1 expression levels in sensory neurons may lead to differences in AGE formation and modulate the phenotype of DN.
Methods
Inbred strains of mice were used to assess the variability of GLO1 expression by qRT-PCR. Nondiabetic C57BL/6 mice were used to characterize the expression of GLO1 in neural tissues by immunofluorescence. Behavioral assessments were conducted on nondiabetic and diabetic A/J and C57BL/6 mice to determine mechanical sensitivity and GLO1 expression was determined by Western blot.
Results
GLO1immunoreactivity is found through the central and peripheral nervous system, but selectively in small, unmyelinated peptidergic DRG neurons that are involved in pain transmission. GLO1 protein levels are present in varied levels in the DRG from different inbred mice strains. Diabetic A/J and C57BL/6 mice, two mouse strains that express divergent levels of GLO1, display dramatically different behavioral responses to mechanical stimuli. Diabetic C57BL/6 also show reduced expression of GLO1 following diabetes induction.
Conclusions/Interpretations
These findings suggest certain DRG neurons are better able to protect against hyperglycemia-induced damage, while others are more susceptible to toxic effects of reactive dicarbonyls. This may have important implications on modulation of mechanical sensitivity and lead to the development of different symptoms of neuropathy.
Keywords: Diabetic neuropathy, Glyoxalase I, Advanced glycation endproducts, Allodynia, Mechanical sensitivity, Dorsal root ganglia, Peripheral Nervous System
Introduction
Diabetic peripheral neuropathy (DN) is the most common secondary complication of longstanding hyperglycemia as a consequence of diabetes mellitus [1]. Over 50% of diabetic patients suffer from DN with the prevalence increasing with duration of diabetes [2]. The majority of diabetic patients present with insensate neuropathy, although, estimates have varied widely, suggesting 10-50% of diabetic patients have painful neuropathy [3-6]. However, a clear understanding of the underlying pathological mechanisms that determine which signs and symptoms of neuropathy, either positive or negative, arise in certain patients has yet to be determined.
One of the several mechanisms linked to neuronal dysfunction in DN is the accumulation of advanced glycation endproducts (AGEs) [7-9]. Nonenzymatic glycation modifies lipids, nucleic acids, and both intra- and extra-cellular proteins thereby altering normal cellular functions [10]. AGEs also stimulate signaling pathways activated through the receptor for advanced glycation endproducts (RAGE) that cause sensory neuron dysfunction [11, 12]. In clinical studies and diabetic rodent models, AGEs accumulate in sites affected by diabetic complications including the kidney, retina, and peripheral nerves [13]. In diabetic patients, the accumulation of AGEs in the skin precedes clinical neuropathy [14], correlates with the severity of symptoms [14], and predicts the progression of DN [15].
Recently, reactive dicarbonyls or α-oxoaldehydes such as methylglyoxal, glyoxal, and 3-deoxyglucose have been found to be important precursors of AGEs and contribute in their own right to diabetic complications [16-19]. Reactive dicarbonyls are formed as a normal byproduct of many metabolic pathways including glyolysis, protein breakdown, lipid peroxidation, and degradation of glycated proteins, all of which are enhanced in diabetes mellitus [9, 20]. α-oxoaldehydes are up to 20,000-fold more reactive than glucose leading to increased carbonyl stress and accelerated production of AGEs [21]. Importantly, α-oxoaldehydes are elevated in diabetic patients [22]. Therefore, reactive dicarbonyls are thought to have an important role in the pathogenesis of DN.
The glyoxalase enzyme system, composed of glyoxalase I (GLO1) and glyoxalase II, is a key cellular pathway that detoxifies reactive dicarbonyls and limits AGE formation. GLO1 levels and activity can be altered in disease states including diabetes [23-25]. Thus, GLO1 has been investigated in diabetic retinopathy, nephropathy, cardiomyopathy, and endothelial dysfunction [26]. However, the anatomical expression and functional role of GLO1 has not been investigated in DN. The present study was designed to investigate the expression of GLO1 in the peripheral nervous system and to better understand its potential role in modulating the development of DN.
Materials and Methods
Animals
Male C57BL/6 (Charles River, Sulzfeld, Germany), A/J, Balb/cJ, 129P3/J, C3H/HeJ, and DBA/2J mice (Jackson, Bar Harbor, Maine) were purchased at 7 weeks, one week prior to beginning experiments. The MrgD mouse line was generated by D. Anderson (California Institute of Technology) and maintained as a breeding colony at the University of Kansas Medical Center. Genotypes were confirmed as previously described [27]. The animals were housed two mice per cage in 12/12-h light/dark cycle under pathogen free conditions. Mice were given free access to standard rodent chow (Harlan Teklad 8,604, 4% kcal derived from fat) and water. All animal use was in accordance with NIH guidelines and conformed to principles specified by the University of Kansas Medical Center Animal Care and Use Protocol.
Streptozocin-induced diabetes
Diabetes was induced in 8-week-old male C57BL/6 and A/J mice. C57BL/6 mice were injected with a single intraperitoneal injection of streptozocin (STZ) (180 mg/kg body weight; Sigma, St. Louis, MO) dissolved in 10 mmol/L sodium citrate buffer, pH 4.5. A/J mice were injected with 85 mg/kg STZ followed by a second injection with 65 mg/kg STZ 24 hours later. Controls received sodium citrate buffer alone. Animals of either strain that did not develop hyperglycemia one week after the initial injection were re-injected with 85 mg/kg STZ. Food was removed from all cages for 3 h before and after STZ-injection.
Glucose measurements
Animal weight and blood glucose levels (glucose diagnostic reagants, Sigma, St. Louis, MO) were measured 1 week after STZ injection and every week thereafter. Mice were considered diabetic if their nonfasting blood glucose level, measured from tail vein sampling for intermediate measures and decapitation pool for the terminal measure, is > 12.0 mmol/L or 216 mg/dl at every measurement.
Behavioral testing
Mechanical behavioral responses to a Semmes-Weinstein von Frey monofilament (1 or 1.4 g) (Stoelting, Wood Dale, Illinois) were assessed at 4, 5, and 6 weeks after STZ injection. Mice underwent a training session on the day prior to the first day of testing. Mice were placed in individual clear plastic cages (11 × 5 × 3.5 cm) on a wire mesh screen elevated 55 cm above the table and allowed to acclimate for 30 minutes. The combined mean percent withdrawal of three applications to each hindpaw was calculated for each animal for each testing session. The group means were calculated. Mice were killed following behavioral testing at 6 weeks post-STZ.
Immunohistochemistry
Unfixed lumbar DRG, sciatic nerve, and spinal cord were dissected, frozen, sectioned in 16-20 μm cross-sectional serial sections, and mounted on Superfrost Plus slides (Fisher Scientific, Chicago, IL) then stored at −20°C. After thawing 5 min at room temperature, slide-mounted tissue was circled with a Pap Pen (Research Products International, Mt. Prospect, Illinois) to create a hydrophobic ring. Tissue sections were then covered with a blocking solution (0.5% porcine gelatin, 1.5% normal donkey serum, 0.5% Triton-X, Superblock buffer; Pierce, Rockford, IL) for 1 h at room temperature. Primary antibodies were incubated overnight at 4°C. For GLO1 immunohistochemistry, a mouse anti-glyoxalase I primary antibody (1:100; Abcam, Cambridge, MA) and a donkey anti-mouse secondary antibody (Alexa 488 or 555; 1:2000; Molecular Probes, Eugene, OR) were used to label positive cells in the L4/5/6 DRG, sciatic nerve, and spinal cord. Primary rabbit anti-neurofilament H (1:2500; Chemicon, Billerica, MA) or rabbit anti-peripherin (1:1000; Chemicon, Billerica, MA) with donkey anti-rabbit secondary antibody (Alexa 555; 1:2000; Molecular Probes, Eugene, OR) were used to label and counterstain cell populations in lumbar DRG. Sections were washed 2 × 5 min with PBST followed by incubation for 1 h with fluorochrome-conjugated secondary antibody diluted in PBST and Superblock (Pierce, Rockford, IL). Following three washes with PBS, slides were coverslipped and stored at 4°C until viewing.
Quantitative Real-Time PCR
Total RNA was isolated from sciatic nerve, DRG, and brain using Trizol reagent (Ambion, Austin, TX) and RNeasy Mini Kit (Qiagen, Valencia, CA). The concentration and purity were determined using a 2100 Bioanalyzer (Agilent Technologies, Santa Clara, CA). Total RNA (0.63 μg) was synthesized directly into cDNA using the iScript cDNA Synthesis Kit (Bio-Rad, Hercules, CA). qRT-PCR was performed using iScript One-Step RT-PCR Kit with SYBR green (Bio-Rad, Hercules, Ca). The primers were as follows: GAPDH: Forward: 5′-AGGTCGGTGTGAACGGATTTG-3′, Reverse: 5′-TGTAGACCATGTAGTTGAGGTCA-3′ GLO1: Forward: 5′-GATTTGGTCACATTGGGATTGC-3′, Reverse: 5′-TTCTTTCATTTTCCCGTCATCAG All reactions were performed in triplicate. The mRNA levels for GLO1 were normalized to GAPDH.
Western blot:
DRG were rapidly isolated and excised, immediately frozen in liquid nitrogen, and stored at −80°C. DRG were homogenized for 2 min in 100 μL Cell Extraction Buffer (Invitrogen, Carlsbad, CA) with protease inhibitor cocktail (Sigma, St. Louis, MO), 200 mM NaF, and 200 mM Na3VO4. The homogenates were incubated on ice for 30 mins before centrifugation at 7000 rpm for 10 mins at 4°C. Protein concentrations were determined using the Bio-Rad protein assay based on the Bradford assay (Bio-Rad, Sydney, NSW, Australia).
Samples containing 100 μg of protein were separated by electrophoresis through 4-20% SDS-PAGE gels (125 V, 1.5 h, 4°C) and transferred onto nitrocellulose paper (35 mA, overnight, 4°C). Nitrocellulose membranes were blocked with blocking buffer (3% non-fat milk and 0.05% Tween-20 in phosphate buffered saline) for 1 hour at room temperature to block non-specific binding sites. This was followed by overnight incubation with a goat anti-GLO1 primary antibody (R&D Systems, Minneapolis, MN) diluted 1:5000 in blocking buffer at 4°C. The donkey anti-goat IgG-HRP secondary antibody (Santa Cruz, Santa Cruz, CA) was used diluted 1:2500 in blocking buffer at RT for 1 hour.
Nitrocellulose membranes were stripped using Restore Plus Western Blot Stripping Buffer (Pierce, Rockford, IL). This was followed by 1-hour incubation with actin primary antibody (Millipore, Billerica, MA) diluted 1:100,000 in blocking buffer at RT. The donkey anti-mouse IgG-HRP secondary antibody (Santa Cruz, Santa Cruz, CA) was used diluted 1:2500 in blocking buffer at RT for 1 hour. The chemiluminescent signal was acquired using Supersignal West Femto Maximum Sensitivity Substrate (Pierce, Rockford, IL) and a CCD camera (BioSpectrum Imaging System, UVP, Upland, CA). NIH ImageJ software was used to measure and quantify densitometry readings.
Statistical Analysis
Data are expressed as mean ± SEM. n is the number of animals per given experimental setting. Differences were analyzed by two-tailed Student’s t test for unpaired data and repeated measures ANOVA, as appropriate. Significance was defined as p ≤ 0.05.
Results
Genetic Differences in GLOI mRNA Expression
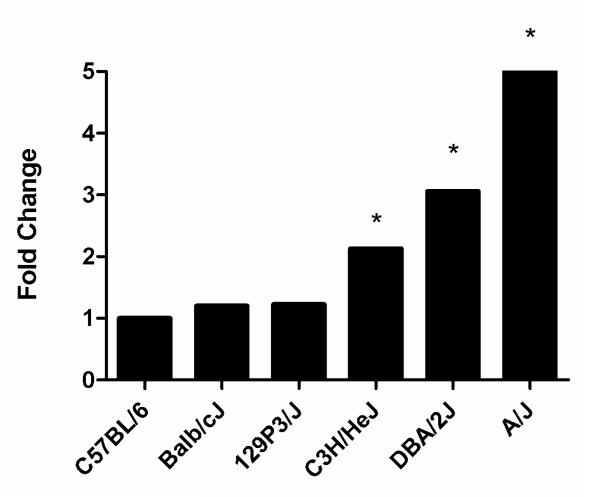
Quantitative analysis of GLO1 expression in the DRG revealed variable mRNA expression in 6 different strains of inbred mice. C57BL/6, Balb/cJ, and 129P3/J showed lowest levels of mRNA expression, while C3H/HeJ and DBA/2J had intermediate GLO1 mRNA expression (Figure 1). A/J mice showed the highest levels of mRNA expression of the strains examined with a five-fold increase over C57BL/6 (Figure 1). These results were also similar in the brain and sciatic nerve of A/J mice with 6.7- and 4.2-fold higher levels of GLO1 mRNA compared to C57BL/6 mice (data not shown).
Figure 1.
Comparison of GLO1 mRNA expression in the DRG from inbred strains of nondiabetic mice (n = 3 for each strain). Levels are normalized to GAPDH mRNA and expressed relative to C57BL/6 mice. * p < 0.05 compared to C57BL/6.
Characterization of GLO1 Expression in the Nervous System
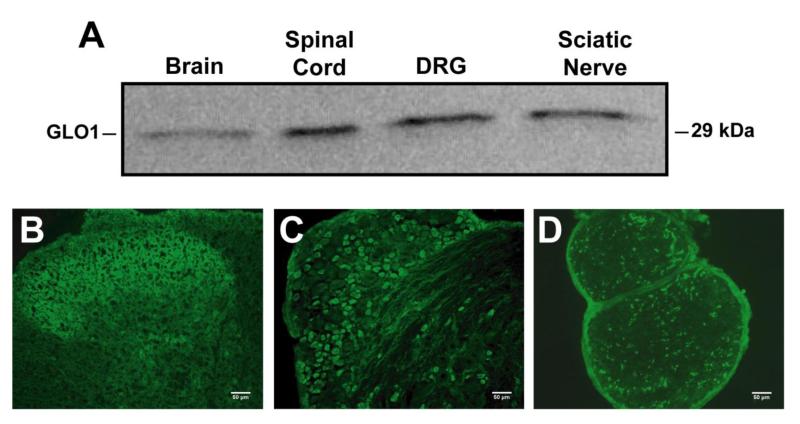
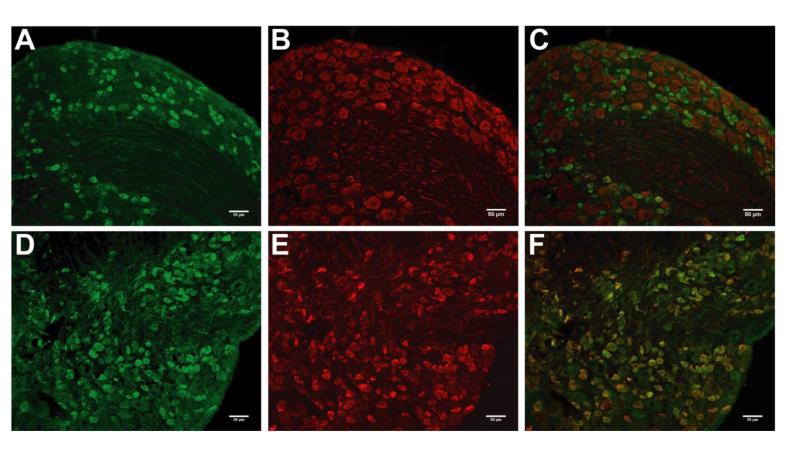
GLO1-immunoreactivity was detected throughout the nervous system including both the central and peripheral nervous systems (Figure 2A). In the lumbar spinal cord of 8-week old nondiabetic C57BL/6 mice, GLO1 localized to lamina I and outer portions of lamina II of the dorsal horn (Figure 2B), ependymal cells of the central canal (data not shown), interneurons (Figure 2B), and ventral horn motor neurons (data not shown). In the peripheral nervous system, approximately 36% of L4/L5/L6 DRG neurons (n = 1984 out of 5501) expressed GLO1 at very high levels and these neurons were predominately small in diameter (Figure 2C). Consistent with these findings, ~96% of GLO1+ neurons expressed peripherin (n = 2115 out of 2198) (Figure 3D-F), a marker of small diameter, unmyelinated neurons. Accordingly, less than 7% of GLO1+ cells (n = 138 out of 1994) expressed heavy chain neurofilament H that labels medium and large diameter, myelinated neurons (Figure 3A-C). Correspondingly, GLO1 was expressed in small diameter axons in the sciatic nerve (Figure 2D).
Figure 2.
GLO1 expression in the nervous system. (A) Representative Western blot showing expression of GLO1 in the brain, lumbar spinal cord, DRG, and sciatic nerve of nondiabetic C57BL/6 mice (n = 3). Immunofluorescence staining of the dorsal horn of the lumbar spinal cord (B), lumbar DRG (C), and sciatic nerve (D) showing GLO1 expression and localization. Scale bar, 50μm.
Figure 3.
GLO1 expression in lumbar DRG sensory neurons. Immunofluorescence staining for GLO1 (A and D) with counterstaining for neurofilament H (B) and peripherin (E). Merged images (C and F) show GLO1is localized to small neurons in the DRG (n =3). Scale bar; 50μm.
MrgD mice have previously been reported to express EGFPf from the Mas-related G protein-coupled receptor D locus which is expressed exclusively in nonpeptidergic DRG neurons innervating the epidermis [28]. Because GLO1+ neurons were predominately small, unmyelinated neurons, MrgD mice were utilized to determine whether GLO1 was expressed by peptidergic or nonpeptidergic sensory neurons. Only 8% of MrgD-GFP+ neurons (n = 93 out of 1072) expressed GLO1, suggesting GLO1 is predominately expressed by peptidergic sensory neurons in the L4/L5/L6 DRG (Figure 4).
Figure 4.
GLO1 expression in peptidergic C-fiber sensory neurons in the DRG. Immunofluroscence staining for GLO1 (A) in the lumbar DRG of MrgD mice that express GFP from the MrgD locus in nonpeptidergic neurons (B) (n = 3). Merged image (C) shows GLO1 expression primarily in peptidergic C-fibers. Scale bar; 50μm.
STZ Induced Diabetes
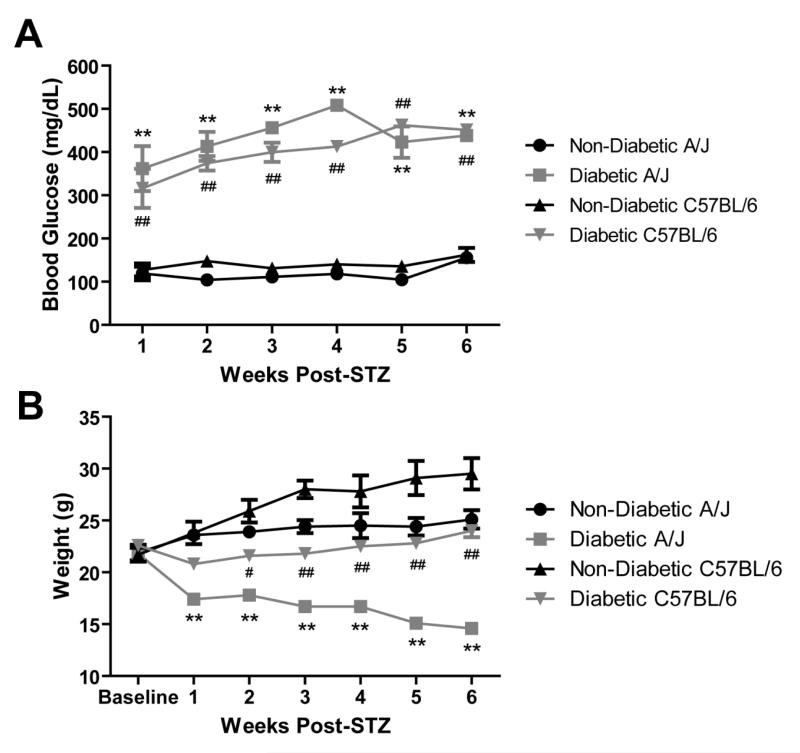
Following STZ injection, C57BL/6 and A/J mice developed significantly higher blood glucose that persisted throughout the course of the 6-week study (Figure 5A). Both strains showed similar blood glucose levels after diabetes induction, except for week 4 post-STZ when diabetic A/J mice exhibited elevated blood glucose compared to diabetic C57BL/6 mice (Figure 5A). Diabetic A/J mice had significantly lower body weights than nondiabetic mice. Nondiabetic A/J mice gained 2.1 ± 0.7 g on average, while diabetic A/J mice lost 4.6 ± 0.5 g on average (Figure 5B). Diabetic C57BL/6 also had significantly lower body weights compared to nondiabetic C57BL/6 mice and failed to gain weight over the course of the study (Figure 5B). Both diabetic C57BL/6 and A/J mice also displayed other characteristic symptoms of type I diabetes, including polydipsia and polyuria.
Figure 5.
Blood glucose (A) and weights of C57BL/6 (B) (n = 5 nondiabetic, 9 diabetic) and A/J (n = 5 nondiabetic, 9 diabetic) mice. Blood glucose is expressed in mg/dL and weight is expressed in grams. Data represents means ± standard error of the mean. # p < 0.05 vs. C57BL/6 nondiabetic. ## p < 0.001 vs. C57BL/6 nondiabetic. ** p < 0.001 vs. A/J nondiabetic.
Behavioral Sensitivity to Mechanical Stimuli
Assessment of baseline behavioral responses to a 1.4 g Von Frey mechanical stimulus revealed that C57BL/6 and A/J mice displayed different mechanical sensitivity. A/J mice displayed a higher average percent withdrawal following 6 applications of Von Frey monofilaments and, therefore, were more sensitive to force applied to the hind paw than C57BL/6 (data not shown). Consequently, a smaller filament, 1.0 g, was chosen to test the mechanical sensitivity of A/J mice in order to detect behavioral changes following diabetes induction.
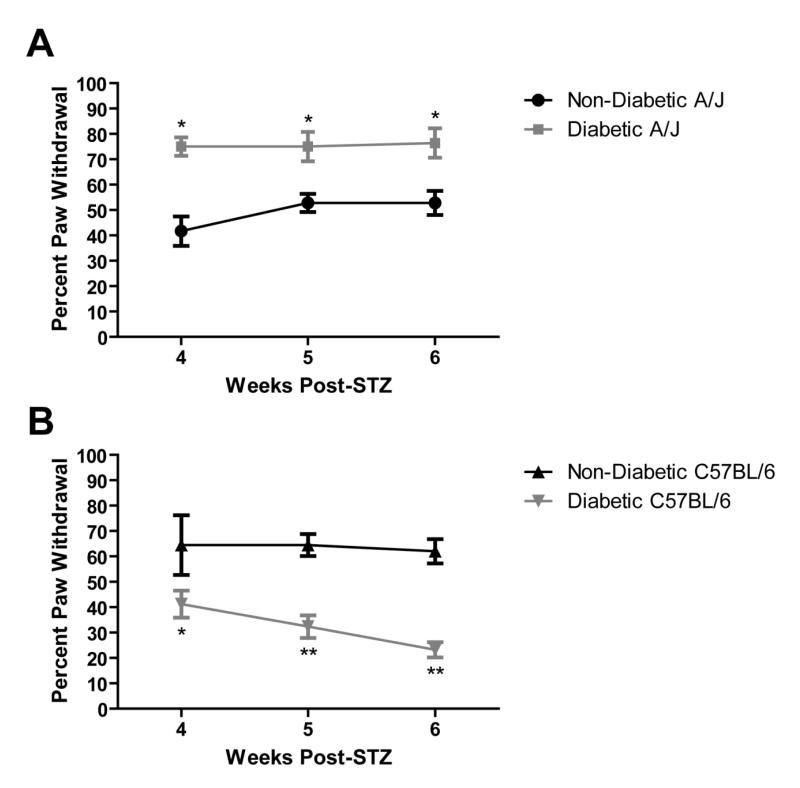
Mechanical sensitivity of the hind paw was tested at 4, 5, and 6 weeks after STZ injection. Consistent with this strain and model, diabetic C57BL/6 mice showed reduced responses to a 1.4-g von Frey monofilament (Figure 6B). After four weeks of diabetes, diabetic C57BL/6 mice displayed a withdrawal response to mechanical stimulation an average of 41.2% ± 5.32, while nondiabetic mice responded 64.4% ± 11.7 of the time. This mechanical insensitivity persisted and worsened with progression of the disease with diabetic mice withdrawing 23.2% ± 2.97 at 6 weeks post-STZ (Figure 6B; 4- vs. 6-week post-STZ).
Figure 6.
Behavioral responses of mice to mechanical stimulation of the hind paw. The percent paw withdrawal is the percentage of responses following six repeated applications of von Frey monofilaments, either 1.0 g or 1.4 g, to the hindpaws of A/J (A, n = 4 nondiabetic, 4 diabetic) and C57BL/6 (B, n = 7 nondiabetic, 34 diabetic) mice. Data represents means ± standard error of the mean. * p < 0.05 vs. nondiabetic. ** p < 0.01 vs. nondiabetic.
Conversely, as early as 1 week following STZ injection, diabetic A/J mice display increased responses to a 1-g von Frey monofilament (data not shown). Mechanical allodynia was present at 4, 5, and 6 weeks following STZ injection with diabetic A/J mice responding nearly 75% of the time (Figure 6A). Thus, diabetic C57BL/6 mice develop increased mechanical thresholds and severe mechanical insensitivity, whereas diabetic A/J mice developed reduced mechanical thresholds and mechanical allodynia after 4 weeks of diabetes.
GLO1 Expression in Diabetes
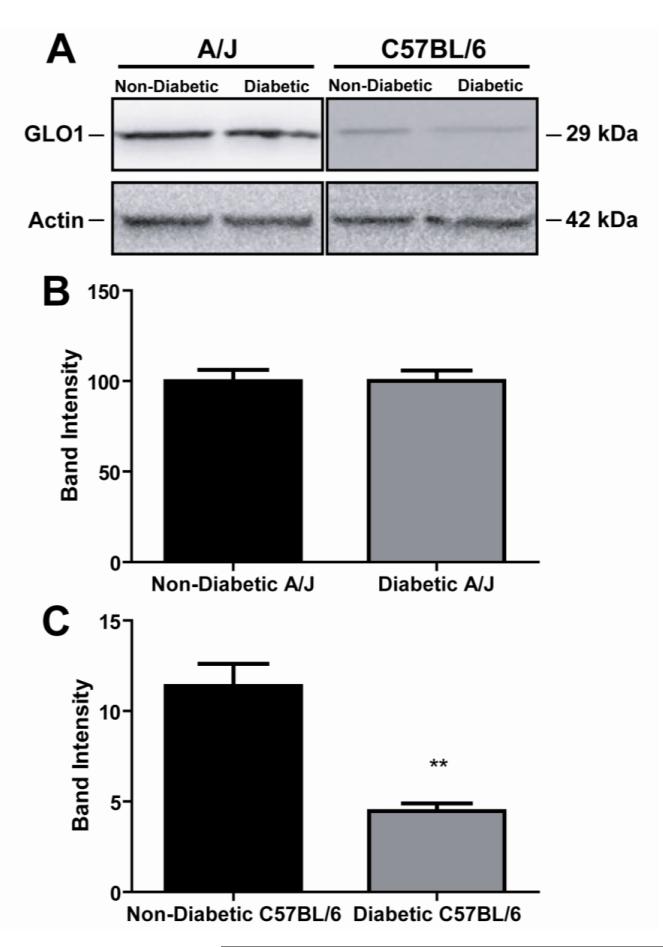
After 6 weeks of diabetes, GLO1 protein levels in the DRG of diabetic A/J mice remained similar to nondiabetic mice (Figure 7A and 7B). In contrast, diabetic C57BL/6 mice showed a 59.6% reduction in GLO1 expression in the lumbar DRG (Figure 7A and 7C). There was no difference in GLO1 mRNA levels of diabetic C57BL/6 mice compared to the nondiabetic counterparts (data not shown), suggesting differences in GLO1 regulation may occur at the protein level.
Figure 7.
Effect of diabetes on levels of GLO1 in the DRG of A/J and C57BL/6 mice. (A) Representative western blots from nondiabetic and diabetic A/J (left) and C57BL/6 (right) mice are shown for GLO1 and actin. Quantification of protein band intensities for A/J mice (B, n = 3 nondiabetic, 3 diabetic) and C57BL/6 mice (C, n = 3 nondiabetic, 3 diabetic). Band intensities are shown as normalized means ± standard error of the mean. **p < 0.01 compared to nondiabetic.
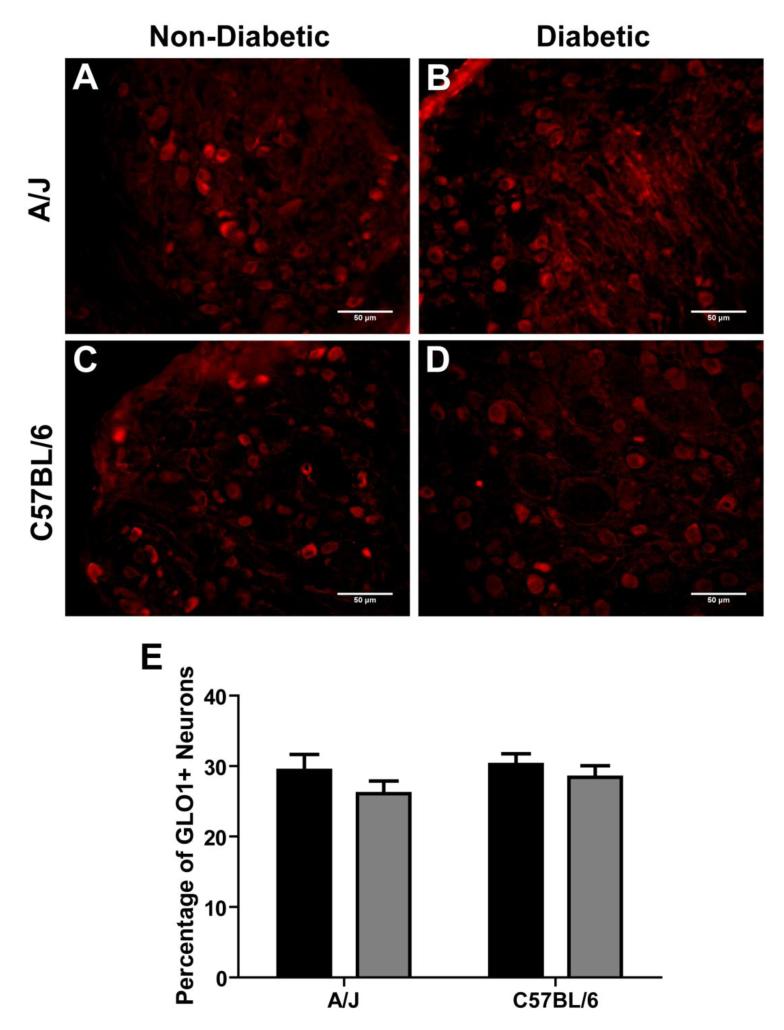
Importantly, the pattern of GLO1 expression in the DRG did not change following diabetes induction. Small-diameter neurons predominately expressed GLO1 in both nondiabetic and diabetic mice (Figure 8A-D). The percentage of GLO1+ neurons from both diabetic strains was similar to their nondiabetic counterparts, 30 ± 2% for nondiabetic C57BL/6 (n = 663 out of 2194) vs. 28 ± 2% for diabetic C57BL/6 (n = 756 out of 2660) and 29 ± 2% for nondiabetic A/J (n = 597out of 2032) vs. 26 ± 1% for diabetic A/J (n = 468 out of 1795) (Figure 8E). Similarly, the number of GLO + neurons from both diabetic C57BL/5 and A/J mice was comparable (Figure 8E).
Figure 8.
The pattern of GLO1 expression in the DRG following 6 weeks of diabetes. Immunofluorescence staining for GLO1 in the DRG of A/J nondiabetic (A, n = 3) and diabetic (B, n = 3) and C57BL/6 nondiabetic (C, n = 3) and diabetic (D, n = 3) mice. Scale bars; 50μm. (E) Quantification of the percentage of GLO positive neurons of total neurons in the DRG. Nondiabetic (black bars) and diabetic (grey bars). Data represents means ± standard error of the mean.
Discussion
Chronic hyperglycemia is the main driving force of the development and progression of diabetic complications, including DN. Elevated intra- and extra-cellular glucose concentrations lead to accelerated production of AGEs. AGEs alter the function of many proteins including tubulin, mitochondrial electron transport chain proteins, insulin, and neuronal extracellular matrix proteins [10, 29-33]. Several studies have shown that AGEs are elevated in peripheral nerves and skin of both diabetic patients and rodents [13, 14, 34, 35]. Elevated levels have also been measured in plasma of type I diabetic patients without complications, suggesting AGEs may have a role in the development and/or progression of diabetic neuropathy [36]. GLO1, a key enzyme in anti-glycation defense, is critical to preventing this accumulation of AGEs and limiting their toxic effects by breaking down the highly reactive precursors, α-oxoaldehydes.
In this study, GLO1 mRNA expression was shown to be highly variable in the DRG from multiple inbred strains of mice. A previous study using Affymetrix exon arrays also reported high genetic variability of GLO1 in the amygdala of a large panel of inbred strains of mice [37]. Williams et al. discovered the genomic region encoding GLO1 exists as copy number variant (CNV) in mice with certain strains undergoing duplications and others having lost the duplicated region, which could explain expression differences in the DRG [37]. Interestingly, CNVs have recently been characterized in humans as a substantial source of genetic diversity and disease [38, 39]. Though a CNV encompassing GLO1 has yet to be described in humans, many intronic and exonic SNPs and SNPs located in regulatory 3′ and 5′ UTR regions have been described [40]. This suggests that underlying genetic differences, alterations in regulation, or modifications in disease, particularly in diabetes, may influence the expression and activity of GLO1 [10, 41]. To date, little investigation has occurred attempting to define these in humans.
The present study is the first to characterize the expression of GLO1 in the peripheral nervous system and to associate it with symptoms of DN. Our results reveal the expression of GLO1 is restricted to small, unmyelinated peptidergic neurons in the DRG, which are primarily responsible for transmission of noxious or painful sensory information. This was particularly interesting given the critical function, highly conserved nature, and previous reports of the ubiquitous expression of GLO1 [42]. Generally, this suggests populations of neurons may be vulnerable to different types of damage in diabetes. Specifically, nonpeptidergic C-fibers and myelinated neurons may experience increased carbonyl stress and accumulation of AGEs leading to altered neuronal function. On the other hand, peptidergic neurons may be more protected from the toxic effects of elevated glucose and reactive dicarbonyls due to the expression of GLO1. This may have significant consequences on the phenotype of altered sensation in DN.
In this study, diabetic mice expressing different levels of GLO1 showed variable responses to mechanical stimuli. A/J mice that express higher levels of GLO1 than C57BL/6 mice develop mechanical allodynia with reduced response thresholds, while C57BL/6 mice develop hypoalgesia with elevated response thresholds. Furthermore, GLO1 levels are reduced after 6 weeks of diabetes in C57BL/6 mice, which may drive the pathology and subsequently exacerbate the signs and symptoms of DN. Both in vivo and in vitro overexpression of GLO1 has been shown to dramatically reduce the levels of reactive dicarbonyls and AGEs [43-45]. However, it remains to be seen if physiological overexpression, particularly in A/J mice, is robust enough to produce similar reductions. Given the restricted expression pattern of GLO1 in the DRG and behavioral differences following induction of diabetes, our findings suggest that genetic variability in GLO1 could help explain the wide spectrum of signs and symptoms observed in DN.
Mechanical sensitivity is mediated by unmyelinated and myelinated sensory neurons that respond to and transmit information about unique sensory modalities [46]; however, this discrete information converges in the spinal cord to convey complex mechano-sensory information. Thus, a balance exists between fiber types to convey appropriate sensory information from the periphery. The ability of specific neuronal populations to be more susceptible to and/or protect against hyperglycemia-induced damage, which occurs in diabetes, may alter this balance leading to abnormal peripheral nociceptive input and produce different signs and symptoms of neuropathy.
Previous studies have also suggested a link between mechanical and thermal sensation, GLO1, and AGEs. Both Bierhaus et al. and Toth et al. showed RAGE has a role in sensory neuron dysfunction in diabetes [11, 47]. Diabetic RAGE−/− mice were protected from pathological, physiological, and behavior signs of DN [8, 11, 47]. Restless leg syndrome (RLS) shares many characteristics with painful DN and may be the result of abnormalities in the peripheral nervous system [48, 49]. A large genome-wide association study of RLS patients with periodic limb movements found a common variant marker on chromosome 6 in the region of GLO1 suggesting GLO1 may affect the risk for this painful condition [50]. Thus, evidence is accumulating regarding GLO1’s role in mechanical sensitivity.
In conclusion, we have shown GLO1 is predominately expressed in peptidergic sensory neurons in the DRG and variably expressed in two mouse models of DN that display different responses to mechanical stimuli, suggesting each develops different attributes of neuropathy. These findings warrant further investigation into the role of GLO1 in DN.
Acknowledgments
This work was supported by the Juvenile Diabetes Research Foundation and NIH RO1NS43314 to D.E.W, and by the Kansas IDDRC, P30 NICHD HD 002528.
Abbreviations
- AGEs
Advanced glycation end-products
- DN
Diabetic peripheral neuropathy
- GLO
Glyoxalase I
- RAGE
Receptor for advanced glycation endproducts
- STZ
Streptozocin
Footnotes
Duality of Interest
The authors declare that there is no duality of interested associated with this manuscript.
References
- [1].Figueroa-Romero C, Sadidi M, Feldman EL. Mechanisms of disease: the oxidative stress theory of diabetic neuropathy. Rev Endocr Metab Disord. 2008;9:301–314. doi: 10.1007/s11154-008-9104-2. [DOI] [PMC free article] [PubMed] [Google Scholar]
- [2].Zochodne DW, Ramji N, Toth C. Neuronal targeting in diabetes mellitus: a story of sensory neurons and motor neurons. Neuroscientist. 2008;14:311–318. doi: 10.1177/1073858408316175. [DOI] [PubMed] [Google Scholar]
- [3].Veves A, Backonja M, Malik RA. Painful diabetic neuropathy: epidemiology, natural history, early diagnosis, and treatment options. Pain Med. 2008;9:660–674. doi: 10.1111/j.1526-4637.2007.00347.x. [DOI] [PubMed] [Google Scholar]
- [4].Tavakoli M, Malik RA. Management of painful diabetic neuropathy. Expert Opin Pharmacother. 2008;9:2969–2978. doi: 10.1517/14656560802498149. [DOI] [PubMed] [Google Scholar]
- [5].Calcutt NA, Backonja MM. Pathogenesis of pain in peripheral diabetic neuropathy. Curr Diab Rep. 2007;7:429–434. doi: 10.1007/s11892-007-0072-9. [DOI] [PubMed] [Google Scholar]
- [6].Calcutt NA. Potential mechanisms of neuropathic pain in diabetes. Int Rev Neurobiol. 2002;50:205–228. doi: 10.1016/s0074-7742(02)50078-7. [DOI] [PubMed] [Google Scholar]
- [7].Zochodne DW. Diabetic polyneuropathy: an update. Curr Opin Neurol. 2008;21:527–533. doi: 10.1097/WCO.0b013e32830b84cb. [DOI] [PubMed] [Google Scholar]
- [8].Toth C, Martinez J, Zochodne DW. RAGE, diabetes, and the nervous system. Curr Mol Med. 2007;7:766–776. doi: 10.2174/156652407783220705. [DOI] [PubMed] [Google Scholar]
- [9].Ahmed N, Thornalley PJ. Advanced glycation endproducts: what is their relevance to diabetic complications? Diabetes Obes Metab. 2007;9:233–245. doi: 10.1111/j.1463-1326.2006.00595.x. [DOI] [PubMed] [Google Scholar]
- [10].Thornalley PJ. Protein and nucleotide damage by glyoxal and methylglyoxal in physiological systems--role in ageing and disease. Drug Metabol Drug Interact. 2008;23:125–150. doi: 10.1515/dmdi.2008.23.1-2.125. [DOI] [PMC free article] [PubMed] [Google Scholar]
- [11].Toth C, Rong LL, Yang C, et al. Receptor for advanced glycation endproducts (RAGEs) and experimental diabetic neuropathy. Diabetes. 2008;57:1002–1017. doi: 10.2337/db07-0339. [DOI] [PubMed] [Google Scholar]
- [12].Vincent AM, Perrone L, Sullivan KA, et al. Receptor for advanced glycation endproducts activation injures primary sensory neurons via oxidative stress. Endocrinology. 2007;148:548–558. doi: 10.1210/en.2006-0073. [DOI] [PubMed] [Google Scholar]
- [13].Karachalias N, Babaei-Jadidi R, Ahmed N, Thornalley PJ. Accumulation of fructosyl-lysine and advanced glycation end products in the kidney, retina and peripheral nerve of streptozotocin-induced diabetic rats. Biochem Soc Trans. 2003;31:1423–1425. doi: 10.1042/bst0311423. [DOI] [PubMed] [Google Scholar]
- [14].Meerwaldt R, Links TP, Graaff R, et al. Increased accumulation of skin advanced glycation endproducts precedes and correlates with clinical manifestation of diabetic neuropathy. Diabetologia. 2005;48:1637–1644. doi: 10.1007/s00125-005-1828-x. [DOI] [PubMed] [Google Scholar]
- [15].Genuth S, Sun W, Cleary P, et al. Glycation and carboxymethyllysine levels in skin collagen predict the risk of future 10-year progression of diabetic retinopathy and nephropathy in the diabetes control and complications trial and epidemiology of diabetes interventions and complications participants with type 1 diabetes. Diabetes. 2005;54:3103–3111. doi: 10.2337/diabetes.54.11.3103. [DOI] [PMC free article] [PubMed] [Google Scholar]
- [16].Bento CF, Marques F, Fernandes R, Pereira P. Methylglyoxal alters the function and stability of critical components of the protein quality control. PLoS One. 5:e13007. doi: 10.1371/journal.pone.0013007. [DOI] [PMC free article] [PubMed] [Google Scholar]
- [17].Morgan PE, Dean RT, Davies MJ. Inactivation of cellular enzymes by carbonyls and protein-bound glycation/glycoxidation products. Arch Biochem Biophys. 2002;403:259–269. doi: 10.1016/s0003-9861(02)00222-9. [DOI] [PubMed] [Google Scholar]
- [18].de Arriba SG, Stuchbury G, Yarin J, Burnell J, Loske C, Munch G. Methylglyoxal impairs glucose metabolism and leads to energy depletion in neuronal cells--protection by carbonyl scavengers. Neurobiol Aging. 2007;28:1044–1050. doi: 10.1016/j.neurobiolaging.2006.05.007. [DOI] [PubMed] [Google Scholar]
- [19].Ulrich P, Cerami A. Protein glycation, diabetes, and aging. Recent Prog Horm Res. 2001;56:1–21. doi: 10.1210/rp.56.1.1. [DOI] [PubMed] [Google Scholar]
- [20].Thornalley PJ. Glycation in diabetic neuropathy: characteristics, consequences, causes, and therapeutic options. Int Rev Neurobiol. 2002;50:37–57. doi: 10.1016/s0074-7742(02)50072-6. [DOI] [PubMed] [Google Scholar]
- [21].Turk Z. Glycotoxines, carbonyl stress and relevance to diabetes and its complications. Physiol Res. 2010;59:147–156. doi: 10.33549/physiolres.931585. [DOI] [PubMed] [Google Scholar]
- [22].Nemet I, Turk Z, Duvnjak L, Car N, Varga-Defterdarovic L. Humoral methylglyoxal level reflects glycemic fluctuation. Clin Biochem. 2005;38:379–38. doi: 10.1016/j.clinbiochem.2004.12.008. [DOI] [PubMed] [Google Scholar]
- [23].Phillips SA, Mirrlees D, Thornalley PJ. Modification of the glyoxalase system in streptozotocin-induced diabetic rats. Effect of the aldose reductase inhibitor Statil. Biochem Pharmacol. 1993;46:805–811. doi: 10.1016/0006-2952(93)90488-i. [DOI] [PubMed] [Google Scholar]
- [24].Miller AG, Smith DG, Bhat M, Nagaraj RH. Glyoxalase I is critical for human retinal capillary pericyte survival under hyperglycemic conditions. J Biol Chem. 2006;281:11864–11871. doi: 10.1074/jbc.M513813200. [DOI] [PubMed] [Google Scholar]
- [25].Fujimoto M, Uchida S, Watanuki T, et al. Reduced expression of glyoxalase-1 mRNA in mood disorder patients. Neurosci Lett. 2008;438:196–199. doi: 10.1016/j.neulet.2008.04.024. [DOI] [PubMed] [Google Scholar]
- [26].Ahmed N. Advanced glycation endproducts--role in pathology of diabetic complications. Diabetes Res Clin Pract. 2005;67:3–21. doi: 10.1016/j.diabres.2004.09.004. [DOI] [PubMed] [Google Scholar]
- [27].Johnson MS, Ryals JM, Wright DE. Early loss of peptidergic intraepidermal nerve fibers in an STZ-induced mouse model of insensate diabetic neuropathy. Pain. 2008;140:35–47. doi: 10.1016/j.pain.2008.07.007. [DOI] [PMC free article] [PubMed] [Google Scholar]
- [28].Zylka MJ, Rice FL, Anderson DJ. Topographically distinct epidermal nociceptive circuits revealed by axonal tracers targeted to Mrgprd. Neuron. 2005;45:17–25. doi: 10.1016/j.neuron.2004.12.015. [DOI] [PubMed] [Google Scholar]
- [29].Williams SK, Howarth NL, Devenny JJ, Bitensky MW. Structural and functional consequences of increased tubulin glycosylation in diabetes mellitus. Proc Natl Acad Sci U S A. 1982;79:6546–6550. doi: 10.1073/pnas.79.21.6546. [DOI] [PMC free article] [PubMed] [Google Scholar]
- [30].Rabbani N, Thornalley PJ. Dicarbonyls linked to damage in the powerhouse: glycation of mitochondrial proteins and oxidative stress. Biochem Soc Trans. 2008;36:1045–1050. doi: 10.1042/BST0361045. [DOI] [PMC free article] [PubMed] [Google Scholar]
- [31].Schalkwijk CG, Brouwers O, Stehouwer CD. Modulation of insulin action by advanced glycation endproducts: a new player in the field. Horm Metab Res. 2008;40:614–619. doi: 10.1055/s-0028-1082085. [DOI] [PubMed] [Google Scholar]
- [32].Duran-Jimenez B, Dobler D, Moffatt S, et al. Advanced glycation endproducts in extracellular matrix proteins contribute to the failure of sensory nerve regeneration in diabetes. Diabetes. 2009;58:2893–2903. doi: 10.2337/db09-0320. [DOI] [PMC free article] [PubMed] [Google Scholar]
- [33].Mendez JD, Xie J, Aguilar-Hernandez M, Mendez-Valenzuela V. Molecular susceptibility to glycation and its implication in diabetes mellitus and related diseases. Mol Cell Biochem. 344:185–193. doi: 10.1007/s11010-010-0541-3. [DOI] [PubMed] [Google Scholar]
- [34].Yu Y, Thorpe SR, Jenkins AJ, et al. Advanced glycation endproducts and methionine sulphoxide in skin collagen of patients with type 1 diabetes. Diabetologia. 2006;49:2488–2498. doi: 10.1007/s00125-006-0355-8. [DOI] [PubMed] [Google Scholar]
- [35].Chabroux S, Canoui-Poitrine F, Reffet S, et al. Advanced glycation endproducts assessed by skin autofluorescence in type 1 diabetics are associated with nephropathy, but not retinopathy. Diabetes Metab. 36:152–157. doi: 10.1016/j.diabet.2009.11.003. [DOI] [PubMed] [Google Scholar]
- [36].Han Y, Randell E, Vasdev S, et al. Plasma advanced glycation endproduct, methylglyoxal-derived hydroimidazolone is elevated in young, complication-free patients with Type 1 diabetes. Clin Biochem. 2009;42:562–569. doi: 10.1016/j.clinbiochem.2008.12.016. [DOI] [PubMed] [Google Scholar]
- [37].Williams Rt, Lim JE, Harr B, et al. A common and unstable copy number variant is associated with differences in Glo1 expression and anxiety-like behavior. PLoS One. 2009;4:e4649. doi: 10.1371/journal.pone.0004649. [DOI] [PMC free article] [PubMed] [Google Scholar]
- [38].Perry GH, Yang F, Marques-Bonet T, et al. Copy number variation and evolution in humans and chimpanzees. Genome Res. 2008;18:1698–1710. doi: 10.1101/gr.082016.108. [DOI] [PMC free article] [PubMed] [Google Scholar]
- [39].Choy KW, Setlur SR, Lee C, Lau TK. The impact of human copy number variation on a new era of genetic testing. BJOG. 117:391–398. doi: 10.1111/j.1471-0528.2009.02470.x. [DOI] [PubMed] [Google Scholar]
- [40].Engelen L, Ferreira I, Brouwers O, et al. Polymorphisms in glyoxalase 1 gene are not associated with vascular complications: the Hoorn and CoDAM studies. J Hypertens. 2009;27:1399–1403. doi: 10.1097/HJH.0b013e32832af6ba. [DOI] [PubMed] [Google Scholar]
- [41].Ranganathan S, Ciaccio PJ, Walsh ES, Tew KD. Genomic sequence of human glyoxalase-I: analysis of promoter activity and its regulation. Gene. 1999;240:149–155. doi: 10.1016/s0378-1119(99)00420-5. [DOI] [PubMed] [Google Scholar]
- [42].Thornalley PJ. Glyoxalase I--structure, function and a critical role in the enzymatic defence against glycation. Biochem Soc Trans. 2003;31:1343–1348. doi: 10.1042/bst0311343. [DOI] [PubMed] [Google Scholar]
- [43].Shinohara M, Thornalley PJ, Giardino I, et al. Overexpression of glyoxalase-I in bovine endothelial cells inhibits intracellular advanced glycation endproduct formation and prevents hyperglycemia-induced increases in macromolecular endocytosis. J Clin Invest. 1998;101:1142–1147. doi: 10.1172/JCI119885. [DOI] [PMC free article] [PubMed] [Google Scholar]
- [44].Morcos M, Du X, Pfisterer F, et al. Glyoxalase-1 prevents mitochondrial protein modification and enhances lifespan in Caenorhabditis elegans. Aging Cell. 2008;7:260–269. doi: 10.1111/j.1474-9726.2008.00371.x. [DOI] [PubMed] [Google Scholar]
- [45].Ahmed U, Dobler D, Larkin SJ, Rabbani N, Thornalley PJ. Reversal of hyperglycemia-induced angiogenesis deficit of human endothelial cells by overexpression of glyoxalase 1 in vitro. Ann N Y Acad Sci. 2008;1126:262–264. doi: 10.1196/annals.1433.035. [DOI] [PMC free article] [PubMed] [Google Scholar]
- [46].Tan PL, Katsanis N. Thermosensory and mechanosensory perception in human genetic disease. Hum Mol Genet. 2009;18:R146–155. doi: 10.1093/hmg/ddp412. [DOI] [PMC free article] [PubMed] [Google Scholar]
- [47].Bierhaus A, Haslbeck KM, Humpert PM, et al. Loss of pain perception in diabetes is dependent on a receptor of the immunoglobulin superfamily. J Clin Invest. 2004;114:1741–1751. doi: 10.1172/JCI18058. [DOI] [PMC free article] [PubMed] [Google Scholar]
- [48].Gemignani F, Brindani F, Vitetta F, Marbini A. Restless legs syndrome and painful neuropathy-retrospective study. A role for nociceptive deafferentation? Pain Med. 2009;10:1481–1486. doi: 10.1111/j.1526-4637.2009.00732.x. [DOI] [PubMed] [Google Scholar]
- [49].Trenkwalder C, Paulus W. Restless legs syndrome: pathophysiology, clinical presentation and management. Nat Rev Neurol. 6:337–346. doi: 10.1038/nrneurol.2010.55. [DOI] [PubMed] [Google Scholar]
- [50].Stefansson H, Rye DB, Hicks A, et al. A genetic risk factor for periodic limb movements in sleep. N Engl J Med. 2007;357:639–647. doi: 10.1056/NEJMoa072743. [DOI] [PubMed] [Google Scholar]


