Abstract
Metformin is widely used for T2D therapy but its cellular mechanism of action is undefined. Recent studies on the mechanism of metformin in T2D have demonstrated involvement of the immune system. Current immunotherapies focus on the potential of immunomodulatory strategies for the treatment of T2D. In this study, we examined the effects of metformin on the antigen-presenting function of antigen-presenting cells (APCs). Metformin decreased both MHC class I and class II-restricted presentation of OVA and suppressed the expression of both MHC molecules and co-stimulatory factors such as CD54, CD80, and CD86 in DCs, but did not affect the phagocytic activity toward exogenous OVA. The class II-restricted OVA presentation-regulating activity of metformin was also confirmed using mice that had been injected with metformin followed by soluble OVA. These results provide an understanding of the mechanisms of the T cell response-regulating activity of metformin through the inhibition of MHC-restricted antigen presentation in relation to its actions on APCs.
Keywords: Metformin, MHC-restricted antigen presentation, Antigen-presenting cells
INTRODUCTION
Type 2 diabetes (T2D) is a metabolic disease that has reached epidemic proportions worldwide and promotes the risk for cardiovascular diseases. The clinical management of T2D has become a major public health challenge around the world.
Metformin is widely used for T2D therapy. Metformin ameliorates hyperglycemia without stimulating insulin secretion, promoting weight gain, or causing hypoglycemia (Stumvoll et al., 1995; Wiernsperger and Bailey, 1999). In addition, metformin has beneficial effects on circulating lipids linked to increased cardiovascular diseases (Wu et al., 1990; Jean-Claude et al., 2003; Kota et al., 2009). The main molecular target of metformin is AMP-activated protein kinase (AMPK) activation. AMPK is a highly conserved heterotrimeric kinase that functions as a metabolic switch, coordinating the cellular enzymes involved in carbohydrate and fat metabolism to enable ATP conservation and synthesis. Recently, it has been found that AMPK plays an important role in inflammation, and metformin is a potential drug to treat inflammation-related disorders (Isoda et al., 2006; Sag et al., 2008; Nath et al., 2009). However, little is known about its immune-enhancing effects or its effects on antigen presentation in T cell responses based on the capability of antigen-presenting cells (APCs).
Antigen-presenting cells, especially dendritic cells (DCs), play a critical role in the initiation of immune responses and the induction of immune tolerance. DCs are the most important accessory cells for the activation of naïve T cells and the generation of primary T cell responses (Banchereau et al., 2000). They can acquire and process antigens in the periphery and migrate to secondary lymphoid tissues where they prime primary T cell responses. Since T cells can only recognize antigens presented on MHC molecules, modulation of MHC-restricted antigen processing pathways may provide novel pharmacological targets for the regulation of T cell responses. Indeed, it was shown recently that cyclosporin A (CsA) and tacrolimus inhibit both the class I and class II MHC-restricted antigen presentation pathways in DCs, suggesting that the immunosuppressive activity of CsA and tacrolimus is at least in part due to inhibition of the antigen-processing pathways (Lee et al., 2005; Lee et al., 2007). Macrophage-colony stimulating factor (M-CSF) was also shown to enhance MHC-restricted antigen presentation (Han et al., 2005). Our previous research indicated that sulforaphane, an isothiocyanate found in cruciferous vegetables, enhances MHC class II-restricted antigen presentation of APCs, but does not affect phagocytosis, a MHC class O-restricted antigen presentation pathway (Shin et al., 2011). This suggests that modulation of the antigen-specific signal may be useful for therapeutic regulation of T cell responses.
In the present study, we examined the effects of metformin on the in vitro and in vivo function of DCs, exploring the modulation of T cell responses by metformin as an immune-regulating agent. We used OVA (ovalbumin) as an exogenous antigen in conjunction with metformin and then compared the change in cross-presentation of metformin-related DCs to that of a control group, along with the levels of MHC class I and II molecules and co-stimulatory factors.
MATERIALS AND METHODS
Cells and reagents
The T cell hybridomas, CD8 OVA1.3 and DOBW, were kindly provided by Dr. Clifford V. Harding (Case Western Reserve University, Cleveland, OH, USA) (Harding et al., 1991; Harding and Song, 1994). The DC cell line, DC2.4, was obtained from Dana-Farber Cancer Institute, Boston, MA, USA (Shen et al., 1997). Metformin (Diabex®) was purchased from Daewoong Pharm. Co., Ltd. (Seoul, Republic of Korea).
Generation of DCs from bone marrow cells
Total bone marrow cells obtained from the femurs of balb/c mice were cultured in 6-well plates (5×10⁶/well) in culture medium supplemented with 400 U/ml recombinant mouse granulocyte-macrophage colony-stimulating factor (GM-CSF, CreaGene, Korea). At days 3 and 4 from the initiation of the culture, the nonadherent cells were discarded after gentle shaking and replacing the culture medium with fresh medium containing cytokines. The DCs were harvested by gentle pipetting on day 5.
Preparation of peritoneal macrophages
Peritoneal macrophages were elicited by injecting 1 ml of 3% thioglycollate in sterile water into mouse peritoneum. After 4 days, the cells in the peritoneum were harvested by peritoneal lavage with ice-cold PBS. The red blood cells in the cell preparation were lysed by treating the cells with ACK lysis buffer (150 mM NH4Cl, 1 M KHCO3, 0.1 mM Na2EDTA, pH 7.2-7.4) for 1 min.
Preparation of OVA-nanospheres
Nanospheres containing OVA were prepared using a homogenization/solvent evaporation method, as described previously, with 400 μl of OVA-containing water (50 mg/ml OVA) and 2 ml of ethyl acetate containing Polylactic-Co-Glycolic Acid (PLGA, 100 mg/ml, Sigma-Aldrich) (Lee et al., 2010). Fluorescein isothiocyanate (FITC)-containing PLGA-nanospheres were prepared by adding FITC to the ethyl acetate phase together with PLGA. The OVA content was determined using a micro-bicinchoninic acid assay kit (Pierce, Rockford, IL, USA) after lysing the nanospheres in lysis buffer containing 0.1% SDS and 0.1 N NaOH.
MHC class I-restricted presentation assay of exogenous OVA
DCs were cultured in the presence of different concentrations of metformin for 2 hrs in 96-well plates (1×10⁵ cells/ml) and then combined with OVA-microspheres (50 mg/ml). After 6 h incubation at 37℃, the cells were washed twice with pre-warmed PBS and then fixed with ice-cold 1% paraformaldehyde for 5 min at room temperature. The plate was washed and CD8OVA1.3 cells (1×10⁵ cells/ml) were added. After overnight incubation at 37℃, the plate was centrifuged at 1,800 rpm; the culture supernatant was collected and assayed for IL-2 content using an IL-2 ELISA kit (eBioscience, San Jose, CA, USA).
MHC class II-restricted presentation assay of exogenous OVA
DCs and peritoneal macrophages were cultured in the presence of different concentrations of CME for 2 hrs in 96-well plates (1×10⁵ cells/ml) and then combined with OVA-microspheres (50 μg/ml). After 6 hrs incubation at 37℃, the plate was washed twice with pre-warmed PBS and then fixed with ice-cold 1% paraformaldehyde for 5 min at room temperature. The plate was washed and DOBW cells (1×10⁵ cells/ml) were added. After overnight incubation at 37℃, the plate was centrifuged at 1,800 rpm; the culture supernatant was collected and assayed for IL-2 content using an IL-2 ELISA kit.
Phagocytosis assay
DCs were cultured in the presence of different concentrations of metformin for 2 hrs in 6-well plates (2×10⁶ cells/well) and then combined with microspheres (average diameter, 300 nm) containing both OVA and FITC. After 2 hrs, unphagocytosed microspheres were removed by washing with pre-warmed PBS. The plate was chilled on ice for 20 min, and the cells remaining on the bottom of the plate wells were subsequently harvested by rough pipetting with cold PBS, washed with 10 ml of cold PBS to remove the extra-particular OVA, and then fixed with 1% paraformaldehyde. Flow cytometric analysis was performed on a FACS Canto flow cytometer (Beckman Coulter, Brea, USA).
Phenotype analysis
DCs were cultured in the presence of different concentrations of metformin for 2 hrs in 6-well plates (2×10⁶ cells/well). The plates were chilled on ice for 20 min, and the cells remaining on the bottom of the plate wells were subsequently harvested by rough pipetting with cold PBS. The cells were stained with monoclonal antibodies recognizing murine cell surface molecules after blocking with FcR-binding anti-CD16/CD32 monoclonal antibody, and flow cytometry analysis was performed on a FACS Canto flow cytometer. The monoclonal antibodies, anti-H-2Kb and anti-I-Ab, and isotype-matched control antibodies were purchased from BD Biosciences (San Jose, CA, USA).
In vivo antigen presentation assay
Peritoneal macrophages were elicited by injecting 1 ml of 3% thioglycollate in PBS into the mouse peritoneum. After 4 days, metformin (250 mg/kg) was injected subcutaneously. Two hours later, soluble OVA (2 mg/mouse) was injected into the peritoneum. Metformin (250 mg/kg) was again injected subcutaneously 2 hrs after injecting the soluble OVA. The peritoneal macrophages were harvested from the peritoneum 2 hrs after the second injection of metformin and washed. The class II MHC-complexed OVA peptide quantities were then assessed by IL-2 secretion assays after culturing the paraformaldehyde-fixed peritoneal macrophages with DOBW cells (1×10⁵/well) for 18 hrs, as described previously (Lee et al., 2010).
Statistical analysis
The statistical significance of the difference between the control and treatment groups was assessed using one-way ANOVA followed by a Student's t-test.
RESULTS
Metformin decreased the MHC-restricted presentation of exogenous OVA
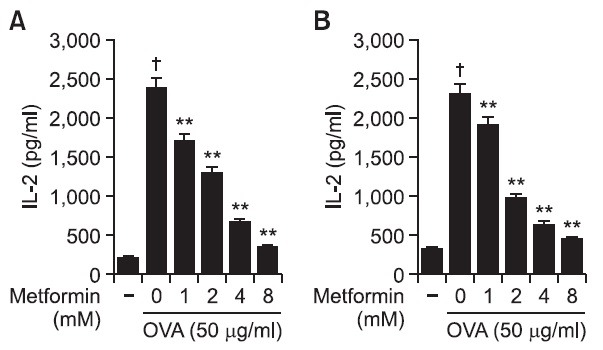
The effects of metformin on the MHC class I-restricted presentation of exogenous OVA were examined using DC2.4 and BM-DCs. In this experiment, cells were treated with the indicated amounts of metformin for 2 hrs, after which microencapsulated OVA were added into cultures for phagocytosis to examine whether exogenous antigen presentation pathways could be affected by metformin. The cells were washed and then an MHC class I-restricted presentation assay was performed with CD8OVA1.3 cells. After 18 hrs incubation at 37℃ and 5% CO2, the supernatant was collected and then assayed for IL-2 content using an IL-2 ELISA kit. As shown in Fig. 1A, the treatment of DC2.4 with metformin dose-dependently suppressed MHC class I-restricted OVA. The effects of metformin on the cross-presentation of exogenous OVA were also examined in BM-DCs. The treatment of BM-DCs with metformin also decreased the level of MHC class I-restricted OVA peptide presentation (Fig. 1B).
Fig. 1. Effects of metformin on the cross-presentation of exogenous OVA. (A) DC2.4 cells and (B) BM-DCs were cultured with the indicated amounts of metformin for 2 hrs, followed by the addition of OVA-nanospheres. After 6 hrs incubation, the cells were washed and fixed, the amounts of OVA peptides presented on MHC class I molecules were assessed using OVA-specific CD8 T cell hybridoma, CD8OVA1.3. The amounts of IL-2 produced from OVA-specific CD8 T cells were assayed by a commercial IL-2 ELISA kit. †p<0.01 vs. untreated group based on Student’s t-test. **p<0.01 vs. OVA only based on Student’s t-test.
The effects of metformin on the class II presentation of exogenous exogenous OVA in both BM-DCs and peritoneal macrophages were examined. DCs were generated from bone marrow cells of balb/c mice and peritoneal macrophages were elicited by injection of thioglycolate into mouse peritoneum. Cells were subsequently treated for 2 hrs with metformin and allowed to phagocytose OVA-microspheres for 6 hrs; unphagocytosed OVA microspheres and metformin were removed by washing, after which a class II MHC-restricted presentation assay was performed with DOBW cells. After 18 hrs incubation at 37℃ and 5% CO2, the supernatant was collected and then assayed for IL-2 content using an IL-2 ELISA kit. As shown in Fig. 2A, MHC class II-restricted presentation of exogenous OVA was significantly decreased by CME in BM-DCs. The effects of metformin on the MHC class II presentation of exogenous OVA were also examined in peritoneal macrophages isolated from the thioglycollate-elicited mouse peritoneum. The treatment of peritoneal macrophages with metformin also decreased the level of MHC class II-restricted OVA peptide adipresentation (Fig. 2B).
Fig. 2. Effects of metformin on the MHC class II-restricted presentation of exogenous OVA. (A) BM-DCs and (B) peritoneal macrophages were cultured with the indicated amounts of metformin for 2 hrs, and then combined with OVA-microspheres. After 6 hrs incubation, the cells were washed and fixed, and the amounts of OVA peptides presented on MHC class II molecules were assessed using OVA-specific CD4 T cell hybridoma, DOBW. The amounts of IL-2 produced from OVA-specific CD4 T cells were assayed by a commercial IL-2 ELISA kit. †p<0.01 vs. untreated group based on Student’s t-test. **p<0.01 vs. OVA only based on Student’s t-test.
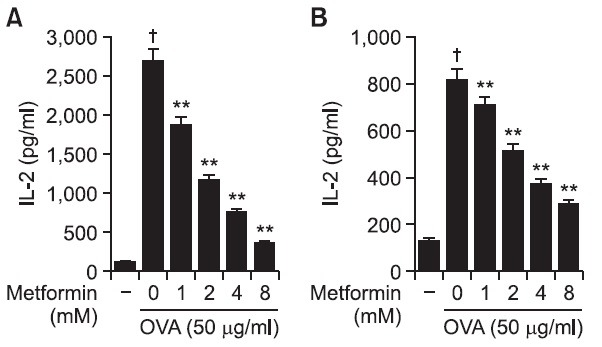
Thus, metformin suppressed exogenous OVA presentation in both MHC class I- and MHC class II-restricted presentation.
Metformin does not affect the phagocytic activity of DCs
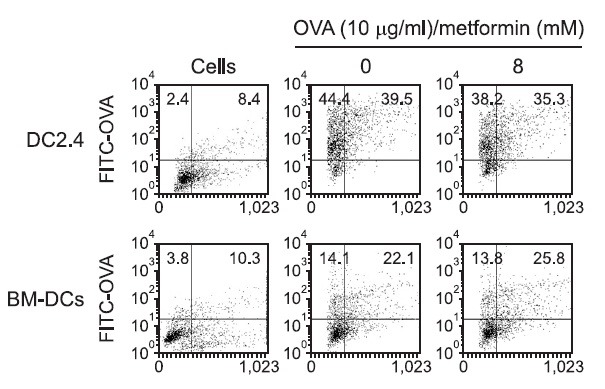
To prove that the antigen presentation was not changed effects of metformin on the phagocytic activity of DCs, FITC-conjugated OVA microspheres were prepared as described above. DCs were incubated with metformin for 2 hrs. Then microspheres containing both OVA and FITC were added. After 2 hrs, DCs were washed and harvested. The level of phagocytosis was determined by flow cytometry. Flow cytometry of the harvested cells showed that the levels of phagocytosis in the absence or presence of metformin were similar (Fig. 3). The results show that the MHC-restricted antigen presentation-decreasing effect of metformin is not due to the inhibition of the phagocytic activity of DCs.
Fig. 3. Effects of metformin on the phagocytic activity. DC2.4 cells and BM-DCs were incubated with metformin for 2 hrs, and the nanospheres containing both OVA and FITC were added. After 2 h incubation, unphagocytosed microspheres were washed, and the cells were harvested by gentle pipetting, and then analyzed by flow cytometry.
Metformin slightly decreases the expression of MHC molecules and co-stimulatory factors
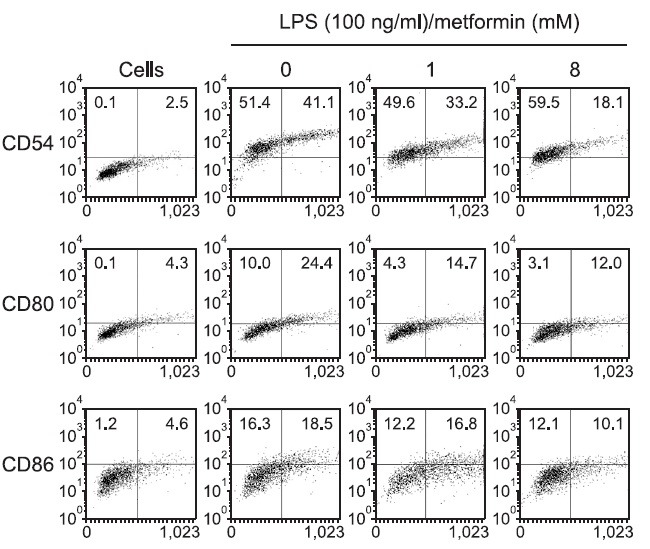
To determine if the MHC-restricted antigen presentation-decreasing effect of metformin was due to the inhibited expression of MHC molecules and co-stimulatory factors on the cell surface, DC2.4 or BM-DCs were cultured with metformin (8 mM), and the expression levels of MHC class I and class II molecules were measured by flow cytometry. As shown in Fig. 4, metformin decreased the expression of MHC class I (H-2Kb) and II (I-Ab) molecules slightly, as well as that of CD54, B7-1, and B7-2 molecules to a discernible level (Fig. 5).
Fig. 4. Effects of meformin on the expression of MHC molecules. (A) DC2.4 cells and (B) BM-DCs were incubated with metformin (8 mM) for 2 h, and harvested by gentle pipetting. The expression levels of class I and class II MHC molecules were assessed using anti-H-2Kb and anti-I-Ab monoclonal antibodies.
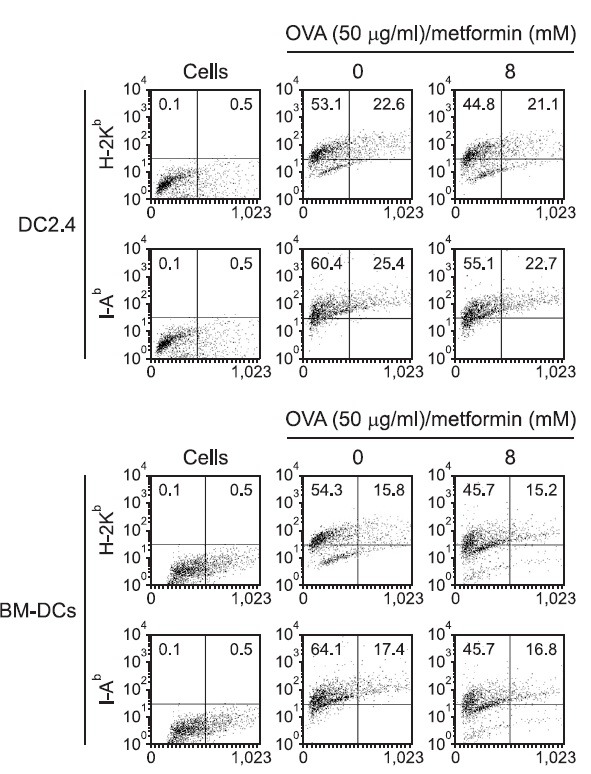
Fig. 5. Effects of metformin on the expression of co-stimulatory molecules. DC2.4 cells were incubated with metformin (1 and 8 mM) for 2 hrs, and harvested by gentle pipetting. The cells were then stained with monoclonal antibodies recognizing murine CD54, B7-1, and B7-2.
Metformin decreases the MHC class II-restricted exogenous antigen presentation in vivo
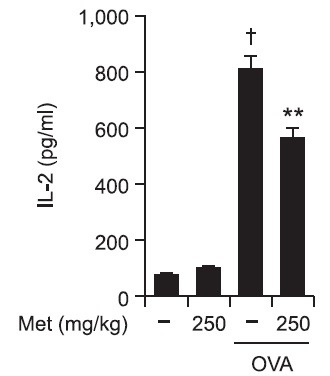
The in vivo relevance of the MHC class II-restricted antigen presentation-increasing effect of metformin was examined in mice. In this experiment, peritoneal macrophages were first elicited by injecting thioglycollate into the mouse peritoneum. Four days later, metformin was injected subcutaneously, and soluble OVA were then injected into the peritoneum. Peritoneal macrophages were harvested from the peritoneum 4 hrs after the soluble OVA injection and washed. The class II MHC-complexed OVA peptide quantities were assessed by IL-2 secretion assays using DOBW cells. As shown in Fig. 6, metformin decreased the MHC class II-restricted OVA peptide presentation in peritoneal macrophages. These results show that suppresses the MHC class II-restricted exogenous antigen presentation in vivo.
Fig. 6. Metformin decreases the MHC class II-restricted presentation of exogenous OVA in peritoneal macrophages in vivo. The peritoneal macrophages were elicited by injecting thioglycollate in PBS into the mouse peritoneum. After 4 days, metformin (250 mg/kg) was injected subcutaneously. Two hours later, soluble OVA (2 mg/mouse) was injected into the peritoneum. Metformin (250 mg/kg) was again injected subcutaneously 2 hrs after the injection of soluble OVA. The peritoneal macrophages were harvested from the peritoneum 2 hrs after the second injection of metformin, washed, and then class II MHC-complexed OVA peptide quantities were then assessed by IL-2 secretion assays after culturing the paraformaldehyde-fixed peritoneal macrophages with DOBW cells for 18 h. †p<0.01 vs. untreated group based on Student’s t-test. **p<0.01 vs. OVA only based on Student’s t-test.
DISCUSSION
This study shows that short-term exposure of metformin decreases the ability of professional APCs to present MHC class I- and MHC class II-restricted exogenous OVA both in vitro and in vivo. Metformin did not affect the phagocytosis of exogenous antigen, but it inhibited MHC molecules and co-stimulatory molecules that prime the T cell responses. Metformin could affect many cellular immune reactions mediated by T cells.
Obesity, metabolic syndrome, and associated insulin resistance are major contributors to cardiovascular disease, the leading cause of mortality in the United States (Surwit et al., 1988; Stunkard, 1996; Weiser et al., 1997; Nicolai et al., 2009). Increased rates of glucose production are strongly correlated with increased fasting plasma glucose concentrations in patients with T2D (DeFronzo, 1988; Jeng et al., 1994). Development of T2D has now been linked to the establishment of chronic obesity-associated inflammation in the visceral adipose tissue (Kintscher et al., 2008; Nishimura et al., 2009). As an individual becomes obese, several changes occur within the adipose tissue, leading to a shift from an anti-inflammatory to an inflammatory milieu. These changes include: adipocyte hypertrophy, a decrease in adiponectin (an anti-inflammatory protein produced by adipocytes), an increase in plasma C-reactive protein (CRP) levels, increased levels of proinflammatory cytokines such as interleukin (IL)-6, tumor necrosis factor (TNF)-α and IL-1β, activation of the transcription factor nuclear factor (NF)-κB, infiltration of proinflammatory macrophages (M1), and infiltration of proinflammatory CD8+ and CD4+ T cells into the adipose tissue (Donath and Shoelson, 2011; Meijer et al., 2011; Ouchi et al., 2011).
Metformin was discovered in the 1920s in a search for guanidine-containing compounds with anti-diabetic activities and was introduced clinically in Europe in the 1950s. Since then it has a long history of human consumption (Bailey and Turner, 1996). Metformin is one of the most widely prescribed drugs for the treatment of type 2 diabetes (Hardie, 2007). Although used as a drug since 1957, the mechanism by which metformin lowers glucose and lipids remains unknown. Two effects, decreased hepatic glucose production (Schäfer, 1983; Stumvoll et al., 1995; Hundal et al., 2000) and increased skeletal myocyte glucose uptake (Hundal et al., 1992; Galuska et al., 1994), have been implicated as major contributors to glucose-lowering efficacy. Metformin also increases hepatic lipids in obese mice (Lin et al., 2000). However, metformin is a low-potency compound that is used at high doses, resulting in only modest net efficacy; in addition, significant side effects can occur (Stumvoll et al., 1995). The main molecular target of metformin is AMPK activation. AMPK is a highly conserved heterotrimeric kinase that functions as a metabolic switch, coordinating the cellular enzymes involved in carbohydrate and fat metabolism to enable ATP conservation and synthesis. AMPK is activated by conditions that increase the adenosine monophosphate (AMP): adenosine triphosphate (ATP) ratio, such as exercise and metabolic stress. The effects of stress, exercise, hypoxia and ischemia on AMPK activation have been extensively examined. When the AMP: ATP ratio increases, AMPK is activated by AMPK kinase, and a conformational change is induced when it combines with AMP, thereby decreasing the AMP: ATP ratio by switching off ATP-consuming pathways and switching on ATP-generating pathways (Hardie et al., 1998). Thus, an understanding of the molecular basis for metformin effects on glucose and lipid homeostasis is a critical focus of research directed toward improved therapeutic approaches to T2D and related disorders. However, little is known about its immunomodulatory effects or the mechanism of its effects on DCs.
Since T cells can only recognize antigens presented on MHC molecules, the impact of the inhibition of MHC-restricted antigen presentation must be far-reaching. DCs, professional APCs, play a key role in the initiation of primary immune responses (Banchereau et al., 2000) and are capable of processing cell-associated antigens for presentation on MHC class I molecules (Brossart and Bevan, 1997). In vitro, several forms of antigens can access the exogenous pathway for cross presentation, apparently through phagocytic or nonphagocytic mechanisms (Larsson et al., 2001). Furthermore, DCs can acquire and process antigens in the periphery and migrate to secondary lymphoid tissues where they prime primary T cell responses. The classical paradigm of antigen presentation by APCs is that endogenous antigens are presented via MHC class I molecules to CD8 T cells, whereas exogenous antigens are presented via CD4 T cells (Guermonprez et al., 2002). However, APCs process exogenous antigens for presentation by MHC class I molecules to CD8 T cells. This process, termed cross presentation, may be a mechanism by which naïve T cells can be primed to antigens that are present in nonprofessional APCs (Bevan, 1976; Harding, 1995). The results presented in this paper demonstrate that short-term exposure of DCs to metformin suppressed both MHC class I and II-restricted antigen presentation capabilities of DCs. Based on the importance of DCs in the initiation of T cell responses and the current finding, which demonstrated that short-term exposure to metformin inhibited MHC-restricted antigen presentation, we are tempted to speculate that the therapeutic efficacy of metformin is due, at least in part, to the suppression of the antigen-presenting capability of DCs.
To our knowledge, this is the first report concerning the effects of metformin on APCs. In this study, we have shown that DCs exposed to metformin are suppressed with respect to MHC-restricted exogenous antigen-presenting capability. Furthermore, metformin decreased MHC class I and class II-restricted exogenous antigen-presenting capability of DCs, leading to reduced expression of total MHC molecules and co-stimulatory factors. However, metformin did not affect the phagocytic activity toward exogenous antigen.
In all experiments, the DCs were exposed to metformin and allowed to phagocytose OVA-microspheres in the presence of metformin. The DCs were washed to remove the unphagocytosed OVA-microspheres, fixed with paraformaldehyde, and then washed thoroughly to remove paraformaldehyde before the functional assays with OVA-specific CD4 or CD8 T cells. Therefore, the activation of OVA-specific T cells must be due to the enhanced expression of OVA peptides on DCs, and not to the carryover of metformin to the T cell cultures. OVA-specific T cell hybridomas such as DOBW cells and CD8 OVA1.3 cells were used to measure the amounts of OVA peptides complexed with MHC molecules and co-stimulatory factors. Thus, based on the results of the present study, which showed that metformin can regulate MHC class I- and class II-restricted presentation of exogenous antigens through a decrease in the expression of co-stimulatory molecules, but do not affect phagocytosis in DCs, we are tempted to speculate that some immune-regulating agents may have therapeutic efficacy for immunodeficiency diseases.
Acknowledgments
This paper was supported by the Sahmyook University Research fund.
References
- 1.Bailey C. J., Turner R. C. Metformin. N. Engl. J. Med. (1996);334:574–579. doi: 10.1056/NEJM199602293340906. [DOI] [PubMed] [Google Scholar]
- 2.Banchereau J., Briere F., Caux C., Davoust J., Lebecque S., Liu Y. J., Pulendran B., Palucka K. Immunobiology of dendritic cells. Annu. Rev. Immunol. (2000);18:767–811. doi: 10.1146/annurev.immunol.18.1.767. [DOI] [PubMed] [Google Scholar]
- 3.Bevan M. J. Cross-priming for a secondary cytotoxic response to minor H antigens with H-2 congenic cells which do not cross-react in the cytotoxic assay. J. Exp. Med. (1976);143:1283–1288. doi: 10.1084/jem.143.5.1283. [DOI] [PMC free article] [PubMed] [Google Scholar]
- 4.Brossart P., Bevan M. J. Presentation of exogenous protein antigens on major histocompatibility complex class I molecules by dendritic cells: pathway of presentation and regulation by cytokines. Blood. (1997);90:1594–1599. [PMC free article] [PubMed] [Google Scholar]
- 5.DeFronzo R. A. The triumvirate: β-cell, muscle, liver: a collusion responsible for NIDDM. Diabetes. (1988);37:667–687. doi: 10.2337/diab.37.6.667. [DOI] [PubMed] [Google Scholar]
- 6.Donath M. Y., Shoelson S. E. Type 2 diabetes as an inflammatory disease. Nat. Rev. Immunol. (2011);11:98–107. doi: 10.1038/nri2925. [DOI] [PubMed] [Google Scholar]
- 7.Galuska D., Nolte L. A., Zierath J. R., Wallberg-Henriksson H. Effect of metformin on insulin-stimulated glucose transport in isolated skeletal muscle obtained from patients with NIDDM. Diabetologia. (1994);37:826–832. doi: 10.1007/BF00404340. [DOI] [PubMed] [Google Scholar]
- 8.Guermonprez P., Valladeau J., Zitvogel L., Théry C., Amigorena S. Antigen presentation and T cell stimulation by dendritic cells. Annu. Rev. Immunol. (2002);20:621–667. doi: 10.1146/annurev.immunol.20.100301.064828. [DOI] [PubMed] [Google Scholar]
- 9.Han S., Song Y., Lee Y. H., Lee Y. R., Lee C. K., Cho K., Kim K. Macrophage-colony stimulating factor enhances MHC-restricted presentation of exogenous antigen in dendritic cells. Cytokine. (2005);32:187–193. doi: 10.1016/j.cyto.2005.08.002. [DOI] [PubMed] [Google Scholar]
- 10.Hardie D. G. AMP-activated protein kinase as a drug target. Annu. Rev. Pharmacol. Toxicol. (2007);47:185–210. doi: 10.1146/annurev.pharmtox.47.120505.105304. [DOI] [PubMed] [Google Scholar]
- 11.Hardie D. G., Carling D., Carlson M. The AMP-activated/SNF1 protein kinase subfamily: metabolic sensors of the eukaryotic cell? Annu. Rev. Biochem. (1998);67:821–855. doi: 10.1146/annurev.biochem.67.1.821. [DOI] [PubMed] [Google Scholar]
- 12.Harding C. V. Phagocytic processing of antigens for presentation by MHC molecules. Trends Cell Biol. (1995);5:105–109. doi: 10.1016/s0962-8924(00)88959-x. [DOI] [PubMed] [Google Scholar]
- 13.Harding C. V., Collins D. S., Kanagawa O., Unanue E. R. Liposome-encapsulated antigens engender lysosomal processing for class II MHC presentation and cytosolic processing for class I presentation. J. Immunol. (1991);147:2860–2863. [PubMed] [Google Scholar]
- 14.Harding C. V., Song R. Phagocytic processing of exogenous particulate antigens by macrophages for presentation by class I MHC molecules. J. Immunol. (1994);153:4925–4933. [PubMed] [Google Scholar]
- 15.Hundal H. S., Ramlal T., Reyes R., Leiter L. A., Klip A. Cellular mechanism of metformin action involves glucose transporter translocation from an intracellular pool to the plasma membrane in L6 muscle cells. Endocrinology. (1992);131:1165–1173. doi: 10.1210/endo.131.3.1505458. [DOI] [PubMed] [Google Scholar]
- 16.Hundal R. S., Krssak M., Dufour S., Laurent D., Lebon V., Chandramouli V., Inzucchi S. E., Schumann W. C., Petersen K. F., Landau B. R., Shulman G. I. Mechanism by which metformin reduces glucose production in type 2 diabetes. Diabetes. (2000);49:2063–2069. doi: 10.2337/diabetes.49.12.2063. [DOI] [PMC free article] [PubMed] [Google Scholar]
- 17.Isoda K., Young J. L., Zirlik A., MacFarlane L. A., Tsuboi N., Gerdes N., Schönbeck U., Libby P. Metformin inhibits proinflammatory responses and nuclear factor-kappaB in human vascular wall cells. Arterioscler. Thromb. Vasc. Biol. (2006);26:611–617. doi: 10.1161/01.ATV.0000201938.78044.75. [DOI] [PubMed] [Google Scholar]
- 18.Jean-Claude M., Nicolas W., Geneviève R. Metformin inhibits monocyte adhesion to endothelial cells and foam cell formation. Br. J. Diabetes Vasc. Dis. (2003);3:302–310. [Google Scholar]
- 19.Jeng C. Y., Sheu W. H., Fuh M. M., Chen Y. D., Reaven G. M. Relationship between hepatic glucose production and fasting glucose concentration in patients with NIDDM. Diabetes. (1994);43:1440–1444. doi: 10.2337/diab.43.12.1440. [DOI] [PubMed] [Google Scholar]
- 20.Kintscher U., Hartge M., Hess K., Foryst-Ludwig A., Clemenz M., Wabitsch M., Fischer-Posovszky P., Barth T. F., Dragun D., Skurk T., Hauner H., Blüher M., Unger T., Wolf A. M., Knippschild U., Hombach V., Marx N. T-lymphocyte infiltration in visceral adipose tissue: a primary event in adipose tissue inflammation and the development of obesity-mediated insulin resistance. Arterioscler. Thromb. Vasc. Biol. (2008);28:1304–1310. doi: 10.1161/ATVBAHA.108.165100. [DOI] [PubMed] [Google Scholar]
- 21.Kota M., Naoki T., Maki Y., Jutaro T., Hiroshi M., Jun M., Tadaatsu I., Kei S., Toshihiro S. Metformin restores impaired HDL-mediated cholesterol efflux due to glycation. Atherosclerosis. (2009);206:434–438. doi: 10.1016/j.atherosclerosis.2009.03.003. [DOI] [PubMed] [Google Scholar]
- 22.Larsson M., Fonteneau J. F., Bhardwaj N. Dendritic cells resurrect antigens from dead cells. Trends Immunol. (2001);22:141–148. doi: 10.1016/s1471-4906(01)01860-9. [DOI] [PubMed] [Google Scholar]
- 23.Lee Y. H., Lee Y. R., Im S. A., Park S. I., Kim K. H., Gerelchuluun T., Song S., Kim K., Lee C. K. Calcineurin inhibitors block MHC-restricted antigen presentation in vivo. J. Immunol. (2007);179:5711–5716. doi: 10.4049/jimmunol.179.9.5711. [DOI] [PubMed] [Google Scholar]
- 24.Lee Y. R., Lee Y. H., Im S. A., Yang I. H., Ahn G. W., Kim K., Lee J. K. Biodegradable nanoparticles containing TLR3 or TLR9 agonists together with antigen enhance MHC-restricted presentation of the antigen. Arch. Parm. Res. (2010);33:1859–1866. doi: 10.1007/s12272-010-1119-z. [DOI] [PubMed] [Google Scholar]
- 25.Lee Y. R., Yang I. H., Lee Y. H., Im S. A., Song S., Li H., Han K., Kim K., Eo S. K., Lee C. K. Cyclosporin A and tacrolimus, but not rapamycin, inhibit MHC-restricted antigen presentation pathways in dendritic cells. Blood. (2005);105:3951–3955. doi: 10.1182/blood-2004-10-3927. [DOI] [PubMed] [Google Scholar]
- 26.Lin H. Z., Yang S. Q., Chuckaree C., Kuhajda F., Ronnet G., Diehl A. M. Metformin reverses fatty liver disease in obese, leptin-deficient mice. Nat. Med. (2000);6:998–1003. doi: 10.1038/79697. [DOI] [PubMed] [Google Scholar]
- 27.Meijer K., de Vries M., Al-Lahham S., Bruinenberg M., Weening D., Dijkstra M., Kloosterhuis N., van der Leij R. J., van der Want H., Kroesen B. J., Vonk R., Rezaee F. Human primary adipocytes exhibit immune cell function: adipocytes prime inflammation independent of macrophages. PLoS One. (2011);6:e17154. doi: 10.1371/journal.pone.0017154. [DOI] [PMC free article] [PubMed] [Google Scholar]
- 28.Nath N., Khan M., Paintlia M. K., Singh I., Hoda M. N., Giri S. Metformin attenuated the autoimmune disease of the central nervous system in animal models of multiple sclerosis. J. Immunol. (2009);182:8005–8014. doi: 10.4049/jimmunol.0803563. [DOI] [PMC free article] [PubMed] [Google Scholar]
- 29.Nicolai A., Li M., Kim D. H., Peterson S. J., Vanella L., Positano V., Gastaldelli A., Rezzani R., Rodella L. F., Drummond G., Kusmic C., L'Abbate A., Kappas A., Abraham N. G. Heme oxygenase-1 induction remodels adipose tissue and improves insulin sensitivity in obesity-induced diabetic rats. Hypertension. (2009);53:508–515. doi: 10.1161/HYPERTENSIONAHA.108.124701. [DOI] [PMC free article] [PubMed] [Google Scholar]
- 30.Nishimura S., Manabe I., Nagasaki M., Eto K., Yamashita H., Ohsugi M., Otsu M., Hara K., Ueki K., Sugiura S., Yoshimura K., Kadowaki T., Nagai R. CD8+ effectorT cells contribute to macrophage recruitment and adipose tissue inflammation in obesity. Nat. Med. (2009);15:914–920. doi: 10.1038/nm.1964. [DOI] [PubMed] [Google Scholar]
- 31.Ouchi N., Parker J. L., Lugus J. J., Walsh K. Adipokines in inflammation and metabolic disease. Nat. Rev. Immunol. (2011);11:85–97. doi: 10.1038/nri2921. [DOI] [PMC free article] [PubMed] [Google Scholar]
- 32.Sag D., Carling D., Stout R. D., Suttles J. Adenosine 5’-monophosphate-activated protein kinase promotes macrophage polarization to an anti-inflammatory functional phenotype. J. Immunol. (2008);181:8633–8641. doi: 10.4049/jimmunol.181.12.8633. [DOI] [PMC free article] [PubMed] [Google Scholar]
- 33.Schäfer G. Biguanides. A review of history, pharmacodynamics and therapy. Diabetes Metab. (1983);9:148–163. [PubMed] [Google Scholar]
- 34.Shen Z., Reznikoff G., Dranoff G., Rock K. L. Cloned dendritic cells can present exogenous antigens on both MHC class I and class II molecules. J. Immunol. (1997);158:2723–2730. [PubMed] [Google Scholar]
- 35.Shin S., Jung K. S., Park Y., Ko Y. W., Lee C. K., Cho K., Ha N. J., Kim. K. Sulforaphane enhances MHC class II-restricted presentation of exogenous antigens. Biomol. Ther. (2011);19:77–83. [Google Scholar]
- 36.Stumvoll M., Nurjhan N., Perriello G., Dailey G., Gerich J. E. Metabolic effects of metformin in non-insulin-dependent diabetes mellitus. N. Engl. J. Med. (1995);333:550–554. doi: 10.1056/NEJM199508313330903. [DOI] [PubMed] [Google Scholar]
- 37.Stunkard A. J. Current views on obesity. Am. J. Med. (1996);100:230–236. doi: 10.1016/s0002-9343(97)89464-8. [DOI] [PubMed] [Google Scholar]
- 38.Surwit R. S., Kuhn C. M., Cochrane C., McCubbin J. A., Feinglos M. N. Diet-induced type II diabetes in C57BL/6J mice. Diabetes. (1988);37:1163–1167. doi: 10.2337/diab.37.9.1163. [DOI] [PubMed] [Google Scholar]
- 39.Weiser M., Frishman W. H., Michaelson M. D., Abdeen M. A. The pharmacologic approach to the treatment of obesity. J. Clin. Pharmacol. (1997);37:453–473. doi: 10.1002/j.1552-4604.1997.tb04323.x. [DOI] [PubMed] [Google Scholar]
- 40.Wiernsperger N. F., Bailey C. J. The antihyperglycaemic effect of metformin: therapeutic and cellular mechanisms. Drugs. (1999);58:31–39. doi: 10.2165/00003495-199958001-00009. [DOI] [PubMed] [Google Scholar]
- 41.Wu M. S., Johnston P., Sheu W. H., Hollenbeck C. B., Jeng C. Y., Goldfine I. D., Chen Y. D., Reaven G. M. Effect of metformin on carbohydrate and lipoprotein metabolism in NIDDM patients. Diabetes Care. (1990);13:1–8. doi: 10.2337/diacare.13.1.1. [DOI] [PubMed] [Google Scholar]


