

Abstract
The stability of aptamer–ligand complexes is probed in nanopore-based dynamic force spectroscopy experiments. Specifically, the ATP-binding aptamer is investigated using a backward translocation technique, in which the molecules are initially pulled through an α-hemolysin nanopore from the cis to the trans side of a lipid bilayer membrane, allowed to refold and interact with their target, and then translocated back in the trans–cis direction. From these experiments, the distribution of bound and unbound complexes is determined, which in turn allows determination of the dissociation constant Kd ≈ 0.1 mM of the aptamer and of voltage-dependent unfolding rates. The experiments also reveal differences in binding of the aptamer to AMP, ADP, or ATP ligands. Investigation of an aptamer variant with a stabilized ATP-binding site indicates fast conformational switching of the original aptamer before ATP binding. Nanopore force spectroscopy is also used to study binding of the thrombin-binding aptamer to its target. To detect aptamer–target interactions in this case, the stability of the ligand-free aptamer—containing G-quadruplexes—is tuned via the potassium content of the buffer. Although the presence of thrombin was detected, limitations of the method for aptamers with strong secondary structures and complexes with nanomolar Kd were identified.
Introduction
Aptamers are DNA or RNA structures that bind strongly and specifically to small molecules or proteins. They can be extracted from pools of DNA or RNA molecules containing randomized sequence regions using a selection procedure known as SELEX (Systematic Evolution of Ligands by EXponential Enrichment) (1,2). Aptamers often bind their molecular targets as strongly as protein antibodies, with dissociation constants Kd typically in the nanomolar to micromolar range. In fact, given the simplicity of the selection procedure and the ease of production and modification of known structures, aptamers have become promising alternatives to antibodies in many applications. For instance, a wide range of aptamer-based sensors has been reported (3,4), and the first aptamer-based drugs (acting as inhibitors of their enzymatic targets) are on the market (5). Furthermore, aptamer-like motifs have been found to play an important gene regulatory role in bacteria, in which they act as ligand-recognition regions of riboswitches (6).
In spite of their growing importance, the molecular structure of only a few aptamers has been characterized so far. In many cases, it is not clear which of potentially several conformations of an aptamer is the active, binding form and which molecular contacts are responsible for the binding interaction itself. Depending on experimental conditions and characterization method, reported aptamer–ligand dissociation constants vary widely, and conformational kinetics are typically not studied.
Aptamer–ligand interactions are usually investigated using bulk methods such as surface plasmon resonance (4,7,8), quartz crystal microbalance experiments (4,7,9), or electrophoretic band shift assays (3). Kinetic experiments were performed using spectroscopic titration methods such as stopped flow (10,11), NMR (12,13), electron paramagnetic resonance (14), fluorescence anisotropy (15), or Förster resonance energy transfer (16).
Single-molecule studies yield additional and complementary information on molecular recognition interactions. They allow a more direct analysis of kinetics of systems with multiple states, the determination of molecular distributions, and the detection of rare events (17). Only a few single-molecule experiments have been concerned with the characterization of aptamer folding and ligand binding so far. For instance, the aptamer domain of several riboswitches was studied using single-molecule force spectroscopy with optical tweezers (18–20) or single-molecule Förster resonance energy transfer (21,22). In other studies, the well-known thrombin aptamer was investigated using optical tweezers (23) and atomic force microscopy (24,25).
An alternative single-molecule method is based on nanopore conductance studies. Nanopore experiments use the transient blockade of ionic current through a nanoscale membrane pore by molecules that are electrophoretically captured in (and potentially translocated through) the pore. For instance, DNA unzipping experiments with α-hemolysin pores exploit the fact that single-stranded DNA (ssDNA) can pass through the ≈1.4-nm-wide constriction of the pore, whereas double-stranded DNA (dsDNA) cannot (26,27). Thus, to translocate dsDNA or ssDNA with secondary structure, the molecules first have to be unfolded. This process can be facilitated by the application of a transmembrane voltage and, hence, the lifetime of the molecule in the pore becomes voltage-dependent.
In a similar manner, nanopore experiments can be used to study the interaction of DNA with other molecules if this results in a detectable change in pore residence time or conductance. This has been used to study the interaction of DNA with DNA-binding proteins such as exonuclease I (28), RecA (29), or small molecules such as intercalating dyes (30). In the context of aptamer–ligand binding, previously the ATP-binding aptamer (31) and the thrombin aptamer (32) were studied using constant voltage nanopore experiments (33–35). For the ATP aptamer, ligand-bound and -unbound states could be distinguished from current traces (34). However, no studies on binding affinity or complex stability were performed. For the thrombin aptamer, on and off rates of the complex as well as its dissociation constant were determined by attaching the aptamer to the vestibule of a mutated α-hemolysin channel and detecting current enhancement upon ligand binding (35).
We here use nanopore force spectroscopy (NFS) to study aptamers with their target molecules. NFS is a dynamic force spectroscopy technique similar to related techniques based on optical tweezers or atomic force microscopy. After capture of a DNA molecule (or other molecular complex) inside a nanopore, the voltage applied across the membrane is ramped from low to higher values. When the electric force acting on the molecule is sufficient to break its secondary structure, it unfolds and is pulled electrophoretically through the pore. In contrast to other force spectroscopy techniques, NFS experiments do not require labeling of the molecules under study to facilitate binding to atomic force microscopy tips, surfaces, or silica beads. Instead of the long linker molecules required for optical tweezers studies, a relatively short sequence extension is sufficient to facilitate the electrophoretic capture of the molecules in the pores. In addition, nanopore-based measurements potentially have a considerably higher throughput than other single-molecule techniques.
Previous experiments (36,37) have indicated that DNA hairpin and G-quadruplex structures are stabilized within the vestibule of the α-hemolysin pore. The unfolding rates determined in such experiments therefore did not represent “free solution” values. To reconcile experimental results with theoretical predictions based on standard thermodynamic parameters for DNA basepairing, we used a measurement strategy in which the molecules under study are pulled through the nanopores in reverse direction (from the trans to the cis side of the membrane) as the α-hemolysin pore interacts less with the analytes on the trans side. For simple DNA hairpin molecules, this measurement strategy resulted in a very good agreement between experimental and theoretical unfolding rates (37).
As shown in Fig. 1, and explained in more detail below, we here adopt this strategy to the study of DNA aptamer–ligand interactions. An aptamer augmented by an unstructured threading sequence and a stable stopper sequence is first captured in the pore. After translocation of the aptamer section through the pore, the structure is allowed to equilibrate on the trans side of the membrane. If ligand molecules are added to the trans solution, they can then interact with the aptamer. After a certain waiting time, the aptamer–ligand structure is pulled back to the cis side. Analysis of the resulting voltage-dependent unfolding events yields information on the stability of the aptamers, the aptamer–ligand complexes, and the distribution between ligand-bound and -unbound structures.
Figure 1.

Measurement principle. (I) A potential of 120 mV is applied to capture a DNA molecule with an aptamer structure (red) and a thread sequence (blue) on its 3' end. While the aptamer structure is unfolded on capture, a stable hairpin (green) at the 5' end prevents the DNA from traversing the pore. (II) The DNA is held inside the pore at low bias voltage (50 mV) to allow reforming of the aptamer and target binding on the trans side. (III) A voltage ramp to −200 mV is applied. When the aptamer structure unfolds, the DNA molecule escapes from the pore and a sudden increase in the current signal is observed. The corresponding unfolding voltage is recorded.
To be able to compare with previous studies, we performed experiments with two “standard” aptamers: the ATP-binding aptamer and the thrombin aptamer. We determined a dissociation constant for the ATP aptamer of Kd ≈ 119 μM in the presence of 1 M monovalent salt. Furthermore, we found increasing affinity of the aptamer to ATP, ADP, and AMP under these buffer conditions. We also were able to detect the formation of stable aptamer–ligand complexes for the thrombin aptamer. Given the stability of the G-quadruplexes and also the aptamer–ligand complex, the experiments required careful tuning of the experimental parameters, indicating that NFS is more suitable for small ligand aptamers than for strong protein binders.
Materials and Methods
Chemicals
Lipid solutions were prepared from 1,2-diphytanoyl-sn-glycero-3-phosphocholine (Avanti Polar Lipids, Alabaster, AL) dissolved in hexadecane (Sigma Aldrich, Munich, Germany) at a concentration of 10 mg/ml. The electrolyte solution contained 100 mM KCl (Merck KGaA, Darmstadt, Germany), 900 mM NaCl, 10 mM Tris, and 1 mM EDTA (Sigma Aldrich, Munich, Germany) buffered at pH 8. α-Hemolysin from Staphylococcus aureus was purchased from List Biological Laboratories (Campbell, CA). HPLC purified oligonucleotides (biomers, Ulm, Germany) were dissolved in 10 mM Tris, 1 mM EDTA solution at pH 8.
The DNA sequences used in this study were (complementary regions are underlined):
ATP aptamer (ATPapt):
5′-GGCGCCGCGGCCTTTTGGCCGCGGCGCC-(dT)50-
CCTGGGGGAGTATTGCGGAGGAAGG-(dT)30-3′
Modified ATP aptamer (ATPapt-mod):
5′-GGCGCCGCGGCCTTTTGGCCGCGGCGCC-(dT)50-
AACCTGGGGGAGTATTGCGGAGGAAGGTT-(dT)28-3′
Thrombin aptamer (Thapt):
5′-(dT)50-GGTTGGTGTGGTTGG-3′
ATP, ADP, and AMP were purchased from Sigma Aldrich (Munich, Germany). Human-α-thrombin was supplied by Hematologic Technologies (Essex Junction, VT).
Measurement setup
Experiments were performed at 23°C for the ATP aptamer or at 37°C for the thrombin-binding aptamer using a microemulsion droplet-based lipid bilayer setup as previously described in Renner et al. (38). Two droplets containing electrolyte solution, DNA, and target molecules were formed on two Ag/AgCl electrodes immersed in lipid solution. The droplets were brought into contact to form a lipid bilayer at the interface. A micropipette was used to inject α-hemolysin locally, close to the bilayer, while applying negative voltage pulses to facilitate the incorporation of a single pore. The ionic current through the pore was measured using a patch clamp amplifier (EPC9, HEKA Elektronik GmbH, Lambrecht, Germany).
The measurement principle for experiments with the ATP aptamer is depicted in Fig. 1. Translocation experiments were performed with DNA constructs of the general structure 5′- stopper-spacer-aptamer-thread-3′ (cf. sequences given above). By applying a bias voltage of +120 mV, DNA molecules were electrophoretically captured in the pore from the cis side with the help of an unstructured (dT)30 threading sequence. At this voltage, the ATP aptamer sequence is immediately unfolded and translocated through the pore to the trans side (Fig. 1 I). To prevent a complete translocation of the DNA construct, we included a stable hairpin sequence containing 12 G-C basepairs at the 5′ end as a “stopper” sequence, separated from the aptamer by a (dT)50 spacer. After detection of a successful capture event by a reduction in the trans-pore current, the DNA construct was held inside the pore at a low voltage (50 mV) to allow reformation of the aptamer structure and target binding on the trans side (Fig. 1 II). Subsequently, the voltage was ramped linearly from 50 mV to −200 mV (Fig. 1 III). Unfolding and escape of the aptamer structure to the cis side were then observed as an abrupt increase in trans-pore current, and the corresponding unfolding voltage was recorded.
Given the high stability of the G-quadruplex containing thrombin-binding aptamer, it was not possible to use an “anchor strategy” for the ATP aptamer—essentially, a voltage high enough to unfold the aptamer structure would also break the anchor sequence (see discussion below). In this case, conventional cis trans translocation experiments were performed using a (dT)50-capture sequence attached to the 5′ end of the aptamer (see Fig. S4 in the Supporting Material). For these experiments, the DNA was initially incubated with thrombin for 30 min at room temperature. After capture of an aptamer structure at 120-mV bias voltage, a fast electronic trigger circuit immediately reduced the voltage to 50 mV, followed by a voltage ramp that unfolded the aptamer on the cis side.
Data analysis
Unfolding voltage histograms were calculated from current recordings using custom Matlab routines. The fraction of bound aptamer–target complexes
was determined by fitting the data with a least squares approach to a theoretical distribution of unfolding voltages
| (1) |
where represents the unfolding voltage distribution for the free aptamers, and is the distribution for the bound complexes. Each was taken to be of the form
| (2) |
This expression was derived by Mathe et al. (39) for unfolding of DNA structures in voltage ramp experiments with a constant ramp speed . The distribution is based on the assumption of an exponential dependence of the lifetime of the structures on voltage of the form , where τ0 is the intrinsic (zero voltage) lifetime of the structure. The parameter Vβ characterizes the voltage dependence of the unfolding process and depends on the effective charge of the molecule on which the electric field can exert a force, but also on details of the unfolding landscape (39,40).
The parameters τ0,0 and Vβ,0 for the unbound population were determined in experiments without aptamer targets and then fixed for the analysis of experiments with added targets. From an average over all measurements with aptamer–target complexes, Vβ,1 was then determined to be 26.5 mV. This left τ0,1 and θ as the only remaining fit parameters in Eqs. 1 and 2 for the evaluation of the various histograms constructed from experiments with aptamer–target complexes. For [ATP] = 25 μM, the bound population was too weak to be fitted accurately with the least squares method. A maximum likelihood estimation was performed instead using the Matlab mle function and Eq. 1 (together with Eq. 2) as the theoretical probability distribution function. At [ATP]= 5 μM, no bound population was observed.
We also analyzed the data in a different way by calculating the lifetime as a function of voltage τ(V) using the conversion formula (41,42)
| (3) |
This expression essentially is the result of a variable transformation and does not rely on a specific assumption for the functional form of τ(V). Hence, in contrast to fits by Eq. 2, this procedure results in model-independent estimates of τ(V) from the data.
Results
NFS of aptamer–ATP complexes
The results obtained from NFS experiments on the ATP aptamer structure (using strand ATPapt) are shown in Fig. 2. In the absence of ATP, a single peak in the unfolding voltage histogram is observed centered around a critical unfolding voltage of mV. This is consistent with the unfolding of a very weak DNA secondary structure containing only few basepairs (37). In the presence of ATP, a second broader and more stable population appears in the histograms. At an ATP concentration of 100 μM, (maximum error estimated from repeated experiments) of all detected events belong to the more stable population. With increasing ligand concentration, this population further grows to a fraction of at 1 mM ATP. As the stable fraction is only present for finite ATP concentration and also scales with it, this population can be attributed to the unfolding of aptamer–ligand complexes. Its relative size consequently corresponds to the fraction θ of bound aptamers. As expected, no binding was observed in a control experiment in the presence of 1 mM cytidine triphosphate (Fig. S2).
Figure 2.
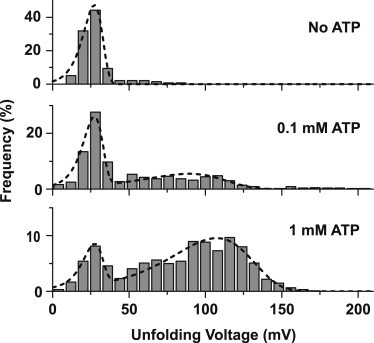
ATP aptamer unfolding at varying ATP concentrations. (a) Unfolding voltage distributions at different ATP concentrations, obtained at a loading rate of 10 V/s. With no ATP present, a single population at 27 mV is observed. On addition of ATP, a second, more stable population appears, which increases with increasing ATP concentration. This population is assigned to aptamer structures with bound ATP targets. Histograms are fitted to Eq. 2 (dashed lines) to determine the fraction of bound structures.
As shown in Fig. 3 b, as a function of ATP concentration, the bound fraction θ is accurately fit by a simple binding curve of the form
| (4) |
The fit yields a dissociation constant of Kd = 119 ± 12 μM. In previous studies, a broad range of values from 6 μM to 2000 μM was found (16,31,43–50), strongly depending on buffer conditions, the labeling strategy used, and other factors such as the presence of competitive binders. In recent work by Baaske et al. (49), using aptamers singly labeled with Cy5, a of 60 μM was found in the presence of 0.3 M Na+ and 5mM Mg2+, roughly a factor of 2 lower than our value determined at 1 M monovalent salt.
Figure 3.
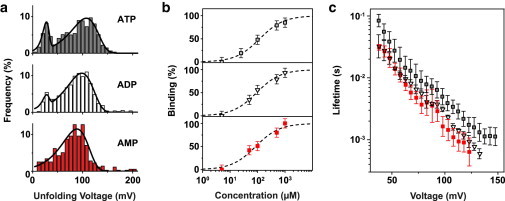
Aptamer target specificity. (a) Unfolding voltage distributions for adenosine mono-, di-, and triphosphate at a loading rate of 10 V/s. In all cases, a stable population assigned to target-bound structures is observed. Solid lines correspond to fits using Eq. 2. (b) Fraction of bound aptamer structures versus target concentration for ATP (open squares), ADP (open triangles), and AMP (filled squares). The dashed lines show fits to Eq. 4. The fit yields a dissociation constant of , , and for ATP, ADP, and AMP, respectively. (c) Voltage-dependent lifetime of aptamer–target complexes determined from measurement data according to Eq. 3. Error bars are standard deviations from 12, 4, and 6 independent measurements for ATP, ADP, and AMP, respectively.
As indicated schematically in Fig. 1, the ATP aptamer is known to bind two ATP molecules in a noncanonical, but stable helix comprised of G-G and G-A basepairs flanked by short Watson–Crick duplexes (51). We therefore tentatively also fitted a Hill curve of the form with the (microscopic) dissociation constant to our data. The fit resulted in a equaling the obtained from the “simple fit” with Eq. 4 and a Hill coefficient slightly above 1 indicating only weak cooperativity in binding. In fact, a more detailed binding model with two independent binding sites with the same yields Eq. 4 as the sum of the fractions of complexes with one or two ATP molecules bound.
To check whether the waiting time after unzipping and translocation of the aptamer (phase II in Fig. 1) was sufficient to allow for refolding of the structure and ATP binding, we varied this time in a range from 30 ms to 1 s. Our results were virtually identical for these times, suggesting that the structures had sufficiently equilibrated within milliseconds. One limiting factor is the diffusive flux of ATP molecules to the aptamer’s binding site with size a ≈ 1 nm. This may be estimated as , where D ≈ 300 μm2/s is the diffusion coefficient of ATP (52), and is its concentration. For , this results in or . For our experiments, we typically used a waiting time of 200 ms, which should be sufficient for the lowest ATP concentrations measured here. This also indicates, however, that for considerably lower target concentrations (e.g., for experiments with aptamers with lower ), waiting times have to be chosen that are correspondingly longer.
Binding to ATP versus ADP and AMP
The ATP aptamer structure is known to bind different adenosine phosphates with similar affinity (44). This can be understood by considering the NMR structure of the aptamer–ligand complex determined by Lin et al. (51), in which the adenine stacks into the aptamer’s binding site, whereas the phosphate groups are oriented outward and do not seem to directly participate in binding.
We therefore performed NFS experiments also in the presence of ADP and AMP to further assess the specificity of the ligand–aptamer interaction (Fig. 3). Although binding was observed for all three ligand molecules, there was a tendency toward higher affinity for ADP and AMP ligands, as indicated by the higher binding fractions θ at 1 mM. For ADP, we determined a θ of , whereas for AMP no unbound population was observed, suggesting a bound fraction of nearly . We found dissociation constants of 92 ± 10 μM and 85 ± 14 μM for ADP and AMP, respectively.
As described in the Methods section, the voltage-dependent lifetime of all three aptamer–target complexes was calculated from the distribution of unfolding voltages according to Eq. 3, taking into account only events assigned to the bound aptamer population. The data obtained using loading rates of 0.5 V/s, 4 V/s, 10 V/s, and 15 V/s all collapse on a single master curve (cf. Fig. S1), verifying that the measurements were performed under quasiequilibrium conditions (40). We observe slightly lower lifetimes for AMP and ADP complexes compared with those for ATP. We speculate that for the smaller and less charged AMP and ADP (with a nominal charge of −2e and −3e versus −4e for ATP), the electrostatic energy barrier for binding to the aptamer is lower and hence their binding on rate is higher than for ATP, resulting in an overall smaller of the corresponding aptamer–ligand complexes. The electrostatic barrier is expected to be affected by the presence of Mg2+, which is known to strongly interact with ATP. This is consistent with the fact that Baaske et al. (49) found a lower value for the of ATP in a Mg2+-containing buffer, and their value for the less charged AMP coincides almost exactly with ours.
It is interesting to note that the voltage dependence of the lifetime of aptamer–ligand complexes is much weaker than for ordinary DNA secondary structures such as DNA hairpins (37). In the simple model with an exponential voltage dependence of τ(V), one would expect . Hence, in this model, the slope of the τ(V) graphs in Fig. 3 represents the parameter . This may indicate that the effective charge and/or unfolding landscape of aptamer–ligand complexes considerably differs from those of hairpin structures.
An alternative interpretation is that the unfolding histograms contain unresolved subpopulations. In fact, the derivation of the conversion formula (Eq. 3) rests on the assumption that the unfolding events are caused by only a single molecular population and can be described as a first-order process (40,53). In the case of the ATP aptamer, it is likely that the histograms contain contributions from aptamers with only one of the two binding sites occupied as well as from the fully bound complex, but these could not be resolved consistently in our experiments. A superposition of these contributions can result in an artificial flattening of the τ(V) dependence.
ATP aptamers with prestructured binding site
In the context of subpopulations contained within the unfolding histograms, one has to consider that the aptamer sequence can fold into an ensemble of many different, relatively weak secondary structures. In the absence of ATP, the secondary structure containing the short Watson–Crick stem flanking the aptamer binding sites as in the structure of the aptamer–target complex (51)—with a folding free energy of merely −0.84 kcal/mol as calculated by mfold (54)—is not the most stable structure. Alternative structures with other basepairing patterns—not containing the ATP-binding site—are considerably more stable, with the most stable one having a folding free energy of ΔGfold = −3.31 μM kcal/mol (Fig. 4).
Figure 4.
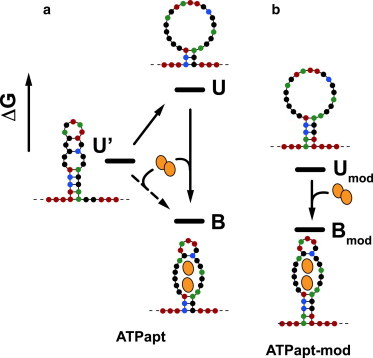
Binding pathways for the ATP aptamers ATPapt and ATPapt-mod. Bases are depicted as circles (A: green, T: red, G: black, C: blue). Black bars indicate free energies of the structures. (a) For ATPapt, to bind ATP, the secondary structure with lowest mean free energy U′ either has to unfold and rearrange to form the structure with the ATP-binding pocket U (conformational selection) or adopt its conformation on ATP binding (induced fit). (b) Binding pathway for ATPapt-mod, for which the binding-competent state is stabilized with two additional A-T basepairs at its end.
As indicated in Fig. 4 a, to bind ATP, the aptamer has to either unfold and rearrange from more stable structures to adopt a binding-competent state or somehow change conformation upon ATP binding (corresponding to an induced fit mechanism). We therefore sought to deliberately stabilize the aptamer's binding-competent conformation with a minimal modification in sequence: Insertion of two adenine bases at the 5′ end of the aptamer sequence (cf. sequence ATPapt-mod) leads to the formation of additional two basepairs at the bottom of the flanking stem (together with two thymines from the threading sequence). The corresponding secondary structure then is the minimum free energy structure of the sequence with a kcal/mol (Fig. 4). As expected, this also results in a considerably increased stability of the unbound aptamers in the NFS experiments, which leads to a shift of the critical unzipping voltage from 27 mV to 47 mV (cf. Fig. 5 a) and a corresponding shift in the voltage-dependent lifetime (cf. Fig. 5 b). The voltage-dependent unfolding time τ(V) of the ATP aptamer complexes is almost identical for both structures over the whole voltage range investigated. This indicates that for unfolding, breaking of the additional two (weak) A-T basepairs of the modified structure is not rate-determining, but rather the unstacking and destabilization of the whole structure accompanied by a release of the ATP molecules.
Figure 5.
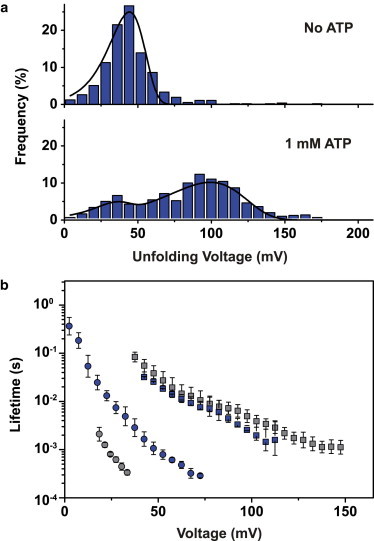
Aptamer tailoring. (a) Unfolding voltage distributions for the modified aptamer structure ATPapt-mod with and without addition of ATP at a loading rate of 10 V/s. Note the increase in critical unfolding voltage for the stabilized aptamer compared with the unmodified structure in Fig. 3. (b) Lifetime versus voltage for modified (blue) and unmodified (gray) aptamers (circles) and aptamer–target structures (squares). Error bars are standard deviations from 2 to 12 independent measurements.
For experiments performed at [ATP] mM and with a waiting time of 200 ms (phase II in Fig. 1), we also found that the binding fractions θ are very similar (89% for the modified compared with 85% for the original aptamer). The obtained dissociation constant (Fig. S3) is virtually identical to our value for the original aptamer structure. As the free energy differences of unbound and bound conformations (U′ and B for ATPapt and Umod and Bmod for ATPapt-mod) are expected to be quite similar, this finding is consistent with the assumption that the aptamers have equilibrated before the start of the unzipping ramp. Even though ATPapt has to change conformation for ATP binding, this step is not rate-limiting under our experimental conditions, which indicates that the (relatively weak) ATP aptamer structures rapidly change their conformation in the absence of ATP.
NFS with the thrombin aptamer
We also investigated the binding of a well-known protein-binding aptamer to its target using NFS: the aptamer for human α-thrombin (32,55). This aptamer differs from the ATP aptamer in several aspects: (a) the of the aptamer target complex is several orders of magnitude lower (in the nanomolar range), and (b) the secondary structure of the aptamer comprises two stacked G-quadruplexes, which themselves are extremely stable structures, even in the absence of target. This leads to a variety of experimental problems: As explained in the Methods section, given the high stability of G-quadruplexes, the hairpin stopper technique used for the ATP aptamer cannot be applied here. Furthermore, in the presence of high concentrations of quadruplex-stabilizing potassium ions (56) (as in typical buffers used for nanopore experiments), comparatively high unfolding voltages have to be applied, which are close to the maximal voltage sustained by lipid bilayer membranes (∼250 mV). This makes it hard to reliably measure binding of thrombin to the aptamer, which even further stabilizes the structure.
We therefore deliberately destabilized the aptamer structure by increasing the measurement temperature to and by reducing the potassium concentration. In supplementary studies, we initially characterized the stability of the G-quadruplex-forming aptamer structure as a function of [K+] and found a strong dependence (see Fig. S5). For thrombin-binding studies, we then used a KCl concentration of 10 mM while maintaining an overall ionic strength of 1 M through the addition of NaCl.
In the absence of thrombin, we observed a single population in the unfolding voltage histogram (Fig. 6). We also performed experiments in the presence of 2 and 3 μM thrombin. At these concentrations, a bound fraction of ∼100% is expected for a in the nanomolar range. Nevertheless, we observed an increase of the number of events at higher unfolding voltages accompanied by a shift of the most frequent unfolding voltage to a higher value and a broadening of the distribution. Theoretical considerations (see Note S7) indicate that coexisting bound and unbound populations overlap strongly and cannot be separated accurately in the experimental histograms. However, the fraction of events at higher unfolding voltages (>150 mV) still increases from 2 μM and 3 μM thrombin, indicating a larger unbound fraction than expected at such concentrations. This may be caused by a lower capture rate for the more slowly diffusing bound complexes.
Figure 6.
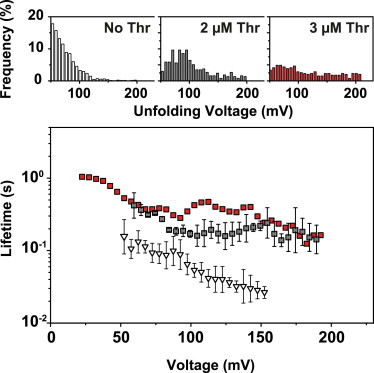
Unfolding of the thrombin aptamer. (Top panel) Typical unfolding voltage distributions without (open bars) and with (solid bars) addition of thrombin at different concentrations (gray: 2 μM, red: 3 μM). Experiments were performed at a loading rate of 0.2 V/s. (Bottom panel) Voltage-dependent lifetime of aptamer structures (open triangles) and aptamer–target complexes (solid squares, gray: 2 μM, red: 3 μM thrombin). Error bars are standard deviations from three independent measurements.
As before, we obtained the voltage-dependent lifetime of the complexes in the nanopore using the conversion formula of Eq. 4. In the voltage range considered, the thrombin complexes typically have a 10-fold longer lifetime than the aptamer structure without thrombin. This difference is actually dependent on the potassium concentration and diminishes for higher [K+] (cf. Fig. S6), which is consistent with the strong stabilization of the quadruplex structure by K+.
Discussion and Conclusions
We have demonstrated how nanopore-based force spectroscopy experiments can be performed on DNA aptamers and their target complexes. Using a dynamic voltage ramp technique (38,39), the critical unzipping voltages of the complexes can be determined, which in turn allows calculation of their (voltage-dependent) unfolding time. In backward translocation experiments, the aptamers are first translocated through an α-hemolysin nanopore from the cis to the trans side of the membrane, where they are allowed to refold and interact with their binding target for a specified time. After reversal of the voltage polarity, the aptamer–target complexes are then unzipped in trans–cis direction. As in this direction the stability of the aptamer structure is not influenced by the vestibule on the cis side of the nanopore, kinetic and stability data can be obtained that are better comparable to those determined in free-solution studies (37). This is exemplified by the fact that our experiments with the ATP aptamer yield a value in the same range as obtained with other methods.
One of the most attractive features of NFS is that, in principle, it allows the measurement of molecular unfolding rates. For instance, our experiments indicate that AMP aptamer complexes unfold slightly faster than ADP or ATP complexes, whereas the fraction of bound complexes (reflecting the association constant ) is higher for AMP than for ADP or ATP. This seems to indicate a correspondingly higher on rate for the less charged adenine nucleotides. Unfortunately, however, it is not obvious how the voltage-dependent lifetimes obtained in these experiments can be extrapolated to V in a meaningful way. At finite voltages, the lifetime characterizes the unzipping of the aptamer–ligand complex rather than the unbinding of ligand from the intact aptamer structure. Unfolding rates will also depend on the direction of the applied force and the details of the energy landscape along this direction. Nevertheless, it has been previously observed that the general stability trends obtained for DNA hairpins at finite voltages faithfully reflect their zero voltage behavior (37). Furthermore, the specific geometry of nanopore unzipping experiments may in some cases be actually quite close to the biological situation. For instance, helicases are pore-like molecular machines that unzip double-stranded DNA or RNA with secondary structure, ribosomes have to work against secondary structure present in mRNA (57), and the activity of RNA polymerases is influenced by cotranscriptional folding of RNA secondary structure (58).
In this context, it may be interesting to further explore the opportunities offered by the backward translocation protocol. In principle, it should be possible to perform pump-probe experiments by varying the time allowed for refolding or ligand-binding of the structures after the first translocation and thus capture intermediate, nonequilibrium states of the molecules under study. This is limited at short timescales by our ability to switch the translocation direction fast enough and measure the corresponding currents (i.e., by the capacitive time constant (RC– time) of the system, ∼1 ms), and at long timescales by the necessity to gain enough statistics from single-molecule events (and thus by the stability of the setup).
Other limitations of NFS become apparent when dealing with stronger secondary structures and with aptamer–target complexes with lower . In the case of the thrombin aptamer also studied in this work, already the secondary structure of the target-free aptamer—containing G-quadruplexes—is very strong. This not only prevents application of the backward translocation technique, it also requires the application of higher voltages, which reduces the stability of the lipid bilayer membrane. A related problem is that the bound and unbound aptamer fractions strongly overlap, which makes an interpretation of the data difficult. Measuring a titration curve for aptamers with low requires application of aptamer targets at correspondingly low concentrations. Slower diffusion of the aptamer–target complexes combined with low on rates for complex formation may then lead to an incorrect representation of the molecular distributions in solution in the unzipping experiments. In this case, other nanopore-based techniques for the study of aptamer–ligand interactions such as that developed in Rotem et al. (35) are more suitable. Another option might be the utilization of solid state nanopores for force spectroscopy, as for these the accessible force range is potentially higher (59).
In conclusion, although there seem to be limitations for the study of aptamer complexes with protein targets, NFS has been shown to be an attractive tool for the investigation of interactions of DNA (and potentially RNA) molecules with smaller ligands. Single-molecule nanopore experiments allow the determination of the distribution of bound and unbound complexes, dissociation constants and of voltage-dependent unfolding rates. In principle, the studies can be extended to also study transient conformations that may be relevant in nonequilibrium situations encountered in biological processes.
Acknowledgments
The authors gratefully acknowledge financial support by the Deutsche Forschungsgemeinschaft (SFB 863, Nanosystems Initiative Munich) and the Bundesministerium für Bildung und Forschung (Project 13N10970).
Supporting Material
References
- 1.Tuerk C., Gold L. Systematic evolution of ligands by exponential enrichment: RNA ligands to bacteriophage T4 DNA polymerase. Science. 1990;249:505–510. doi: 10.1126/science.2200121. [DOI] [PubMed] [Google Scholar]
- 2.Ellington A.D., Szostak J.W. In vitro selection of RNA molecules that bind specific ligands. Nature. 1990;346:818–822. doi: 10.1038/346818a0. [DOI] [PubMed] [Google Scholar]
- 3.Baldrich E., Restrepo A., O’Sullivan C.K. Aptasensor development: elucidation of critical parameters for optimal aptamer performance. Anal. Chem. 2004;76:7053–7063. doi: 10.1021/ac049258o. [DOI] [PubMed] [Google Scholar]
- 4.Song S., Wang L., Zhao J. Aptamer-based biosensors. Trends Analyt. Chem. 2008;27:108–117. [Google Scholar]
- 5.Keefe A.D., Pai S., Ellington A. Aptamers as therapeutics. Nat. Rev. Drug Discov. 2010;9:537–550. doi: 10.1038/nrd3141. [DOI] [PMC free article] [PubMed] [Google Scholar]
- 6.Tucker B.J., Breaker R.R. Riboswitches as versatile gene control elements. Curr. Opin. Struct. Biol. 2005;15:342–348. doi: 10.1016/j.sbi.2005.05.003. [DOI] [PubMed] [Google Scholar]
- 7.Tombelli S., Minunni M., Mascini M. Aptamer-based biosensors for the detection of HIV-1 Tat protein. Bioelectrochemistry. 2005;67:135–141. doi: 10.1016/j.bioelechem.2004.04.011. [DOI] [PubMed] [Google Scholar]
- 8.Wang Z., Wilkop T., Cheng Q. Surface plasmon resonance imaging for affinity analysis of aptamer–protein interactions with PDMS microfluidic chips. Anal. Bioanal. Chem. 2007;389:819–825. doi: 10.1007/s00216-007-1510-x. [DOI] [PubMed] [Google Scholar]
- 9.Hianik T., Ostatná V., Grman I. Influence of ionic strength, pH and aptamer configuration for binding affinity to thrombin. Bioelectrochemistry. 2007;70:127–133. doi: 10.1016/j.bioelechem.2006.03.012. [DOI] [PubMed] [Google Scholar]
- 10.Jucker F.M., Phillips R.M., Pardi A. Role of a heterogeneous free state in the formation of a specific RNA–theophylline complex. Biochemistry. 2003;42:2560–2567. doi: 10.1021/bi027103+. [DOI] [PubMed] [Google Scholar]
- 11.Förster U., Weigand J.E., Wachtveitl J. Conformational dynamics of the tetracycline-binding aptamer. Nucleic Acids Res. 2012;40:1807–1817. doi: 10.1093/nar/gkr835. [DOI] [PMC free article] [PubMed] [Google Scholar]
- 12.Nonin-Lecomte S., Lin C.H., Patel D.J. Additional hydrogen bonds and base-pair kinetics in the symmetrical AMP–DNA aptamer complex. Biophys. J. 2001;81:3422–3431. doi: 10.1016/S0006-3495(01)75974-7. [DOI] [PMC free article] [PubMed] [Google Scholar]
- 13.Noeske J., Buck J., Wöhnert J. Interplay of “induced fit” and preorganization in the ligand induced folding of the aptamer domain of the guanine binding riboswitch. Nucleic Acids Res. 2007;35:572–583. doi: 10.1093/nar/gkl1094. [DOI] [PMC free article] [PubMed] [Google Scholar]
- 14.Cekan P., Jonsson E.O., Sigurdsson S.T. Folding of the cocaine aptamer studied by EPR and fluorescence spectroscopies using the bifunctional spectroscopic probe Ç. Nucleic Acids Res. 2009;37:3990–3995. doi: 10.1093/nar/gkp277. [DOI] [PMC free article] [PubMed] [Google Scholar]
- 15.Gokulrangan G., Unruh J.R., Wilson G.S. DNA aptamer-based bioanalysis of IgE by fluorescence anisotropy. Anal. Chem. 2005;77:1963–1970. doi: 10.1021/ac0483926. [DOI] [PubMed] [Google Scholar]
- 16.Nakamura I., Shi A.-C., Li Y. Kinetics of signaling-DNA–aptamer–ATP binding. Phys. Rev. E Stat. Nonlin. Soft Matter Phys. 2009;79:031906. doi: 10.1103/PhysRevE.79.031906. [DOI] [PubMed] [Google Scholar]
- 17.Deniz A.A., Mukhopadhyay S., Lemke E.A. Single-molecule biophysics: at the interface of biology, physics and chemistry. J. R. Soc. Interface. 2008;5:15–45. doi: 10.1098/rsif.2007.1021. [DOI] [PMC free article] [PubMed] [Google Scholar]
- 18.Greenleaf W.J., Frieda K.L., Block S.M. Direct observation of hierarchical folding in single riboswitch aptamers. Science. 2008;319:630–633. doi: 10.1126/science.1151298. [DOI] [PMC free article] [PubMed] [Google Scholar]
- 19.Anthony P.C., Perez C.F., Block S.M. Folding energy landscape of the thiamine pyrophosphate riboswitch aptamer. Proc. Natl. Acad. Sci. USA. 2012;109:1485–1489. doi: 10.1073/pnas.1115045109. [DOI] [PMC free article] [PubMed] [Google Scholar]
- 20.Neupane K., Yu H., Woodside M.T. Single-molecule force spectroscopy of the add adenine riboswitch relates folding to regulatory mechanism. Nucleic Acids Res. 2011;39:7677–7687. doi: 10.1093/nar/gkr305. [DOI] [PMC free article] [PubMed] [Google Scholar]
- 21.Haller A., Altman R.B., Micura R. Folding and ligand recognition of the TPP riboswitch aptamer at single-molecule resolution. Proc. Natl. Acad. Sci. USA. 2013;110:4188–4193. doi: 10.1073/pnas.1218062110. [DOI] [PMC free article] [PubMed] [Google Scholar]
- 22.Fiegland L.R., Garst A.D., Nesbitt D.J. Single-molecule studies of the lysine riboswitch reveal effector-dependent conformational dynamics of the aptamer domain. Biochemistry. 2012;51:9223–9233. doi: 10.1021/bi3007753. [DOI] [PMC free article] [PubMed] [Google Scholar]
- 23.Koirala D., Dhakal S., Mao H. A single-molecule platform for investigation of interactions between G-quadruplexes and small-molecule ligands. Nat. Chem. 2011;3:782–787. doi: 10.1038/nchem.1126. [DOI] [PMC free article] [PubMed] [Google Scholar]
- 24.Lynch S., Baker H., Sinniah K. Single molecule force spectroscopy on G-quadruplex DNA. Chemistry. 2009;15:8113–8116. doi: 10.1002/chem.200901390. [DOI] [PMC free article] [PubMed] [Google Scholar]
- 25.Zhao X.-Q., Wu J., Mao B.-W. Single-molecule force spectroscopic studies on intra- and intermolecular interactions of G-quadruplex aptamer with target Shp2 protein. J. Phys. Chem. B. 2012;116:11397–11404. doi: 10.1021/jp303518b. [DOI] [PubMed] [Google Scholar]
- 26.Kasianowicz J.J., Brandin E., Deamer D.W. Characterization of individual polynucleotide molecules using a membrane channel. Proc. Natl. Acad. Sci. USA. 1996;93:13770–13773. doi: 10.1073/pnas.93.24.13770. [DOI] [PMC free article] [PubMed] [Google Scholar]
- 27.Vercoutere W., Winters-Hilt S., Akeson M. Rapid discrimination among individual DNA hairpin molecules at single-nucleotide resolution using an ion channel. Nat. Biotechnol. 2001;19:248–252. doi: 10.1038/85696. [DOI] [PubMed] [Google Scholar]
- 28.Hornblower B., Coombs A., Akeson M. Single-molecule analysis of DNA–protein complexes using nanopores. Nat. Methods. 2007;4:315–317. doi: 10.1038/nmeth1021. [DOI] [PubMed] [Google Scholar]
- 29.Smeets R.M.M., Kowalczyk S.W., Dekker C. Translocation of RecA-coated double-stranded DNA through solid-state nanopores. Nano Lett. 2009;9:3089–3096. doi: 10.1021/nl803189k. [DOI] [PubMed] [Google Scholar]
- 30.Wanunu M., Sutin J., Meller A. DNA profiling using solid-state nanopores: detection of DNA-binding molecules. Nano Lett. 2009;9:3498–3502. doi: 10.1021/nl901691v. [DOI] [PMC free article] [PubMed] [Google Scholar]
- 31.Huizenga D.E., Szostak J.W. A DNA aptamer that binds adenosine and ATP. Biochemistry. 1995;34:656–665. doi: 10.1021/bi00002a033. [DOI] [PubMed] [Google Scholar]
- 32.Bock L.C., Griffin L.C., Toole J.J. Selection of single-stranded DNA molecules that bind and inhibit human thrombin. Nature. 1992;355:564–566. doi: 10.1038/355564a0. [DOI] [PubMed] [Google Scholar]
- 33.Shim J.W., Gu L.-Q. Encapsulating a single G-quadruplex aptamer in a protein nanocavity. J. Phys. Chem. B. 2008;112:8354–8360. doi: 10.1021/jp0775911. [DOI] [PMC free article] [PubMed] [Google Scholar]
- 34.Ying Y.-L., Wang H.-Y., Long Y.-T. Monitoring of an ATP-binding aptamer and its conformational changes using an α-hemolysin nanopore. Small. 2011;7:87–94. doi: 10.1002/smll.201001428. [DOI] [PubMed] [Google Scholar]
- 35.Rotem D., Jayasinghe L., Bayley H. Protein detection by nanopores equipped with aptamers. J. Am. Chem. Soc. 2012;134:2781–2787. doi: 10.1021/ja2105653. [DOI] [PMC free article] [PubMed] [Google Scholar]
- 36.Renner S., Bessonov A., Simmel F.C. Sequence-dependent unfolding kinetics of DNA hairpins studied by nanopore force spectroscopy. J. Phys. Condens. Matter. 2010;22:454119. doi: 10.1088/0953-8984/22/45/454119. [DOI] [PubMed] [Google Scholar]
- 37.Schink S., Renner S., Gerland U. Quantitative analysis of the nanopore translocation dynamics of simple structured polynucleotides. Biophys. J. 2012;102:85–95. doi: 10.1016/j.bpj.2011.11.4011. [DOI] [PMC free article] [PubMed] [Google Scholar]
- 38.Renner S., Geltinger S., Simmel F.C. Nanopore translocation and force spectroscopy experiments in microemulsion droplets. Small. 2010;6:190–194. doi: 10.1002/smll.200901435. [DOI] [PubMed] [Google Scholar]
- 39.Mathé J., Visram H., Meller A. Nanopore unzipping of individual DNA hairpin molecules. Biophys. J. 2004;87:3205–3212. doi: 10.1529/biophysj.104.047274. [DOI] [PMC free article] [PubMed] [Google Scholar]
- 40.Dudko O.K., Mathé J., Hummer G. Extracting kinetics from single-molecule force spectroscopy: nanopore unzipping of DNA hairpins. Biophys. J. 2007;92:4188–4195. doi: 10.1529/biophysj.106.102855. [DOI] [PMC free article] [PubMed] [Google Scholar]
- 41.Raible M., Evstigneev M., Ros R. Theoretical analysis of dynamic force spectroscopy experiments on ligand-receptor complexes. J. Biotechnol. 2004;112:13–23. doi: 10.1016/j.jbiotec.2004.04.017. [DOI] [PubMed] [Google Scholar]
- 42.Dudko O.K., Hummer G., Szabo A. Theory, analysis, and interpretation of single-molecule force spectroscopy experiments. Proc. Natl. Acad. Sci. USA. 2008;105:15755–15760. doi: 10.1073/pnas.0806085105. [DOI] [PMC free article] [PubMed] [Google Scholar]
- 43.Jhaveri S.D., Kirby R., Ellington A.D. Designed signaling aptamers that transduce molecular recognition to changes in fluorescence intensity. J. Am. Chem. Soc. 2000;122:2469–2473. [Google Scholar]
- 44.Nutiu R., Li Y. Structure-switching signaling aptamers. J. Am. Chem. Soc. 2003;125:4771–4778. doi: 10.1021/ja028962o. [DOI] [PubMed] [Google Scholar]
- 45.Nutiu R., Li Y. Structure-switching signaling aptamers: transducing molecular recognition into fluorescence signaling. Chemistry. 2004;10:1868–1876. doi: 10.1002/chem.200305470. [DOI] [PubMed] [Google Scholar]
- 46.Wang Y., Liu B. ATP detection using a label-free DNA aptamer and a cationic tetrahedralfluorene. Analyst (Lond.) 2008;133:1593–1598. doi: 10.1039/b806908e. [DOI] [PubMed] [Google Scholar]
- 47.Wang Y., Wang Y., Liu B. Fluorescent detection of ATP based on signaling DNA aptamer attached silica nanoparticles. Nanotechnology. 2008;19:415605. doi: 10.1088/0957-4484/19/41/415605. [DOI] [PubMed] [Google Scholar]
- 48.Hu J., Easley C.J. A simple and rapid approach for measurement of dissociation constants of DNA aptamers against proteins and small molecules via automated microchip electrophoresis. Analyst. 2011;136:3461–3468. doi: 10.1039/c0an00842g. [DOI] [PubMed] [Google Scholar]
- 49.Baaske P., Wienken C.J., Braun D. Optical thermophoresis for quantifying the buffer dependence of aptamer binding. Angew. Chem. Int. Ed. Engl. 2010;49:2238–2241. doi: 10.1002/anie.200903998. [DOI] [PubMed] [Google Scholar]
- 50.Trevino S.G., Zhang N., Szostak J.W. Evolution of functional nucleic acids in the presence of nonheritable backbone heterogeneity. Proc. Natl. Acad. Sci. USA. 2011;108:13492–13497. doi: 10.1073/pnas.1107113108. [DOI] [PMC free article] [PubMed] [Google Scholar]
- 51.Lin C.H., Patel D.J. Structural basis of DNA folding and recognition in an AMP–DNA aptamer complex: distinct architectures but common recognition motifs for DNA and RNA aptamers complexed to AMP. Chem. Biol. 1997;4:817–832. doi: 10.1016/s1074-5521(97)90115-0. [DOI] [PubMed] [Google Scholar]
- 52.Hubley M.J., Locke B.R., Moerland T.S. The effects of temperature, pH, and magnesium on the diffusion coefficient of ATP in solutions of physiological ionic strength. Biochim. Biophys. Acta. 1996;1291:115–121. doi: 10.1016/0304-4165(96)00053-0. [DOI] [PubMed] [Google Scholar]
- 53.Dudko O.K., Hummer G., Szabo A. Intrinsic rates and activation free energies from single-molecule pulling experiments. Phys. Rev. Lett. 2006;96:108101. doi: 10.1103/PhysRevLett.96.108101. [DOI] [PubMed] [Google Scholar]
- 54.Zuker M. Mfold web server for nucleic acid folding and hybridization prediction. Nucleic Acids Res. 2003;31:3406–3415. doi: 10.1093/nar/gkg595. [DOI] [PMC free article] [PubMed] [Google Scholar]
- 55.Padmanabhan K., Tulinsky A. An ambiguous structure of a DNA 15-mer thrombin complex. Acta Crystallogr. D Biol. Crystallogr. 1996;52:272–282. doi: 10.1107/S0907444995013977. [DOI] [PubMed] [Google Scholar]
- 56.Kumar N., Maiti S. Quadruplex to Watson–Crick duplex transition of the thrombin binding aptamer: a fluorescence resonance energy transfer study. Biochem. Biophys. Res. Commun. 2004;319:759–767. doi: 10.1016/j.bbrc.2004.05.052. [DOI] [PubMed] [Google Scholar]
- 57.Kozak M. Regulation of translation via mRNA structure in prokaryotes and eukaryotes. Gene. 2005;361:13–37. doi: 10.1016/j.gene.2005.06.037. [DOI] [PubMed] [Google Scholar]
- 58.Pan T., Sosnick T. RNA folding during transcription. Annu. Rev. Biophys. Biomol. Struct. 2006;35:161–175. doi: 10.1146/annurev.biophys.35.040405.102053. [DOI] [PubMed] [Google Scholar]
- 59.Tabard-Cossa V., Wiggin M., Marziali A. Single-molecule bonds characterized by solid-state nanopore force spectroscopy. ACS Nano. 2009;3:3009–3014. doi: 10.1021/nn900713a. [DOI] [PMC free article] [PubMed] [Google Scholar]
Associated Data
This section collects any data citations, data availability statements, or supplementary materials included in this article.