Abstract
Motion artifacts are a significant source of noise in many functional near-infrared spectroscopy (fNIRS) experiments. Despite this, there is no well-established method for their removal. Instead, functional trials of fNIRS data containing a motion artifact are often rejected completely. However, in most experimental circumstances the number of trials is limited, and multiple motion artifacts are common, particularly in challenging populations. Many methods have been proposed recently to correct for motion artifacts, including principle component analysis, spline interpolation, Kalman filtering, wavelet filtering and correlation-based signal improvement. The performance of different techniques has been often compared in simulations, but only rarely has it been assessed on real functional data. Here, we compare the performance of these motion correction techniques on real functional data acquired during a cognitive task, which required the participant to speak aloud, leading to a low-frequency, low-amplitude motion artifact that is correlated with the hemodynamic response. To compare the efficacy of these methods, objective metrics related to the physiology of the hemodynamic response have been derived. Our results show that it is always better to correct for motion artifacts than reject trials, and that wavelet filtering is the most effective approach to correcting this type of artifact, reducing the area under the curve where the artifact is present in 93% of the cases. Our results therefore support previous studies that have shown wavelet filtering to be the most promising and powerful technique for the correction of motion artifacts in fNIRS data. The analyses performed here can serve as a guide for others to objectively test the impact of different motion correction algorithms and therefore select the most appropriate for the analysis of their own fNIRS experiment.
Keywords: functional near-infrared spectroscopy, fNIRS, motion artifact, hemodynamic response, motion correction
1. Introduction
Functional near-infrared spectroscopy (fNIRS) is a non-invasive neuroimaging technique, which uses light in the near-infrared range to infer cerebral activity. From the changes in intensity of light directed from a source fiber into he tissues of the head and back-scattered to a detector fiber positioned several centimeters from the source, concentration changes of oxy-hemoglobin (HbO) and deoxy-hemoglobin (HbR) can be computed (Boas et al., 2002; Jöbsis, 1977). fNIRS is becoming more and more common in the study of infants (Lloyd-Fox et al., 2010; Taga et al., 2011; Wilcox et al., 2010), cognition (Cutini et al., 2012a; Köchel et al., 2011; Tupak et al., 2012), motor tasks (Brigadoi et al., 2012; Perrey, 2008) and in studies with difficult and hard-to-test populations, e.g. stroke patients (Lin et al., 2012; Muehlschlegel et al., 2009; Obrig and Steinbrink, 2011). Although the improvement in fNIRS technology has been significant in recent years, effectively coupling the sources and the detectors to the head can be problematic and motion artifacts are often a significant component of the measured fNIRS signal. Indeed, every movement of the head causes a decoupling between the source/detector fiber and the scalp, which is reflected in the measured signal, usually as a high-frequency spike and a shift from the baseline intensity. In order to properly estimate the hemodynamic response function (HRF), motion artifacts should be detected and removed.
A common and simple way to solve the issue of motion artifacts is to reject all trials where a motion artifact has been detected. However, this approach is only suitable if the number of motion artifacts detected is low and the number of trials is high, otherwise the risk is that too few trials will be accepted, resulting in a very noisy hemodynamic response. fNIRS is particularly suited for examining challenging populations (e.g. infants, clinical patients, children) who might not be easily investigated with fMRI. However, in these populations the number of functional trials is almost always strictly limited, and therefore trial rejection might not be feasible.
Several methods have been proposed to solve this issue. Some methods require a complementary measure of the motion artifact to aid in its removal, e.g. with a short-separation fNIRS channel (Robertson et al., 2010), or with an accelerometer (Virtanen et al., 2011). Others rely on the inherent changes in the amplitude and frequency of the data due to the artifact and act as post-processing techniques. The latter group does not require a complementary measure and thus can be used with every experimental paradigm, making it the most general solution. Among these approaches are Principal Component Analysis (PCA) (Zhang et al., 2005), Kalman filtering (Izzetoglu et al., 2010), correlation-based signal improvement (CBSI) (Cui et al., 2010), wavelet filtering (Molavi and Dumont, 2012) and spline interpolation (Scholkmann et al., 2010).
Motion artifacts can have different shapes, frequency content and timing. They can be high amplitude, high frequency spikes, easily detectable in the data-series or they can have lower frequency content and be harder to distinguish from normal hemodynamic fNIRS signals. Motion artifacts can be generally classified into three categories, spikes, baseline shifts and low-frequency variations. They can be isolated events or they can be temporally correlated with the HRF. Therefore, it is likely that the efficacy of each motion artifact correction technique will vary with the type of motion artifact and that the best technique to apply is data-dependent. One way to estimate the performance of a motion correction technique or to compare different techniques is to simulate motion artifacts (Scholkmann et al., 2010) or to ask participants to move their head purposely to create a motion artifact (Izzetoglu et al., 2010; Robertson et al., 2010). However, real motion artifacts are complex and variable, and thus difficult to simulate. Furthermore, motion artifacts are not only due to the movement of the head, but also due to the movement of the eyebrows or the jaw, for example. The most suitable approach to quantifying the performance of different motion artifact correction techniques is to use real, resting-state fNIRS data, which are contaminated with real motion artifacts, and add a simulated HRF to these data (Cooper et al., 2012). Knowing the true hemodynamic response, it is possible to compute the MSE (Mean-Squared Error) and the Pearson's Correlation Coefficient (R2) between the simulated and the recovered HRF, and hence to have a quantitative measure to compare the different performances.
The next step towards establishing a standard approach for the correction of motion artifacts in fNIRS data is to compare the performance of multiple motion correction approaches on real cognitive data. To that end, the aim of this paper is to compare the performance of five motion correction techniques: PCA, spline interpolation, wavelet filtering, Kalman filtering and CBSI, on real data acquired during a cognitive linguistic paradigm. This data-series has been specifically chosen because it contains a particular type of motion artifact, a task-related, low frequency artifact with amplitude comparable with that of the HRF. These characteristics make artifact detection and correction especially challenging. In most cases to date, motion correction techniques have been tested, with great success, on high frequency spike artifacts occurring randomly throughout the data-series, but their ability to isolate and correct artifacts which more closely resemble normal physiological fNIRS signals has not been assessed. As the true HRF in these data is unknown, we use parameters related to a physiologically plausible HRF to compare the performance of each motion correction technique. We also compare the performance of each correction technique with the results obtained by rejecting all trials where a motion artifact was detected and the results obtained by simply including all trials and ignoring the motion artifact altogether.
2. Materials and Methods
2.1 fNIRS data
Twenty-two students of the University of Padova (10 males, mean age 25.54 ± 3.14) took part in the experiment, after providing written informed consent. The data of one participant was discarded because she was unable to correctly perform the task, while the data of three others was discarded because of poor SNR in every channel (likely due to a large mass of hair). Therefore, the total number of participants considered in the following analysis is 18. Each participant was comfortably seated in front of an LCD computer monitor at a viewing distance of approximately 60 cm in a dimly lit room. The paradigm consisted of a color-naming of a non-color word task; the participant was asked to say aloud the color of the text of a word appearing on the screen. The study consisted of 4 different stimulus conditions, with 40 trials per condition presented to the participants, leading to a total of 160 trials, divided into two sets of 80. Each word was presented on the screen until the subject started to pronounce the color of the word (~850 ms). The inter-stimulus interval varied among 10, 11 or 12 seconds. The experiment was approved by the ethical committee of the University of Padova.
The fNIRS data was acquired with a multi-channel, frequency-domain NIR spectrometer (ISS Imagent™, Champaign, Illinois) equipped with 32 laser diodes (16 emitting light at 690 nm and 16 at 830 nm) and 4 photo-multiplier tubes. Source and detector fibers were positioned on the participants’ head using a probe-placement method based on a physical model of the head surface (Cutini et al., 2011) so that frontal and premotor areas were sampled (Fig.1a) (for more details on the positions of sources and detectors see Cutini et al. (2008)). Each source fiber carried light at both of the two different wavelengths; five source fibers were placed around each detector fiber, at a distance of 3 cm. Therefore, a total of 20 channels per wavelength (10 per hemisphere) were measured for each participant. The sampling frequency was set to approximately 7.8 Hz.
Fig.1.
a) Probe placement: detectors in blue and sources in yellow. Numbers represent the channels. b) Example of motion artifacts present in the time-series of one participant. The blue line shows the 830 nm wavelength time-series, the red line the 690 nm wavelength time-series. The 690 nm time-series has been shifted by -0.3 for visualization purposes. Vertical lines indicate when the stimulus is presented to the participant. Note how the motion artifact is correlated to the task.
The data acquired during this experiment contained a particular type of motion artifact, which was caused by the participants’ jaw movement induced by the vocal response. The opening and closing of the mouth caused an abrupt displacement of the sources and detectors positioned on the participant's head, thus producing a motion artifact in the data series that was correlated with the evoked cerebral response (present in the first 1-2 seconds after stimulus onset). The shape and duration of this artifact (Fig.1b) differs from the more common spike-like artifacts because it is slower and correlated with the hemodynamic response. Given that its amplitude is comparable to the hemodynamic response elicited by cortical activity, the artifact is more difficult to detect.
It is also important to note that not all participants and all channels presented this type of artifact; participants with less hair tended to have the fiber holder placed more tightly to the head and hence this type of artifact was less common. The artifact was also channel-specific, appearing more commonly in the most anterior channels (see Fig.1a). The fact that the motion artifact is not observed on all channels simultaneously is likely to affect the performance of the motion artifact correction, since some methods inherently require unwanted signal components to be apparent in multiple channels. While this hypothesis may be reasonable in many cases, as motion artifacts are often due to movement of the whole head, this is not the case for this data series. Therefore, it is likely that the correction methods which work on a channel-by-channel basis will perform better than those that work on all channels all together. Below we describe the motion correction techniques compared in the present work.
2.2 Motion correction techniques
2.2.1 Spline interpolation
The spline interpolation method employed here is a channel-by-channel approach, based on that proposed by Scholkmann et al. (2010). It acts only on motion artifacts detected, leaving the remaining part of the signal unmodified. Motion artifact segments are automatically identified on a channel-by-channel basis (using the function hmrMotionArtifactByChannel from the Homer2 NIRS Processing package (Huppert et al., 2009), as detailed below in Section 2.3). The period of motion artifact is then modeled via a cubic spline interpolation. The resulting spline interpolation is then subtracted from the original signal, to correct for the motion artifact. The time series must then be reconstructed as the spline subtraction creates different signal levels for the corrected signal compared to the original signal. Every segment is shifted by a value given by the combination of the mean value of the segment and the mean value of the previous segment to ensure a continuous signal. For a more detailed description of the method, see Scholkmann et al. (2010). The spline interpolation depends on a parameter, p, which determines the degree of the spline function. If p=0, the interpolation will be a straight line, while if p=1, it will be a cubic interpolation. In this study the parameter p was set to 0.99, the same value used by both Scholkmann et al. (2010) and Cooper et al. (2012).
A drawback of the spline approach is that it needs to be preceded by a reliable technique that identifies the motion artifacts. If the artifacts are difficult to detect, spline interpolation will not be applied appropriately and thus the technique will not improve the signal. However, an advantage of the spline approach is the ability to remove baseline shifts.
2.2.2 Principal Component Analysis (PCA)
Principal component analysis (PCA) applies an orthogonal transformation to the original data set composed of N measurements to produce N uncorrelated components. The order of these components is related to the variance of the original data that the component accounts for. Thus, the first component will account for the largest proportion of the variance of the data. Since motion artifacts are often much larger in amplitude that normal physiological fNIRS signals, they should constitute a large proportion of the variance of the data; thus, it is supposed that the first M components will represent the variance caused by the motion artifacts. Hence, removing the first M components from the signal should correct for the motion artifacts (Zhang at al, 2005).
The performance of PCA is directly dependent on the number of measurements available (N) and the number of components removed (M). In this study N was equal to 40, the number of channels. The number M is a free parameter of PCA analysis. A way to automatically adjust this value on a subject-by-subject basis is to set the amount of variance to be removed from the data. The sensitivity analysis performed by Cooper et al. (2012) suggested that 97% of the total variance should be removed to optimize the performance of PCA. This value was obtained for 20 data sets in which the motion artifacts had generally a larger amplitude compared to the evoked hemodynamic response. Since in the present data set motion artifacts have an amplitude similar to the cerebral signal, it is likely that removing 97% of the total variance will remove also part of the evoked response. Therefore, in this study the PCA was performed with two different values of threshold on the variance: 97% (which will be referred as PCA_97) and 80% (referred as PCA_80). The value of 80% was chosen to be more conservative and remove only the variance supposed to account for the motion artifacts and it is very close to the value already used by Wilcox et al. (2005). The choice to run PCA with both values is motivated by the possibility of showing the importance of properly choosing the value of M for each data group.
2.2.3 Wavelet filtering
The wavelet-based motion artifact removal proposed by Molavi and Dumont (2012) is a channel-by-channel approach designed to correct for motion artifacts. The Wavelab 850 toolbox (www-stat.stanford.edu/~wavelab) for MATLAB was used here to perform the wavelet analysis. The Daubechies 5 (db5) wavelet was chosen, the same used by Molavi and Dumont (2012). The discrete wavelet transform is applied to every channel data series for a number of levels of decomposition, L, given by the duration of the time series. For every level a series of detail and approximation coefficients are obtained. Assuming that the measured signal is a linear combination of the physiological signal of interest and the artifacts, that the detail wavelet coefficients have a Gaussian probability distribution and that the hemodynamic response is smoother and slower than motion artifacts, the expectation is that the coefficients accounting for the evoked response will be centered around zero and with low variance, while the outliers of the Gaussian distribution are the coefficients accounting for the motion artifacts. Therefore, setting these outlying coefficients to zero before reconstructing the signal with the inverse discrete wavelet transform should remove the corresponding motion artifacts in the temporal time-series. Outliers are detected using a probability threshold α: if the probability of a given wavelet detail coefficient is less than α, then this coefficient is assumed to not belong to the Gaussian distribution and it is hence considered an outlier and set to zero.
The parameter α is the tuning parameter of wavelet filtering. In this study it was set to 0.1, the same value used by Cooper et al. (2012) and by Molavi and Dumont (2012).
2.2.4 Discrete Kalman filter
The discrete Kalman filtering proposed by Izzetoglu et al. (2010) is also a channel-by-channel approach. The Kalman filter acts on a state-space representation of a dynamic system to provide, recursively, a solution to the linear optimal filtering problem. The Kalman filter is a two-step filter: firstly, at time=tk, a prediction of the state x at time=tk+1 and of its uncertainty is computed, using knowledge on prior states. Then, when the measured signal at time=tk+1 comes, it is used to update and correct the predicted state xk+1, which is then used again in the prediction of the next state (for more information on the Kalman filter theory see Grewal and Andrews, 2001; Haykin, 2001).
To use the Kalman filter for motion correction, the transition matrix, which uses prior knowledge on the states to predict the future one, has been chosen as an autoregressive model of order M=4 (Cooper et al., 2012; Izzetoglu et al., 2010). The coefficients of the model are determined using the Yule-Walker equations, computing the correlation between the longest motion-free period of the signal and itself translated by between 1 to M data-points. A model order higher than M = 4 tends to render the algorithm unstable. In order to model the signal over the frequency range we are interested in (i.e. less than 1 Hz), these 4 datapoints must cover a longer period of data than is covered by 4 datapoints at the sampling frequency of 7.8 Hz. It is therefore necessary to downsample the data as part of the Kalman filter correction procedure. The output measurement of the Kalman filter has been assumed as the motion-corrupted signal, while the state x as the motion-free one and the measurement noise as the motion artifact. The covariance of the measurement noise has been computed as the variance of the whole data-series, while the covariance of the process noise as the variance of the motion-free segments. Motion-free segments were identified as parts of the signal where the Homer2 function hmrMotionArtifact did not find any artifacts.
2.2.5 Correlation-based signal improvement (CBSI)
The correlation-based signal improvement (CBSI) is a channel-by-channel approach developed by Cui at al. (2010) to reduce motion artifacts caused by the movement of the head. It is based on the hypothesis that HbO and HbR should be negatively correlated during functional activation but they become more positively correlated when a motion artifact occurs. The measured HbO and HbR signal, x and y respectively, can be described as:
where x0 and y0 are the true HbO and HbR signal to be estimated, F is the motion artifact, with identical effects on both chromophores (but for a constant weighting α), and Noise is the remaining high frequency white noise, easily removed with a low-pass filter. To compute x0 and y0, two assumptions are required: the correlation between x0 and y0 should be close to -1 and the correlation between the artifact F and the true signal x0 should be close to 0. This leads to the following equations for the computation of the true HbO and HbR signal:
with
where std(x) is the standard deviation of x. The approach taken by Cui et al. (2010), also assumes that the ratio between HbO and HbR when no artifact is present is the same as when an artifact occurs.
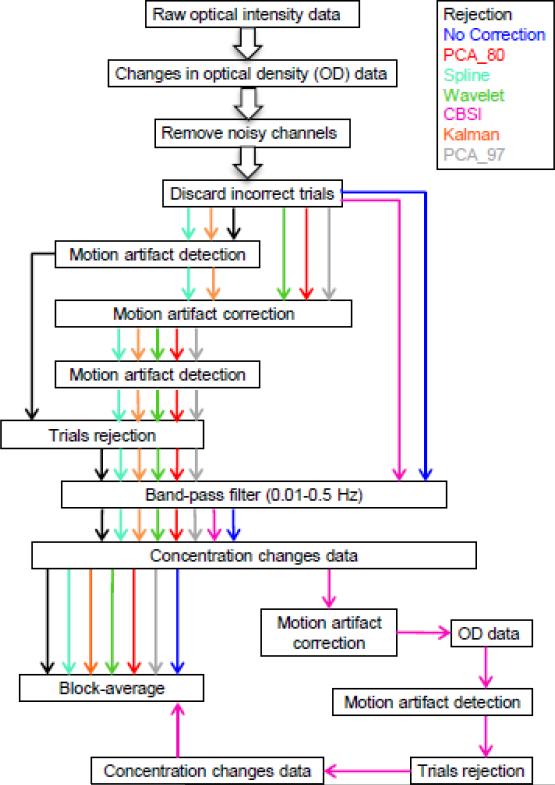
2.3 Data Processing
The data processing was performed using some of the Homer2 NIRS processing package functions (Huppert et al., 2009) based in MATLAB (Mathworks, MA USA). A flow-chart depicting the signal processing steps is presented in Fig.2. For every subject, the raw optical intensity data series were converted into changes in optical density (OD). Channels with a very low optical intensity where discarded from the analysis using the function enPruneChannels. All trials where the participant gave a wrong response to the stimulus were also discarded from the analysis. Then the motion detection algorithm hmrMotionArtifact was applied to the OD time-series to identify motion artifacts. This algorithm finds the data-points exceeding a threshold in change of amplitude (AMPthresh) and a threshold in change of standard deviation (SDThresh) within a given period of time (tMotion) and then marks those points from the beginning of the window to tMask seconds later as motion. Both the thresholds, the window length and tMask, are set by the user. In this study, AMPThresh = 0.4, SDThresh = 50, tMotion = 1 and tMask = 1, which provided a compromise between the number of motion artifacts identified in noisier data series and the number identified in less noisy data series. The function hmrMotionArtifact assumes that when an artifact is identified in one channel, that period of data should be removed from all channels and hence, the output of this algorithm is not channel specific. Thus, for the spline technique, the function used to detect motion artifacts was instead hmrMotionArtifactByChannel, which works exactly the same way as hmrMotionArtifact but on a channel-by-channel basis.
Fig.2.
Signal processing steps for all techniques. The processing streams for every technique are represented by colored arrows: black for rejection, blue for no motion correction, red for PCA_80, cyan for Spline, green for Wavelet, magenta for CBSI, orange for Kalman filter and grey for PCA_97.
After motion artifact identification, 8 different processing streams were performed. Six of these processing streams included a motion correction method, one applied the trial rejection technique and one recovered the evoked response without removing or correcting the motion artifacts.
Of the 6 processing streams including a motion correction method, 5 (PCA_80, PCA_97, Spline, Wavelet, Kalman filter) started with the application of the motion correction technique on the OD data. hmrMotionArtifact was run again on the corrected OD time series and the trials where a motion artifact was still present were rejected.
A band-pass filter (third order Butterworth filter) with cut-off frequencies of 0.01-0.5 Hz was then applied to the data in order to reduce very slow drifts and high frequency noise. The OD data were then converted into concentration changes using the modified Beer-Lambert law (Cope and Delpy, 1988; Delpy et al., 1988). Finally, to recover the mean hemodynamic response, all remaining trials related to the same stimulus type were block-averaged. This produced four mean HRFs, one per stimulus type, for each channel and each participant.
The 6th processing stream was different, since the CBSI method works on concentration changes and not on OD data. Therefore, the same band-pass filter was applied to the OD data series, which were then converted into concentration changes. The CBSI method was then applied and the mean HRF was recovered via block-averaging the motion corrected trials. Before block-averaging, trials still contaminated by a motion artifact were rejected, using the hmrMotionArtifact on the OD time-series after the CBSI correction.
In the processing streams for the rejection method and the no motion correction method, the same band-pass filter was applied to the OD data, which were then converted into concentration changes. For the no motion correction method the mean HRF was recovered by block-averaging the trials related to the same stimulus type, while for the rejection method, before computing the mean HRF, all trials where a motion artifact was detected were rejected.
2.4 Metrics for comparison
In order to compare quantitatively the performance of the different motion correction techniques, five metrics were defined. Since the true hemodynamic response is unknown, these metrics were chosen in order to provide measures of how physiologically plausible the HRFs are. The hemodynamic response function observed by fNIRS is relatively well understood and well documented (Huppert et al., 2006; Plichta et al., 2007). Although its scale and duration are variable, certain features of the HRF are essentially stable. For instance, the increase in localized cerebral blood flow that gives rise to the HRF is known to take 1-2 seconds to become apparent after the onset of stimulation.
Because in this particular data series the most common motion artifact was present in the first two seconds after the presentation of the stimulus, the first metric we define is the area under the curve computed on the mean HRF for the first two seconds after stimulus onset (AUC0-2). We assume that the lower this index, the better the correction of the artifact.
The second metric we computed is the ratio between the area under the curve (AUC ratio) of the mean hemodynamic response between 2 and 4 seconds (AUC2-4) and AUC0-2. This assumes that the hemodynamic response will reach its maximum between 2 and 4 seconds after the onset of the stimulus.
The third metric we define is the mean of the standard deviation of the single-trial (i.e. un-averaged) hemodynamic responses used in the computation of the mean hemodynamic response. We refer to this as the within-subject standard deviation (SD), and it should take into account the variability present in every subject. We assume, as a first approximation, that the variability between hemodynamic responses is predominantly due to motion artifacts, while the physiological variability between them plays a minor role (and should be ideally constant among the techniques). Our dataset provides 1440 values (18 subjects, 20 channels, 4 conditions) of each of these three metrics (AUC0-2, AUC ratio and within-subject SD).
The fourth metric we computed is the standard deviation between subjects for a given channel and condition, referred to as between-subject SD. This index considers the variability present between subjects. The total number of values obtained is 80 (20 channels and 4 conditions).
Finally, the fifth metric is the number of trials averaged for every subject and condition in order to compute the mean HRF. Every channel has the same number of trials block-averaged, because, after correction, when a motion artifact was identified, the trials related were removed from every channel. For this last metric a total of 72 values was obtained (18 subjects and 4 conditions).
In the results that follow, all motion correction techniques were compared to the no motion correction approach and to each other using these 5 metrics.
3. Results
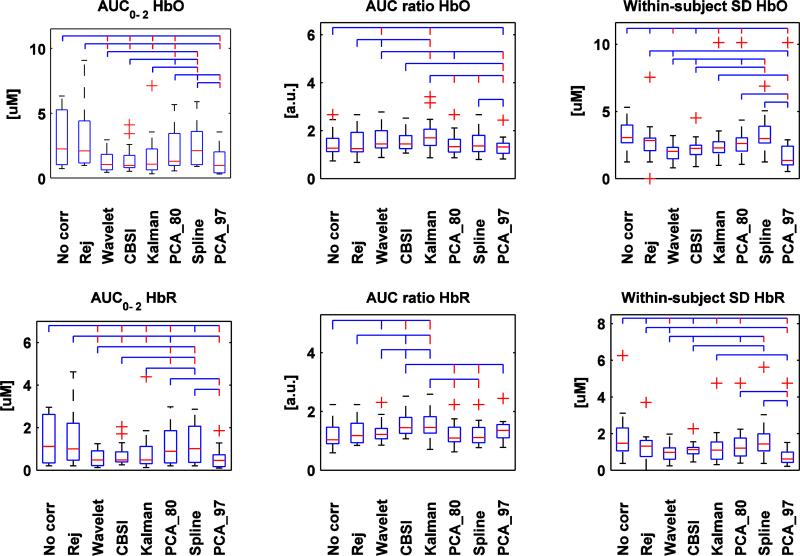
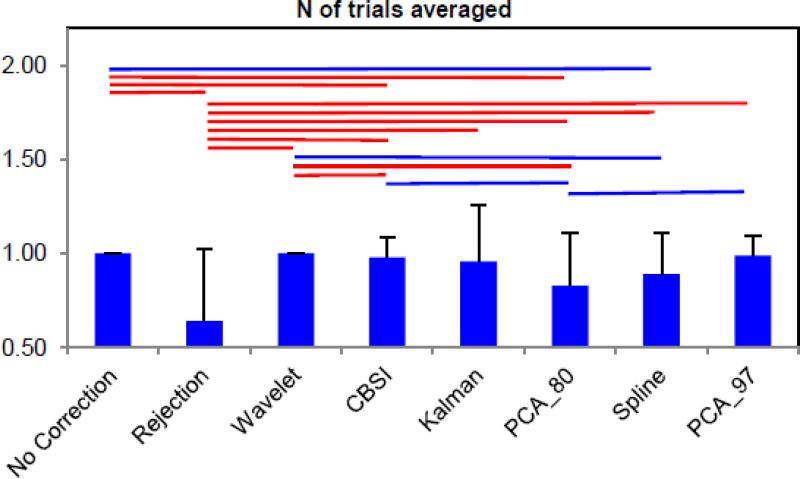
A summary of the results of the metrics AUC0-2, AUC ratio and within-subject SD computed for all techniques, for both HbO and HbR, are reported in Fig.3. Fig.4 shows the mean number of trials averaged to obtain the final HRF with every technique, normalized to the mean number of trials averaged with the no motion correction technique. A repeated measure ANOVA with technique as a within-subject factor has been computed for all these metrics. Every subject was represented by a unique value for every technique, obtained by averaging all values of the subject across channels and conditions. A main effect of technique has been found for all the metrics (all p<.01). Two-tail paired t-tests were then performed to compare all the techniques to each other using these metrics. Results are reported in Fig.3 and Fig. 4.
Fig.3.
Box plots of the AUC0-2, AUC ratio and within-subject SD computed for all techniques and for both HbO (upper row) and HbR (bottom row). The red line in the box plot indicates the median, while the two extremities of the box plot represent the first and third quartile. Red crosses indicate outliers. The lines above linking the different techniques represent the significant statistical difference (p<.05 if the line is blue, p<.01 if the line is red).
Fig.4.
Bar plots with the mean number of trials averaged for each technique normalized to the mean number of trials averaged with the no motion correction technique; the error bars represents the standard deviation. The lines above indicate whether the techniques that they link together differ significantly from each other (p<.05 if blue, p<.01 if red).
The pattern of results for HbO and HbR are consistent. For AUC0-2, no correction, rejection and spline interpolation present the highest values and the highest standard deviations; the other techniques present lower values, with Wavelet, CBSI, Kalman and PCA_97 showing less variability.
The CBSI and Kalman techniques produce the highest AUC ratio, followed by Wavelet. For this metric, no correction and rejection exhibit the worst performance.
Wavelet and PCA_97 perform very well in reducing the within-subject SD, while no correction and Spline yield the highest standard deviation. Wavelet is the only technique able to recover all trials (Fig. 4). The worst performing technique for this metric is obviously rejection; about 40% of the trials have been rejected due to motion artifacts.
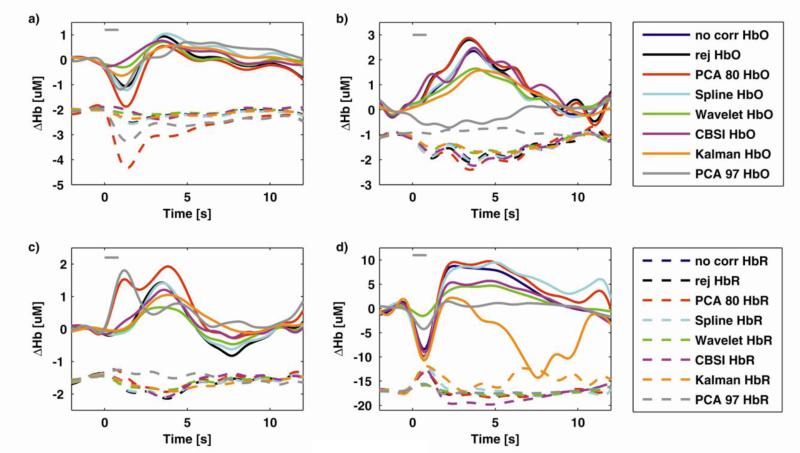
In Fig.5 four examples of the recovered HRF for all techniques are displayed.
Fig.5.
Examples of recovered mean HRFs for four selected subjects, channels and tasks for every technique for both HbO (solid line) and HbR (dashed line). HbR HRFs have been shifted in baseline towards negative values for visualization purposes only. In a) Wavelet, and CBSI provide some minimization of the motion artifact, while PCA_80 increases it. In b) all techniques but PCA_97 are able to recover physiological HRFs, no motion correction included; PCA_97 highly underestimates the HRF. c) is an example of PCA_80 and PCA_97 adding a motion artifact in a motion-free channel and d) is an example of a channel in one subject where the Kalman filter is unstable. Gray line represents the actual task duration, 850 ms, which is the grand average of the reaction times, i.e. the time needed by participants between the appearance of the word and the color being pronounced.
3.1 Rejection vs. no motion correction
Scatter plots of the AUC0-2 computed on the mean HRFs recovered via rejection (y axis) and no motion correction (x axis) are shown in Fig.6a,b for both HbO and HbR. Performance of no correction and trial rejection are comparable for both HbO and HbR. In one third of cases, trial rejection decreases AUC0-2, suggesting that it is at least partially successful in removing the motion artifact. In another ~third of cases however, rejection increases AUC0-2, compared to not rejecting the trials. In the final third of cases no motion artifacts have been identified and therefore the two techniques give the same results. No statistically significant differences have been found between the two techniques for this metric (paired t-tests: p=.475 for HbO and p=.358 for HbR).
Fig.6.
a) and b) Scatter plots of the AUC0-2 metric computed with the rejection technique (y axis) vs. that computed with no motion correction technique (x axis) for both HbO (a) and HbR (b). Trial rejection decreases AUC0-2 36% of the time for HbO and 37% for HbR, but increases it in almost the same percentage of cases. 28% of the times the AUC0-2 value is identical for both techniques. c) and d) Scatter plots of the within-subject SD metric computed with the rejection technique (y axis) vs. that computed with no motion correction technique (x axis) for both HbO (c) and HbR (d). Trial rejection decreases the standard deviation 54% of the time for HbO and 51% for HbR compared to no motion correction.
The same conclusions can be drawn for the AUC ratio metric (data not shown). No statistically significant differences have been found between the two techniques (paired t-test: p=.487 for HbO and marginally significant p=.072 for HbR) for this metric. It is clear how rejecting trials is characterized by a variable efficacy.
For the between-subject SD metric, the rejection method performs worse than the no motion correction one, increasing the standard deviation among the subjects’ mean HRF (65% of the time for HbO and 60% for HbR). This is probably due to the very noisy mean HRFs obtained from those subjects where many trials have been rejected.
The rejection method, instead, performs better than the no motion correction technique in the within-subject SD metric (Fig. 6c,d). Statistically significant differences have been found between the two techniques (paired t-tests: p<.05 for both HbO and HbR). Indeed, the cases where a lot of trials have been rejected have very low influence on the performance of this index. It shows how rejecting trials where a motion artifact had been detected is effective in reducing the standard deviation between trials in the same subject.
3.2 Motion correction techniques vs. no motion correction
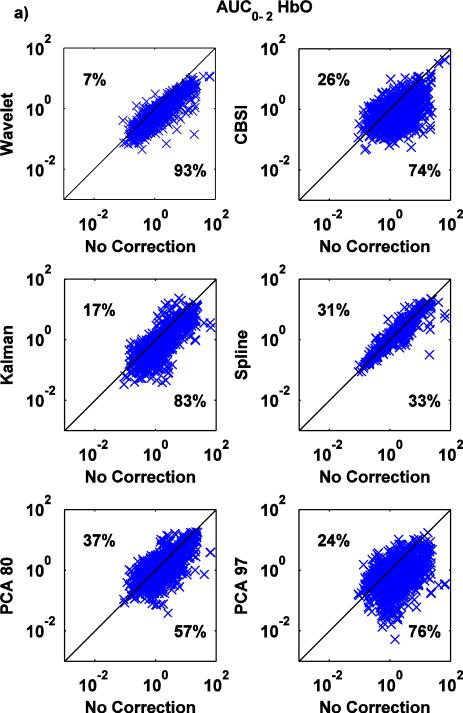
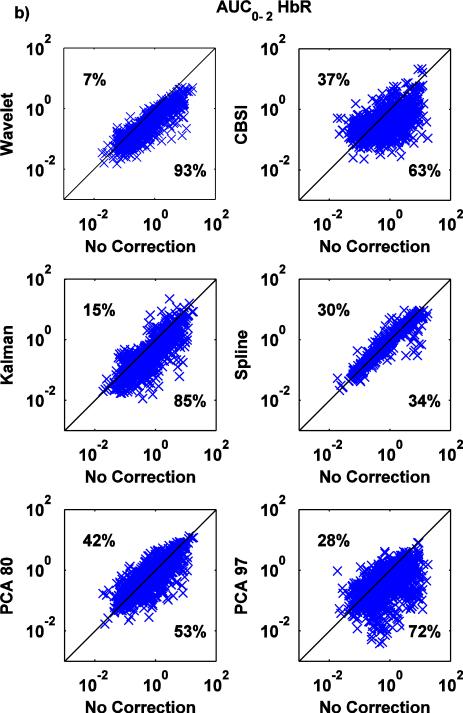
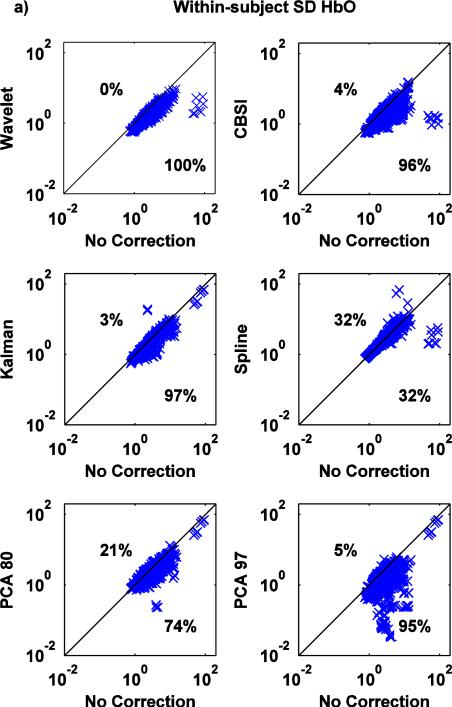
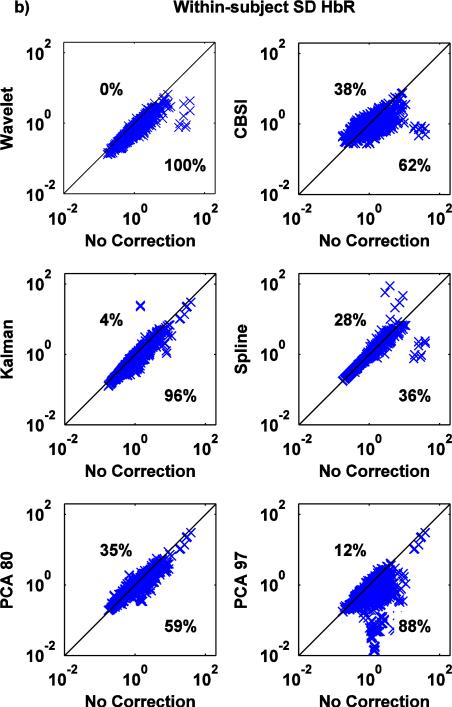
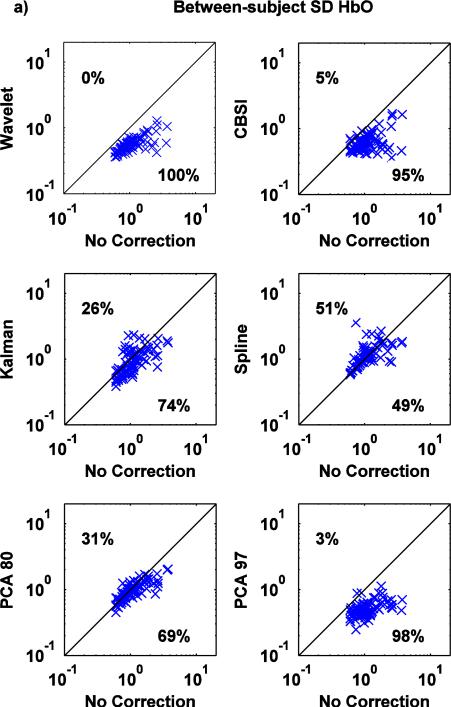
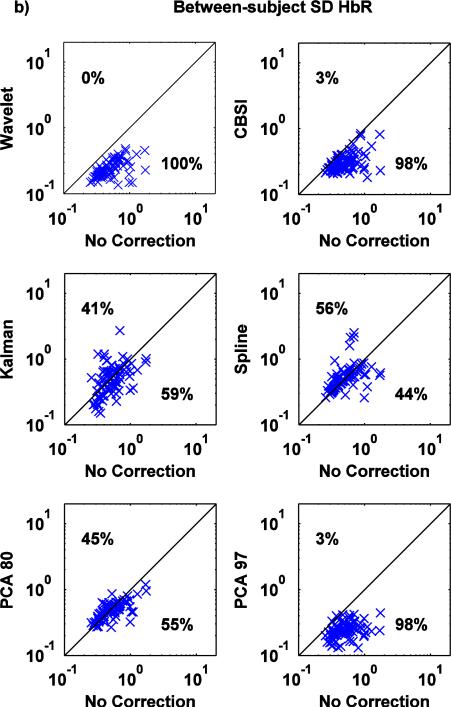
Scatter plots of AUC0-2, between-subject SD and within-subject SD values computed on the mean HRFs recovered via the no motion correction method (x axis) and all the other techniques (y axis) are shown in Fig.7, Fig.8, Fig.9 for both HbO and HbR.
Fig.7.
a,b: Scatter-plots of the AUC0-2 metric for both HbO (a) and HbR (b): no correction (x axis) vs. Wavelet, CBSI, Kalman, Spline, PCA_80 and PCA_97 (y axis).
Fig.8.
a,b: Scatter-plots of the within-subject SD metric for both HbO (a) and HbR (b): no correction (x axis) vs. Wavelet, CBSI, Kalman, Spline, PCA_80 and PCA_97 (y axis).
Fig.9.
a,b: Scatter-plots of the between-subject SD metric for both HbO (a) and HbR (b): no correction (x axis) vs. Wavelet, CBSI, Kalman, Spline, PCA_80 and PCA_97 (y axis).
The wavelet technique is the most effective at reducing AUC0-2 (Fig.7a,b), with a tendency to have a slightly detrimental effect (7% of the times) when the value of AUC0-2 is already low when no motion correction technique is applied. Kalman, CBSI and PCA_97 also perform well, reducing AUC0-2 compared to the no motion correction method (83, 74, 76% of the cases for HbO and 85, 63 and 72% for HbR), although the variability is higher compared to Wavelet. The PCA_80 approach performs slightly worse, increasing the area under the curve in 37% and 42% of cases for HbO and HbR, respectively. All these changes achieve statistical significance (all p<.01). The spline technique has little effect; marginally significant differences have been found between Spline and no motion correction for HbO, while significant differences have been found for HbR (paired t-tests: p=.091 for HbO while p<.05 for HbR).
The Kalman filter is the most efficient technique in increasing the AUC ratio, followed by Wavelet and CBSI (statistically significant differences, all p<.05, but CBSI in the HbO case p=.162). There is a high percentage of cases where these techniques decrease the AUC ratio, compared to no motion correction. Possibly, the amplitude of the HRF in the 2-4 seconds window is driven by the motion artifact leading to a bigger AUC ratio than when the artifact is removed. Both Spline and PCA_80 have no statistically significant differences with the no motion correction technique (paired t-tests: p=.510 and p=.307 for PCA_80 HbO and HbR respectively, p=.434 and p=.247 for Spline HbO and HbR respectively). PCA_97 obtains the worst result, performing significantly worse than the no motion correction technique in the HbO case (paired t-test: p<.05), while marginally significant differences have been found for HbR (paired t-test: p=.069).
Except Spline, all techniques significantly reduce the within-subject SD (Fig.8a,b) (paired t-tests: all p<.05, Spline: p=.372 for HbO and p=.720 for HbR,). Crucially, the wavelet technique is able to reduce the standard deviation in 100% of cases.
The between-subject SD metric (Fig. 9a,b) shows the same pattern of results as the previously described metric, with Wavelet outperforming the other techniques and Spline performing poorly.
4. Discussion
Several comparisons of motion correction techniques have been performed using simulated data, but little is known about their performance on real data. It is thus important to study their behavior in a real situation. The methods chosen for comparison are motion correction approaches that do not require any additional measurements. The metrics used here for comparative purposes aim to quantify whether the technique is able to recover physiological hemodynamic responses. The AUC0-2 and AUC ratio metrics are very specific to this set of data, but since the aim of the study is to compare the techniques in their ability to correct for this particular type of low-frequency, task-related motion artifact, we believe that these metrics are the most informative.
The first result of note relates to the use of trial rejection. Our data shows that the rejection technique will sometimes provide an improvement compared to no correction for motion artifacts, although it might sometime deteriorate the results. The no motion correction technique and the rejection technique are highly dependent on the number of motion artifacts present in the data and on the number of trials available for averaging. If few motion artifacts are present in the data and the related trials are removed, the rejection technique can improve the recovery of the HRF. For instance, the cases where the AUC0-2 metric is increased to a very high value compared to no motion correction are cases where a large proportion of trials had been removed. The number of trials rejected is subject-dependent: there are some subjects where no trials were discarded and others where almost all have been rejected. The mean number of trials removed per subject is about 40% the number of total trials (160).
Furthermore, we suspect that the number of trials containing motion artifacts is even higher, since due to its particular shape and frequency, the artifact present in this data-series was not always properly detected.
An efficient motion correction technique should be applicable in cases where the number of motion artifacts is high and in cases where it is low. The good results achieved by the rejection technique in the within-subject SD metric are probably due to the fact that the cases where most of the trials are discarded have less influence on this parameter. This is mirrored in the between-subject SD metric, where rejection performs worse than no correction: in this case, the noisier mean HRFs recovered with very few trials have greater influence on the total result. In conclusion, the rejection approach is not appropriate for this data set. It can only be used with good results when the number of artifacts is small compared to the number of trials.
Spline interpolation has been shown to achieve very good results in previous publications (Cooper et al., 2012; Scholkmann et al., 2010). However, this is not the case for this study. It shows little improvement compared to the no motion correction technique, both in the metrics we define and in the shape of the recovered hemodynamic response. The reason why Spline is not working well on this data set is due to its dependence on the method of artifact detection. As previously stated, the main motion artifact present in this data-set is difficult to detect because it has an amplitude and frequency content that are not dissimilar from physiologically components present in the fNIRS signals. As a result, there are likely to be many occasions where spline interpolation is not applied when it should be, leading to the same results as the no motion correction technique. It is likely that spline interpolation would have achieved better results if this motion artifact could have been more easily identified or a new and more efficient motion detection technique had been implemented.
Cooper et al. (2012) showed that PCA performed better than no motion correction, but at the same time, it was outperformed by the other techniques. The same result is apparent here. In this study, PCA was run with two different targets for the percentage of variance to be removed: 80% and 97%.
Although all metrics but one suggest that PCA_97 is successful in removing motion artifacts, the mean HRFs themselves show that PCA_97 is simply removing the HRF itself. In this data-set not every subject exhibited motion artifacts and not every motion artifact was present in every channel. PCA orders components by how well they explain the data; hence, if there are a lot of large amplitude artifacts, the first principal components will account for those artifacts. In the data studied here, removing 97% of the variance means removing not only motion artifacts but also part of the recovered HRFs and other physiological aspects of the signal. PCA run with 80% of the variance removed (PCA_80), instead, achieves the same pattern of results that Cooper et al. (2012) found in their paper: it is able to recover a significant number of trials and to significantly reduce AUC0-2 and the standard deviation metrics compared to no motion correction. However, the improvements are negligible compared to those of the other techniques.
An important problem with PCA is that it is a multi-channel approach: it requires that an artifact is present in multiple channels. Clearly this is not always true, particularly for artifacts arising from movement of the facial muscles, which can be quite localized. This is likely the cause of its poor performance. Another problem with PCA applied to this data set is that its most basic assumption (that the components of the signal are independent) is likely to be violated. The motion artifact present in this data is temporally correlated with the HRF, and therefore clearly not independent. The violation of this assumption may also contribute to the poor performance of PCA.
The different results achieved with the two different percentages of variance removed highlight the importance of choosing the correct value for this parameter. The ideal value is clearly data-dependent. An objective method to estimate the best percentage of variance to choose could potentially be developed and would make PCA much more applicable across a variety of data sets. PCA seems indeed more suited for eliminating systemic oscillations (Cutini el al., 2012b; Virtanen et al., 2009).
The discrete Kalman filtering approach is the best performing technique in the AUC ratio metric and performs very well in the AUC0-2 and the within-subject SD. However, from Fig.3, it can be noted that the variability in the AUC0-2 metric, for example, is very large. This is reflected in the fact that the poorest performance of the Kalman filter compared to the other techniques is in the between-subject SD metric (Fig.9). By inspecting the recovered HRFs, it is clear that the Kalman filter is able to recover physiologically plausible hemodynamic responses in most of the subjects. However, in about 5 subjects out of 18, the filter is unstable and the corrected signal is corrupted by noise (Fig.5d). It is worth restating that the Kalman filter requires, as does Spline, the identification of artifacts prior to its application, which may also limit its success. However, it is clear that the stability of the Kalman filter approach has to be improved in order for it to become an accepted motion correction technique.
Wavelet filtering is the only technique able to recover all possible trials. It is the best performing technique in the reduction of both the standard deviation metrics, reducing it in 100% of cases compared to that of no motion correction. It is the best performing approach also in the AUC0-2 metric, reducing it in 93% of cases. Wavelet filtering does not rely on any motion detection algorithm and it performs the best for almost every metric computed. This result is significant because the wavelet approach was designed and (to date) mostly applied to correct for high frequency spike-like artifacts, while the motion artifact present in this data-set is of a completely different form. Our results therefore suggest that the wavelet approach can work very well with different forms of motion artifacts, even those that are relatively subtle. The main drawback of the wavelet approach is its high computational cost and the possibility that it underestimates the HRF. It is likely that some wavelet coefficients associated with the HRF are set to 0, because, being that the motion artifact has a frequency near that of the hemodynamic response, the coefficients belonging to the two entities are not clearly distinct. Nevertheless, improvements in the probabilistic method used to detect wavelet coefficients related to the motion artifacts might be a suitable way to further improve this technique and bypass such drawback.
The correlation-based signal improvement technique shows a good performance in all metrics, reducing both the standard deviations and the AUC0-2 parameter. However, it relies on some assumptions that are not always met. Most importantly, it assumes that HbO and HbR are always positively correlated during an artifact and that the ratio of HbO to HbR is constant, maintaining the same value also when the artifact occurs. A failure to meet these hypotheses is likely to detrimentally affect the performance of the CBSI method. A further drawback of the CBSI technique is the fact that it recovers the HbR HRF signal from that of the HbO HRF signal, such that they differ only by a constant negative value. This implies that the HbR hemodynamic response recovered is not linked to the real data acquired and there are many cases, particularly in the study of cerebral pathology, where such a rigid relation is likely to be breached (Obrig and Steinbrink, 2011).
For the type of motion artifact studied here, most of the tested correction techniques achieve good results, even if they are outperformed by wavelet filtering. Previous studies have also shown that while wavelet filtering is, on average, the best technique for motion artifact correction (Cooper et al., 2012; Molavi and Dumont, 2012), other techniques can perform better for particular fNIRS datasets (Izzetoglu et al., 2010; Scholkmann et al., 2010). Until a single, universally effective motion artifact correction method is finalized, the best approach for fNIRS analysis may be to use an objective approach to select the most appropriate technique specifically for each set of data. This can be performed using the methods outlined in this paper. The two standard deviation metrics we have proposed, as well as the final number of trials recovered, can be used as objective metrics to test the performance of different motion correction approaches on different groups of data and thus select the most appropriate technique for its analysis. It is only after many different data-sets with different types of motion artifacts have been analyzed and compared using different motion correction techniques, that a universal approach can be identified and accepted.
5. Conclusion
Motion artifact correction is an essential step in the fNIRS data processing pipeline. All tested techniques produce an improvement in the metrics computed compared to not correcting for motion artifacts. However, the performance of spline interpolation and of PCA seems to be variable depending on the data set used. We recommend using them only when motion artifacts can be easily detected for the former and when motion artifacts are the principal source of variance for the latter. The CBSI method is able to reduce the type of artifact observed here, but it relies on stringent assumptions on the relation between HbO and HbR that are not always met. The Kalman filter is able to reduce motion artifacts, but can be unstable. The wavelet filter is the most effective method of removing the low-frequency, low-amplitude, HRF-correlated artifacts present in these data. Given this result and that of previous studies, we believe that wavelet filtering, with some improvements, has the potential to become a standard method for correction of motion artifacts in fNIRS data.
HIGHLIGHTS.
A comparison of motion artifact correction techniques on real cognitive data has been performed
Motion artifact correction is a fundamental step in the fNIRS signal processing pipeline
Wavelet filtering is a very promising and powerful tool for motion artifact correction
Acknowledgment
This work is supported by NIH grant P41-RR14075 to David A. Boas.
Footnotes
Publisher's Disclaimer: This is a PDF file of an unedited manuscript that has been accepted for publication. As a service to our customers we are providing this early version of the manuscript. The manuscript will undergo copyediting, typesetting, and review of the resulting proof before it is published in its final citable form. Please note that during the production process errors may be discovered which could affect the content, and all legal disclaimers that apply to the journal pertain.
References
- Boas DA, Franceschini MA, Dunn AK, Strangman G. Noninvasive Imaging of Cerebral Activation with Diffuse Optical Tomography. In: Frostig RD, editor. In Vivo Optical Imaging of Brain Function. CRC Press; 2002. pp. 193–221. [PubMed] [Google Scholar]
- Brigadoi S, Cutini S, Scarpa F, Scatturin P, Dell'Acqua R. Exploring the role of primary and supplementary motor areas in simple motor tasks with fNIRS. Cogn. Process. 2012;13(Suppl. 1):S97–101. doi: 10.1007/s10339-012-0446-z. [DOI] [PubMed] [Google Scholar]
- Cooper RJ, Selb J, Gagnon L, Phillip D, Schytz HW, Iversen HK, Ashina M, Boas DA. A systematic comparison of motion artifact correction techniques for functional near-infrared spectroscopy. Front. Neurosci. 2012;6:147. doi: 10.3389/fnins.2012.00147. [DOI] [PMC free article] [PubMed] [Google Scholar]
- Cope M, Delpy DT. System for long-term measurement of cerebral blood and tissue oxygenation on newborn infants by near infra-red transillumination. Med. Biol. Eng. Comput. 1988;26(3):289–294. doi: 10.1007/BF02447083. [DOI] [PubMed] [Google Scholar]
- Cui X, Bray S, Reiss AL. Functional near infrared spectroscopy (NIRS) signal improvement based on negative correlation between oxygenated and deoxygenated hemoglobin dynamics. Neuroimage. 2010;49(4):3039–3046. doi: 10.1016/j.neuroimage.2009.11.050. [DOI] [PMC free article] [PubMed] [Google Scholar]
- Cutini S, Scatturin P, Menon E, Bisiacchi PS, Gamberini L, Zorzi M, Dell'Acqua R. Selective activation of the superior frontal gyrus in task-switching: an event-related fNIRS study. Neuroimage. 2008;42(2):945–955. doi: 10.1016/j.neuroimage.2008.05.013. [DOI] [PubMed] [Google Scholar]
- Cutini S, Scatturin P, Zorzi M. A new method based on ICBM152 head surface for probe placement in multichannel fNIRS. Neuroimage. 2011;54(2):919–927. doi: 10.1016/j.neuroimage.2010.09.030. [DOI] [PubMed] [Google Scholar]
- Cutini S, Basso Moro S, Bisconti S. Functional near infrared optical imaging in cognitive neuroscience: an introductory review. J. Near Infrared Spectrosc. 2012a;20(1):75–92. [Google Scholar]
- Cutini S, Scarpa F, Scatturin P, Dell'Acqua R, Zorzi M. Number-Space Interactions in the Human Parietal Cortex: Enlightening the SNARC Effect with Functional Near-Infrared Spectroscopy. Cerebral Cortex. 2012b doi: 10.1093/cercor/bhs321. in press. [DOI] [PubMed] [Google Scholar]
- Delpy DT, Cope M, van der Zee P, Arridge S, Wray S, Wyatt J. Estimation of optical pathlength through tissue from direct time of flight measurement. Phys. Med. Biol. 1988;33(12):1433–1442. doi: 10.1088/0031-9155/33/12/008. [DOI] [PubMed] [Google Scholar]
- Grewal MS, Andrews AP. Kalman Filtering: Theory and Practice Using MATLAB. Second Edition John Wiley & Sons; New York: 2001. [Google Scholar]
- Haykin S. Kalman filtering and neural networks. John Wiley & Sons; New York: 2001. [Google Scholar]
- Huppert TJ, Hoge RD, Diamond SG, Franceschini MA, Boas DA. A temporal comparison of BOLD, ASL and NIRS hemodynamic responses to motor stimuli in adult humans. Neuroimage. 2006;29(2):368–382. doi: 10.1016/j.neuroimage.2005.08.065. [DOI] [PMC free article] [PubMed] [Google Scholar]
- Huppert TJ, Diamond SG, Franceschini MA, Boas DA. HomER: a review of time-series analysis methods for near-infrared spectroscopy of the brain. Appl. Opt. 2009;48(10):D280–D298. doi: 10.1364/ao.48.00d280. [DOI] [PMC free article] [PubMed] [Google Scholar]
- Izzetoglu M, Chitrapu P, Bunce S, Onaral B. Motion artifact cancellation in NIR spectroscopy using discrete Kalman filtering. Biomed. Eng. Online. 2010:9–16. doi: 10.1186/1475-925X-9-16. [DOI] [PMC free article] [PubMed] [Google Scholar]
- Jöbsis FF. Noninvasive, infrared monitoring of cerebral and myocardial oxygen sufficiency and circulatory parameters. Science. 1977;198(4323):1264–1267. doi: 10.1126/science.929199. [DOI] [PubMed] [Google Scholar]
- Köchel A, Plichta MM, Schäfer A, Leutgeb V, Scharmüller W, Fallgatter AJ, Schienle A. Affective perception and imagery: A NIRS study. Int. J. Psychophysiol. 2011;80(3):192–197. doi: 10.1016/j.ijpsycho.2011.03.006. [DOI] [PubMed] [Google Scholar]
- Lin PY, Chen JJ, Lin SI. The cortical control of cycling exercise in stroke patients: An fNIRS study. Hum. Brain Mapp. 2012 doi: 10.1002/hbm.22072. in press. [DOI] [PMC free article] [PubMed] [Google Scholar]
- Lloyd-Fox S, Blasi A, Elwell CE. Illuminating the developing brain: the past, present and future of functional near infrared spectroscopy. Neurosci. Biobehav. Rev. 2010;34(3):269–284. doi: 10.1016/j.neubiorev.2009.07.008. [DOI] [PubMed] [Google Scholar]
- Molavi B, Dumont GA. Wavelet-based motion artifact removal for functional near-infrared spectroscopy. Physiol. Meas. 2012;33(2):259–270. doi: 10.1088/0967-3334/33/2/259. [DOI] [PubMed] [Google Scholar]
- Muehlschlegel S, Selb J, Patel M, Diamond SG, Franceschini MA, Sorensen AG, Boas DA, Schwamm LH. Feasibility of NIRS in the neurointensive care unit: a pilot study in stroke using physiological oscillations. Neurocrit. Care. 2009;11(2):288–295. doi: 10.1007/s12028-009-9254-4. [DOI] [PMC free article] [PubMed] [Google Scholar]
- Obrig H, Steinbrink J. Non-invasive optical imaging of stroke. Philos. Transact. A. Math. Phys. Eng. Sci. 2011;1955;369:4470–4494. doi: 10.1098/rsta.2011.0252. [DOI] [PubMed] [Google Scholar]
- Perrey S. Non-invasive NIR spectroscopy of human brain function during exercise. Methods. 2008;45:289–299. doi: 10.1016/j.ymeth.2008.04.005. [DOI] [PubMed] [Google Scholar]
- Plichta MM, Heinzel S, Ehlis AC, Pauli P, Fallgatter AJ. Model-based analysis of rapid event-related functional near-infrared spectroscopy (NIRS) data: a parametric validation study. Neuroimage. 2007;35(2):625–634. doi: 10.1016/j.neuroimage.2006.11.028. [DOI] [PubMed] [Google Scholar]
- Robertson FC, Douglas TS, Meintjes EM. Motion artifact removal for functional near infrared spectroscopy: a comparison of methods. IEEE Trans. Biomed. Eng. 2010;57(6):1377–1387. doi: 10.1109/TBME.2009.2038667. [DOI] [PubMed] [Google Scholar]
- Scholkmann F, Spichtig S, Muehlemann T, Wolf M. How to detect and reduce movement artifacts in near-infrared imaging using moving standard deviation and spline interpolation. Physiol. Meas. 2010;31(5):649–662. doi: 10.1088/0967-3334/31/5/004. [DOI] [PubMed] [Google Scholar]
- Taga G, Watanabe H, Homae F. Spatiotemporal properties of cortical haemodynamic response to auditory stimuli in sleeping infants revealed by multi-channel near-infrared spectroscopy. Philos. Transact. A. Math. Phys. Eng. Sci. 2011;1955;369:4495–4511. doi: 10.1098/rsta.2011.0238. [DOI] [PubMed] [Google Scholar]
- Tupak SV, Badewien M, Dresler T, Hahn T, Ernst LH, Herrmann MJ, Fallgatter AJ, Ehlis AC. Differential prefrontal and frontotemporal oxygenation patterns during phonemic and semantic verbal fluency. Neuropsychologia. 2012;50(7):1565–1569. doi: 10.1016/j.neuropsychologia.2012.03.009. [DOI] [PubMed] [Google Scholar]
- Virtanen J, Noponen T, Meriläinen P. Comparison of principal and independent component analysis in removing extracerebral interference from near-infrared spectroscopy signals. J. Biomed. Opt. 2009;14(5):054032. doi: 10.1117/1.3253323. [DOI] [PubMed] [Google Scholar]
- Virtanen J, Noponen T, Kotilahti K, Virtanen J, Ilmoniemi RJ. Accelerometer-based method for correcting signal baseline changes caused by motion artifacts in medical near-infrared spectroscopy. J. Biomed. Opt. 2011;16(8):087005. doi: 10.1117/1.3606576. [DOI] [PubMed] [Google Scholar]
- Wilcox T, Bortfeld H, Woods R, Wruck E, Boas DA. Using near-infrared spectroscopy to assess neural activation during object processing in infants. J. Biomed. Opt. 2005;10(1):11010. doi: 10.1117/1.1852551. [DOI] [PMC free article] [PubMed] [Google Scholar]
- Wilcox T, Haslup JA, Boas DA. Dissociation of processing of featural and spatiotemporal information in the infant cortex. Neuroimage. 2010;53(4):1256–1263. doi: 10.1016/j.neuroimage.2010.06.064. [DOI] [PMC free article] [PubMed] [Google Scholar]
- Zhang Y, Brooks DH, Franceschini MA, Boas DA. Eigenvector-based spatial filtering for reduction of physiological interference in diffuse optical imaging. J. Biomed. Opt. 2005;10(1):11014. doi: 10.1117/1.1852552. [DOI] [PubMed] [Google Scholar]


