

Abstract
Dicopper(II) and dizinc(II) complexes [Cu2(MeOOCLCOO)(CH3COO)2] (1) and [Zn2(MeOOCLCOO)(CH3COO)2] (2) were synthesized by reaction of Cu(CH3COO)2·H2O and Zn(CH3COO)2·2H2O with a new nonsymmetric dinucleating ligand EtOOCHLCOOEt prepared by condensation of 6-hydrazinyl-11H-indolo[3,2-c]quinoline with diethyl-2,2′-((3-formyl-2-hydroxy-5-methylbenzyl)azanediyl)diacetate. The design and synthesis of this elaborate ligand was performed with the aim of increasing the aqueous solubility of indolo[3,2-c]quinolines, known as biologically active compounds, and investigating the antiproliferative activity in human cancer cell lines and the cellular distribution by exploring the intrinsic fluorescence of the indoloquinoline scaffold. The compounds have been comprehensively characterized by elemental analysis, spectroscopic methods (IR, UV–vis, 1H and 13C NMR spectroscopy), ESI mass spectrometry, magnetic susceptibility measurements, and UV–vis complex formation studies (for 1) as well as by X-ray crystallography (1 and 2). The antiproliferative activity of EtOOCHLCOOEt, 1, and 2 was determined by the MTT assay in three human cancer cell lines, namely, A549 (nonsmall cell lung carcinoma), CH1 (ovarian carcinoma), and SW480 (colon adenocarcinoma), yielding IC50 values in the micromolar concentration range and showing dependence on the cell line. The effect of metal coordination on cytotoxicity of EtOOCHLCOOEt is also discussed. The subcellular distribution of EtOOCHLCOOEt and 2 was investigated by fluorescence microscopy, revealing similar localization for both compounds in cytoplasmic structures.
Short abstract
Dicopper(II) and dizinc(II) complexes [Cu2(MeOOCLCOO)(CH3COO)2] (1) and [Zn2(MeOOCLCOO)(CH3COO)2] (2) were synthesized by reaction of Cu(CH3COO)2·H2O and Zn(CH3COO)2·2H2O with a new nonsymmetric dinucleating ligand EtOOCHLCOOEt prepared by condensation of 6-hydrazinyl-11H-indolo[3,2-c]quinoline with diethyl-2,2′-((3-formyl-2-hydroxy-5-methylbenzyl)azanediyl)diacetate.
Introduction
Cancer is a disease that is difficult to treat, and novel drugs are still highly demanded.1−3 Synthesis of metal complexes with biologically active ligands is a promising approach in developing anticancer drugs, as metal ions can significantly alter the physical and biological properties of these ligands.4−7 Indolo[3,2-d]benzazepines, also referred to as paullones, are one class of potential cyclin-dependent kinase (Cdk) inhibitors, identified in a comparative database search at the National Cancer Institute (NCI; NCI60 screen). Thereby, the lead compound kenpaullone exhibited an activity profile similar to that of flavopiridol,8,9 the first clinically studied Cdk inhibitor. Within a series of paullones, however, the antiproliferative activity did not parallel the Cdk inhibitory potencies.10 As a result, other intracellular targets for this class of compounds, e.g., glycogen synthase kinase 3β (Gsk3β) or mitochondrial malate dehydrogenase (mMDH), have been suggested.11 Despite marked efforts to develop these compounds as anticancer drugs, paullones remain at an early preclinical stage mainly because of their low aqueous solubility and bioavailability. Metal coordination was suggested as a means to overcome these problems. However, the original paullones did not contain suitable binding sites for metal ions, and these had to be introduced by chemical modification. A library of paullone-based ligands with a broad structural diversity and the respective complexes with copper(II), gallium(III), ruthenium(II), and osmium(II) have been reported.12−16
In an effort to elucidate novel structure–activity relationships (SARs), the folded seven-membered azepine ring of paullones has been replaced by a pyridine ring, leading to another class of biologically active compounds, namely, indolo[3,2-c]quinolines, with an essentially planar structure. Indolo[3,2-c]quinolines and the structurally related indolo[3,2-b]quinolines are known phytochemicals found in the roots of the West African climbing shrub Cryptolepis sanguinolenta that is used in traditional African medicine. Both exhibit a broad spectrum of biological properties, including antibacterial, antitumor, as well as anti-inflammatory activity.17 In contrast to indolo[3,2-b]quinolines, few studies have addressed indolo[3,2-c]quinolines. Like paullones, indoloquinolines do not contain binding sites for metal ions. They can, however, be introduced with synthetic tools essentially different from those applied for paullones. The first ruthenium(II), osmium(II), and copper(II) complexes with modified indolo[3,2-c]quinoline ligands were derived from structurally related paullone complexes using distinct chemical transformations.18−21 In particular, it has been found that complexes of indolo[3,2-c]quinolines exhibit higher cytotoxicity than their paullone counterparts, thus clearly establishing the effect of replacing the azepine ring in paullones by a pyridine ring in indoloquinolines. In addition, it was shown that SARs of complexes with modified paullones do not necessarily apply to indolo[3,2-c]quinoline-based compounds.18,20 Current efforts by us are focused on investigation of the underlying mechanisms of their antiproliferative activity by exploiting the intrinsic fluorescence of indolo[3,2-c]quinolines.22
Recently, we reported on the syntheses of highly antiproliferative copper(II) complexes with modified indolo[3,2-c]quinolines.20 Herein, we report on the synthesis of a more elaborate bioconjugate EtOOCHLCOOEt with two distinct binding sites and the dinuclear copper(II) and zinc(II) complexes 1 and 2, respectively. The new ligand is sufficiently soluble in biological media and intrinsically fluorescent when light irradiated at λex = 395 nm. These properties permitted us to track the intracellular distribution of EtOOCHLCOOEt and 2. Moreover, the ligand design led to assembly of homometallic dinuclear complexes with distinct compartments (Scheme 1), a feature not explored by us so far in the development of anticancer metal complexes.
Scheme 1. Synthesis of EtOOCHLCOOEt, 1, and 2, and Atom-Numbering Schemes for Modified Indoloquinolines.

Reagents and conditions: (i) 35% formaldehyde solution, conc. HCl;23,24 (ii) diethyl-2,2′-iminodiacetate, triethylamine, dry THF, room temperature, 3 h (95%); (iii) methanol, room temperature, 2 h (95%); (iv) copper(II) acetate monohydrate or zinc(II) acetate dihydrate, methanol, room temperature, 30 min [1 (37%), 2 (33%)].
Experimental Section
Materials
All chemicals were purchased from commercial suppliers and used without further purification. Hydrochloric acid, 2-hydroxy-5-methylbenzaldehyde (A), diethyl-2,2′-iminodiacetate, 4-((2-hydroxyethyl)-piperazin-1-yl)ethanesulfonic acid (HEPES), and guanosine 5′-triphosphate were received from Sigma-Alrdich. l-Histidine, formaldehyde solution (35%), copper(II) acetate monohydrate, and zinc(II) acetate dihydrate were received from Merck, while tetrahydrofuran (THF) and methanol (both analytical reagent grade) were received from Fisher Scientific. THF was dried prior to use by a standard protocol. Dimethyl sulfoxide (DMSO) was received from Acros, ammonium bicarbonate, formic acid, and l-glutamic acid were received from Fluka, and l-aspartic acid was received from Serva. Milli-Q water (18.2 MΩ, Millipore Advantage A10, 185 UV Ultrapure Water System, Molsheim, France) and methanol (Fisher, HPLC grade) were used for ESI-MS experiments. 6-Hydrazinyl-11H-indolo[3,2-c]quinolone (D, Scheme 1) was synthesized according to the published protocol.19 Details of the synthesis and 1H NMR characterization of D are given in the Supporting Information. 3-(Chloromethyl)-2-hydroxy-5-methylbenzaldehyde (B) was obtained from 5-methyl-2-hydroxybenzaldehyde (A) via a previously described chloromethylation reaction.23,24
Diethyl-2,2′-((3-formyl-2-hydroxy-5-methylbenzyl)azanediyl)diacetate (C)
To a stirred solution of 3-(chloromethyl)-2-hydroxy-5-methylbenzaldehyde (0.10 g, 0.54 mmol) in dry THF (30 mL) was added diethyl-2,2′-iminodiacetate (85 μL, 0.48 mmol) under argon atmosphere. Upon addition of triethylamine (281 μL, 2.0 mmol) the colorless solution turned bright yellow and a white precipitate formed. After stirring for 3 h at room temperature, the precipitate was filtered off. The yellow filtrate was concentrated under reduced pressure to give an orange oil, which was dried in vacuo overnight. Yield: 0.17 g, 95%. 1H NMR 500.13 MHz (DMSO-d6, δH, ppm): 10.60 (s, 1H, OH), 10.23 (s, 1H, C1), 7.43 (d, 1H, 4J(HC5) = 2.0 Hz, C7), 7.32 (d, 1H, 4J(HC7) = 2.1 Hz, C5), 4.12 (q, 4H, 3J(HC16, C18) = 7.1 Hz, C15, C17), 3.90 (s, 2H, C9), 3.54 (s, 4H, C11, C13), 2.26 (s, 3H, C8), 1.20 (t, 6H, 3J(HC15, C17) = 7.1 Hz, C16, C18). 13C{1H} NMR 125.76 MHz (DMSO-d6, δC, ppm): 192.9 (C1), 171.2 (C12, C14), 158.3 (C3), 137.9 (C5), 129.1 (C7), 128.6 (C6), 125.2 (C4), 122.3 (C2), 60.8 (C15, C17), 54.4 (C11, C13), 53.6 (C9), 20.3 (C8), 14.5 (C16, C18).
Diethyl-2,2′-((3-(((5H-indolo[3,2-c]quinolin-6(11H)-ylidene)hydrazono)methyl)-2-hydroxy-5-methylbenzyl)azanediyl)diacetate (EtOOCHLCOOEt)
To a solution of C (0.78 g, 2.3 mmol) in methanol (40 mL) was added D (0.54 g, 2.2 mmol). The reaction mixture turned into a bright yellow suspension, which was stirred for 2 h under argon atmosphere and allowed to stand at 4 °C overnight. The yellow product was filtered off, washed with cold methanol (2 × 4 mL), and dried in vacuo overnight. Yield: 0.77 g, 95%. Anal. Calcd for C32H33N5O5·0.75H2O (Mr = 581.15): C, 66.14; H, 5.98; N, 12.05. Found: C, 66.25; H, 6.08; N, 12.03. 1H NMR 500.13 MHz (DMSO-d6, δH, ppm): 12.46 (s, 1H, N11), 10.72 (s, 1H, N5), 10.63 (s, 1H, OH), 8.77 (s, 1H, C14), 8.43 (d, 1H, 3J(HC8) = 7.8 Hz, C7), 8.11 (d, 1H, 3J(HC2) = 7.8 Hz, C1), 7.80 (d, 1H, 3J(HC3) = 8.3 Hz, C4), 7.61 (d, 1H, 3J(HC9) = 8.3 Hz, C10), 7.59 (s, 1H, C20), 7.50–7.44 (m, 1H, C3), 7.40–7.35 (m, 1H, C9), 7.30–7.22 (m, 2H, C8, C2), 7.10 (s, 1H, C18), 4.13 (q, 4H, 3J(HC29, C31) = 7.1 Hz, C28, C30), 3.94 (s, 2H, C22), 3.57 (s, 4H, C24, C26), 2.30 (s, 3H, C21), 1.21 (t, 6H, 3J(HC28, C30) = 7.1 Hz, C29, C31). 13C{1H} NMR 125.76 MHz (DMSO-d6, δC, ppm): 171.2 (C25, C27), 154.0 (C16), 152.1 (C14), 150.1 (C6), 138.6 (C10a), 138.5 (C11a), 138.3 (C4a), 132.1 (C18), 129.5 (C3), 129.2 (C20), 127.8 (C19), 124.3 (C9), 124.2 (C17), 124.1 (C6b), 122.9 (C7), 122.2 (C1), 121.9 (C2), 121.2 (C8), 120.8 (C15), 117.1 (C4), 113.6 (C11b), 112.0 (C10), 105.2 (C6a), 60.6 (C28, C30), 54.5 (C24, C26), 53.1 (C22), 20.7 (C21), 14.6 (C29, C31). ESI-MS (methanol), positive m/z 379 [EtOOCHLCOOEt −N(CH2COOEt)2]+, 568 [EtOOCHLCOOEt + H+]+, 590 [EtOOCHLCOOEt + Na+]+; negative m/z 566 [EtOOCHLCOOEt – H+]−, 603 [EtOOCHLCOOEt + Cl–]−. UV–vis (methanol), λmax (ε, M–1 cm–1): 226 (43 300), 260 (32 350), 273 sh (25 300), 306 (22 400), 348 (15 250), 365 sh (15 900), 382 (17 300). ATR-IR, selected bands, cm–1: 3640, 3375, 2976, 1730, 1608, 1461, 1192, 1002.
Di(μ-acetato-κ2O,O′)-(2-((3-((2-(11H-indolo[3,2-c]quinolin-6-yl-κN5)hydrazono-κN13)methyl)-5-methyl-2-oxidobenzyl-κO1)(2-methoxy-2-oxoethyl-κO5)amino κN23)acetato-κO2)dicopper(II) (1)
To a suspension of EtOOCHLCOOEt (0.20 g, 0.35 mmol) in methanol (15 mL) was added copper(II) acetate monohydrate (0.16 g, 0.78 mmol). After stirring for 30 min the dark-green solution was allowed to stand at 25 °C to evaporate slowly. After 3 days, green crystals formed were filtered off, dried in vacuo overnight, and stored under argon atmosphere. Yield: 0.11 g, 37%. Anal. Calcd for C33H31Cu2N5O9·1.5H2O (Mr = 795.72): C, 49.81; H, 4.31; N, 8.80. Found: C, 49.57; H, 4.30; N, 8.64. ESI-MS (methanol): positive m/z 604 unidentified, 648 [1 – (HOAc) – (OAc)]+, 680 [1 – (OAc)2 + (CH3O)]+. UV–vis (methanol), λmax (ε, M–1 cm–1): 235 (60 800), 272 (41 000), 296 (24 540), 354 (18 900), 420 sh (20 800), 441 (22 700). ATR-IR, selected bands, cm–1: 1737, 1583, 1540, 1385, 1217, 1028. X-ray diffraction-quality single crystals were picked from the reaction vessel prior to filtration.
Di(μ-acetato-κ2O,O′)-(2-((3-((2-(11H-indolo[3,2-c]quinolin-6-yl-κN5)hydrazono-κN13)methyl)-5-methyl-2-oxidobenzyl-κO1)(2-methoxy-2-oxoethyl-κO5)amino κN23)acetato-κO2)dizinc(II) (2)
To a suspension of EtOOCHLCOOEt (0.14 g, 0.25 mmol) in methanol (15 mL) was added zinc(II) acetate dihydrate (0.12 g, 0.57 mmol). After stirring for 30 min the yellow solution was allowed to stand at 25 °C to evaporate slowly. After 4 days cold pentane was added and the mixture allowed to stand at 4 °C for 3 h. The yellow precipitate formed was filtered off, dried in vacuo overnight, and stored under argon atmosphere. Yield: 0.07 g, 33%. Anal. Calcd for C33H31N5O9Zn2·CH3OH·H2O (Mr = 822.46): C, 49.65; H, 4.53; N, 8.52. Found: C, 49.96; H, 4.35; N, 8.25. 1H NMR 500.13 MHz (DMSO-d6, δH, ppm): 12.33–11.60 (bs, 2H, N11, N12), 8.62–6.71 (bm, 11H, C1–4, 7–10, 14, 18, 20), 4.00–3.53 (bm, 9H, C22, 24, 26, 28), 2.22 (s, 3H, C21), 1.88 (bs, 6H, CH3COO). ESI-MS (methanol), positive: m/z 668 [2 – (OAc)2 – (CH3) + (CH3OH)]+, 682 [2 – (OAc)2 + (CH3O)]+, 710 [2 – (OAc)]+, 724 unidentified, 784 unidentified. UV–vis (methanol), λmax (ε, M–1 cm–1): 230 (44 400), 258 (45 700), 290 (27 900), 309 (31 000), 330 (17 900), 346 (18 200), 394 (18 900). ATR-IR, selected bands, cm–1: 1744, 1706, 1583, 1407, 1216, 1012. X-ray diffraction-quality single crystals were picked from the reaction vessel prior to addition of pentane.
Physical Measurements and Instrumentation
1H, 13C, and two-dimensional 1H–1H COSY, 1H–1H TOCSY, 1H–13C HSQC, and 1H–13C HMBC NMR spectra were recorded on a Bruker Avance III spectrometer (Ultrashield Magnet) in DMSO-d6 at 25 °C using standard pulse programs at 500.13 (1H) and 125.76 (13C) MHz. 1H and 13C NMR chemical shifts are quoted relative to the residual solvent signals. Elemental analyses were carried out at the Microanalytical Service of the Faculty of Chemistry, University of Vienna. Electrospray ionization mass spectrometry was performed on a Bruker Esquire 3000 instrument (Bruker Daltonic, Bremen, Germany) on samples dissolved in methanol. UV–vis spectra were recorded with an Agilent 8453 spectrophotometer in the 190–1000 nm window using samples dissolved in methanol at 10 μM concentrations. IR spectra were measured with a Bruker Vertex 70 Fourier transform IR spectrometer by means of the attenuated total reflection (ATR) technique. Fluorescence excitation and emission spectra were recorded with a Horiba FloroMax-4 spectrofluorimeter and processed using the FluorEssence v3.5 software package. Samples of EtOOCHLCOOEt and 2 were prepared from a 1 mM solution of each in DMSO and dilution with HEPES buffer (20 mM, pH = 7.4) to give samples at 10 μM concentrations with a maximum content of 1% DMSO (v/v).
Crystallographic Structure Determination
X-ray diffraction measurements were performed on a Bruker X8 APEXII CCD diffractometer. Single crystals were positioned at 40 mm from the detector, and 1312 and 722 frames were measured, each for 60 and 90 s over 1° scan width for 1·3CH3OH and 2·2CH3OH, correspondingly. Data were processed using SAINT software.25 Crystal data, data collection parameters, and structure refinement details are given in Table 1. Structures were solved by direct methods and refined by full-matrix least-squares techniques. Non-hydrogen atoms were refined with anisotropic displacement parameters, while H atoms were inserted in calculated positions and refined with a riding model. The following software programs were used: structure solution, SHELXS-97; refinement, SHELXL-97;26 molecular diagrams, ORTEP;27 computer, Intel CoreDuo.
Table 1. Crystal Data and Details of Data Collection for 1·3CH3OH and 2·2CH3OH.
| 1·3CH3OH | 2·2CH3OH | |
|---|---|---|
| empirical formula | C36H43Cu2N5O12 | C35H39N5O11OZn2 |
| fw | 864.83 | 836.45 |
| space group | P–1 | P–1 |
| a [Å] | 11.1929(5) | 10.7024(5) |
| b [Å] | 11.3582(5) | 11.6277(5) |
| c [Å] | 15.4454(7) | 15.4646(8) |
| α [deg] | 71.745(2) | 99.404(3) |
| β [deg] | 76.682(3) | 105.532(3) |
| γ [deg] | 81.086(2) | 94.840(3) |
| V [Å3] | 1807.32(14) | 1812.59(15) |
| Z | 2 | 2 |
| λ [Å] | 0.71073 | 0.71073 |
| ρcalcd [g cm–3] | 1.589 | 1.533 |
| cryst size [mm3] | 0.20 × 0.10 × 0.02 | 0.15 × 0.15 × 0.10 |
| T [K] | 120(2) | 120(2) |
| μ [mm–1] | 1.249 | 1.533 |
| R1a | 0.0418 | 0.0485 |
| wR2b | 0.1242 | 0.1420 |
| GOFc | 1.071 | 1.084 |
R1 = Σ∥Fo| – |Fc∥/Σ|Fo|.
wR2 = {Σ[w(Fo2 – Fc2)2]/Σ[w(Fo2)2]}1/2.
GOF = {Σ[w(Fo2 – Fc2)2]/(n – p)}1/2, where n is the number of reflections and p is the total number of parameters refined.
Magnetic Studies
Magnetic measurements were carried out on a microcrystalline sample of 1 with a Quantum Design SQUID magnetometer (MPMS-XL). Variable-temperature (2–300 K) direct current (dc) magnetic susceptibility was measured under an applied magnetic field of 0.1 T. All data were corrected for the contribution of the sample holder and diamagnetism of the samples estimated from Pascal’s constants.28,29 Analysis of the magnetic data was carried out by fitting the χMT(T) and χM(T) thermal variations including temperature-independent paramagnetism (TIP), impurity contribution (ρ), and intermolecular interaction (zJ′)29−31 according to the expression (eq 1)
| 1 |
UV–Vis Titration Studies
Complex formation was studied by UV–vis titration of 10 and 250 μM solutions of EtOOCHLCOOEt in methanol with 10 μL aliquots of 0.5 and 6.25 mM stock solutions of copper(II) acetate monohydrate, respectively. One aliquot was added at 2 min intervals followed by homogenization of the solutions as within this period the equilibrium could be reached. An Agilent 8453 spectrophotometer was used to record UV–vis spectra in the 190–1000 nm window. The path length was 1 cm. Stability constants and molar absorbance spectra of the individual copper(II) complexes were calculated by the computer program PSEQUAD.32
ESI–MS Studies
Electrospray ionization mass spectra were recorded on an AmaZon SL ion trap mass spectrometer (Bruker Daltonics GmbH, Bremen, Germany). Experimental data and provided simulations were acquired using Compass 1.3 software and processed using Data Analysis 4.0 (Bruker Daltonics GmbH, Bremen, Germany). The experimentally obtained mass signals include a maximum standard deviation of m/z ± 0.06 for each species. General instrument parameters were set as follows: Positive-ion mode (HV −4.5 kV, RF level 89%, trap drive 74.4, dry temperature 250 °C, nebulizer 8 psi, dry gas 6 L/min and average accumulation time 144 μs), negative-ion mode (HV 4.5 kV, RF level 89%, trap drive 63.8, dry temperature 250 °C, nebulizer 8 psi, dry gas 6 L/min and average accumulation time 2 ms). Samples were diluted with water:methanol (50:50) or water:methanol:formic acid (50:50:0.2) to a final metal concentration of 5–10 μM and measured by direct infusion into the mass spectrometer at a flow rate of 4 μL/min. Stock solutions of 1 and 2 in DMSO (10 mM) were prepared and stored at −20 °C in the dark. Each compound was diluted in ammonium carbonate buffer (20 mM, pH = 7.95) to give a solution of 100 μM of each compound (with 1% DMSO content). Furthermore, a solution containing l-histidine (His), l-aspartic acid (Asp), l-glutamic acid (Glu), and guanosine 5′-triphosphate (GTP) in equimolar amounts (100 μM each) and a solution containing His, Asp, Glu, and GTP (each 100 μM) and ascorbic acid (Asc, 400 μM) were prepared in the same buffer. Metal-containing solutions were diluted with buffer or mixed with the solutions containing the amino acids and Asc at equimolar ratios to give a final metal concentration in each incubation mixture of 50 μM. Reaction mixtures were incubated at 37 °C, and aliquots were measured directly after mixing and after 1, 3, 5, and 24 h after 10-fold dilution of each with water:methanol (1:1). The slightly acidic tetramethylammonium acetate buffer (20 mM, pH = 6) was avoided because partial release of the metal was observed. Finally, dilution with water only resulted in a low ionization in the positive- and negative-ion modes.
Cell Lines and Cell Culture Conditions
For cytotoxicity determination, three different human cancer cell lines were used: A549 (nonsmall cell lung cancer) and SW480 (colon carcinoma) from the American Type Culture Collection (ATCC, Manassas, VA), both kindly provided by Brigitte Marian, Institute of Cancer Research, Department of Medicine I, Medical University Vienna, Austria, as well as CH1 (ovarian carcinoma), established and kindly provided by the laboratory of Lloyd R. Kelland, CRC Centre for Cancer Therapeutics, Institute of Cancer Research, Sutton, U.K. Cells were grown as adherent monolayer cultures in 75 cm2 culture flasks (StarLab, CytoOne) in Minimal Essential Medium supplemented with 10% heat-inactivated fetal bovine serum (Invitrogen), 1 mM sodium pyruvate, 1% (v/v) nonessential amino acids (from 100× ready-to-use stock), and 4 mM l-glutamine but without antibiotics at 37 °C under a moist atmosphere containing 5% CO2 and 95% air. All cell culture media and reagents were purchased from Sigma-Aldrich Austria unless indicated otherwise.
Cytotoxicity Assay
Cytotoxicity was determined by the colorimetric MTT assay (MTT = 3-(4,5-dimethyl-2-thiazolyl)-2,5-diphenyl-2H-tetrazolium bromide) as described previously.20 Briefly, cells were harvested by trypsinization and seeded in medium (vide supra) into 96-well plates in volumes of 100 μL/well. Depending on the cell line, different cell densities were used to ensure exponential growth of the untreated controls during the experiment: 1.0 × 10³ (CH1), 2.0 × 10³ (SW480), and 3.0 × 10³ (A549) cells per well. In the first 24 h, the cells were allowed to settle and resume exponential growth. Then the test compounds were dissolved in DMSO, serially diluted in medium, and added to the plates in volumes of 100 μL/well so that the DMSO content did not exceed 1%. Due to limited solubility of EtOOCHLCOOEt and 1, the highest concentration was applied in volumes of 200 μL/well after replacing the original medium. After continuous exposure for 96 h (in the incubator at 37 °C and under 5% CO2), the medium was replaced with 100 μL/well RPMI 1640 medium (supplemented with 10% heat-inactivated fetal bovine serum and 4 mM l-glutamine) and MTT solution (MTT reagent in phosphate-buffered saline, 5 mg/mL) in a ratio of 6:1 and plates were incubated for further 4 h. Then the medium/MTT mixture was removed and the formed formazan was dissolved in DMSO (150 μL/well). Optical densities at 550 nm were measured (reference wavelength 690 nm) with a microplate reader (ELX880, BioTek). The quantity of viable cells was expressed as a percentage of untreated controls, and 50% inhibitory concentrations (IC50) were calculated from the concentration–effect curves by interpolation. Every test was repeated in at least three independent experiments, each consisting of three replicates per concentration level.
Fluorescence Microscopy
SW480 cells were seeded in medium on coverslips in 6-well plates and allowed to settle and resume exponential growth for 24 h. Then cells were incubated for 1–2 h with 5 μM of 2 or 10 μM of EtOOCHLCOOEt in medium. Co-staining with ER-Tracker Red and Lyso-Tracker Red (Invitrogen) was performed according to the manufacturer’s instructions. After staining, each slide was washed three times in PBS. A fluorescence microscope BX40 (Olympus) with F-View CCD Camera (Olympus), Cell̂F fluorescence imaging software (Olympus), and 60× magnification oil immersions objective lens were used.
Results and Discussion
Synthesis and Characterization
Syntheses of the ligand EtOOCHLCOOEt and the copper(II) and zinc(II) complexes 1 and 2, respectively, were carried out as shown in Scheme 1. We prepared a potentially hexadentate nonsymmetric ligand consisting of two chelating arms, one flexible able to provide facial coordination to an octahedral metal ion, while the second is rigid and provides a meridional binding. Ester functionalities are frequently introduced into the structure of organic molecules to improve their aqueous solubility and bioavailability.33
Recently, our group reported on the conjugation of l- and d-proline to 3-(chloromethyl)-2-hydroxy-5-methylbenzaldehyde (B) after chloromethylation of 2-hydroxy-5-methylbenzaldehyde (A) (Scheme 1).34 Similarly, we reacted 3-(chloromethyl)-2-hydroxy-5-methylbenzaldehyde (B) with diethyl-2,2′-iminodiacetate and triethylamine in dry THF at room temperature, obtaining diethyl-2,2′-((3-formyl-2-hydroxy-5-methylbenzyl)azanediyl)-diacetate (C) as an orange oil in excellent yield (95%). The ligand EtOOCHLCOOEt was obtained by reacting C with 6-hydrazinyl-11H-indolo[3,2-c]quinoline (D)19 in methanol at room temperature, again in excellent yield (95%). Complexes 1 and 2 were synthesized in 37% and 33% yields starting from the ligand EtOOCHLCOOEt and copper(II) acetate monohydrate and zinc(II) acetate dihydrate, respectively, in methanol at room temperature. The complexation reaction is in both cases accompanied by hydrolysis of one ethyl ester group and transesterification of another ethyl ester function with formation of a new ligand MeOOCHLCOOH. Both generated donor arms are involved in coordination to copper(II) and zinc(II) in 1 and 2, respectively, via the deprotonated carboxylate group and the carbonyl oxygen of the methyl ester group (see Scheme 1, Figures 1 and 2).
Figure 1.
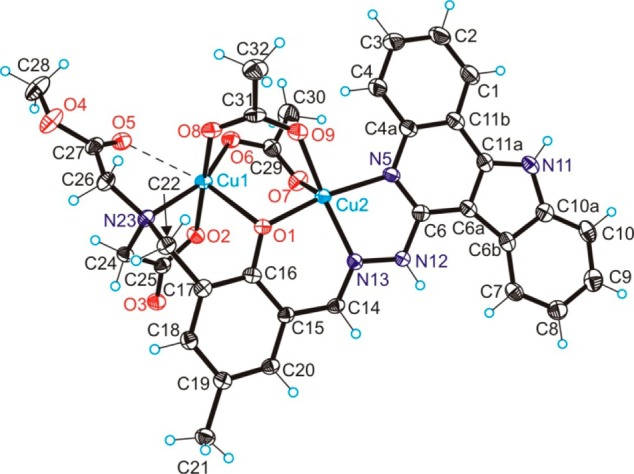
ORTEP view of [Cu2(MeOOCLCOO)(CH3COO)2] with thermal ellipsoids drawn at the 50% probability level. Selected bond distances (Angstroms) and bond angles (degrees): Cu1–O1 2.323(2), Cu1–O2 1.937(2), Cu1–O6 1.946(2), Cu1–O8 1.936(2), Cu1–N23 2.093(3), Cu1···O5 2.946(2), Cu2–O1 1.913(2), Cu2–O7 2.194(2), Cu2–O9 2.002(2), Cu2–N5 2.038(3), Cu2–N13 1.956(3), Cu1–O1–Cu2 101.47(10).
Figure 2.
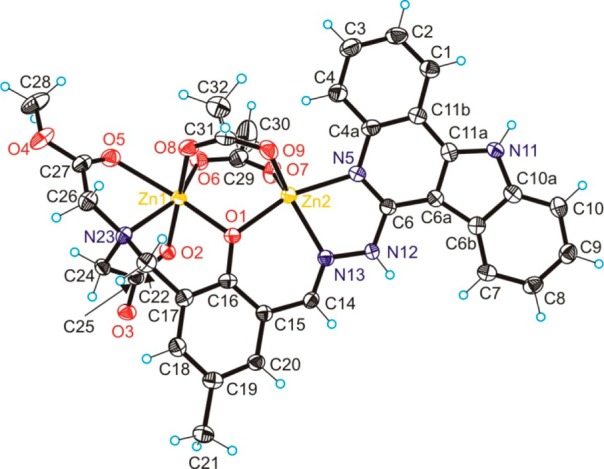
ORTEP view of [Zn2(MeOOCLCOO)(CH3COO)2] with thermal ellipsoids drawn at the 50% probability level. Selected bond distances (Angstroms) and bond angles (degrees): Zn1–O1 2.057(3), Zn1–O2 2.105(3), Zn1–O6 2.004(3), Zn1–O8 2.079(3), Zn1–N23 2.149(4), Zn1–O5 2.322(3), Zn2–O1 2.027(3), Zn2–O7 1.991(3), Zn2–O9 1.993(3), Zn2–N5 2.087(4), Zn2–N13 2.097(4), Zn1–O1–Zn2 103.86(14).
The ligand EtOOCHLCOOEt and its zinc(II) complex 2 have been characterized by one- and two-dimensional NMR spectroscopy, ESI mass spectrometry, elemental analysis, UV–vis, and ATR-IR spectroscopy, while copper(II) complex 1 was studied by magnetic susceptibility measurements, ESI mass spectrometry, and optical spectroscopy. Additionally, both complexes have been characterized by X-ray crystallography.
1H and 13C NMR spectral data of intermediate C, ligand EtOOCHLCOOEt, and zinc(II) complex 2 along with their assignments are given in the Experimental Section. The presence of a proton at N5 in the 1H NMR spectra and the chemical shift of neighboring C6 in the 13C NMR spectra indicate that the ligand adopts a configuration with an exocyclic C6=N12 double bond. Moreover, ESI mass spectra of 1 and 2 in methanol showed peaks that confirmed formation of dimetal complexes. The most abundant peaks at m/z 680 and 682 for 1 and 2, correspondingly, were assigned to [1/2 – (OAc)2 + (CH3O)]+.
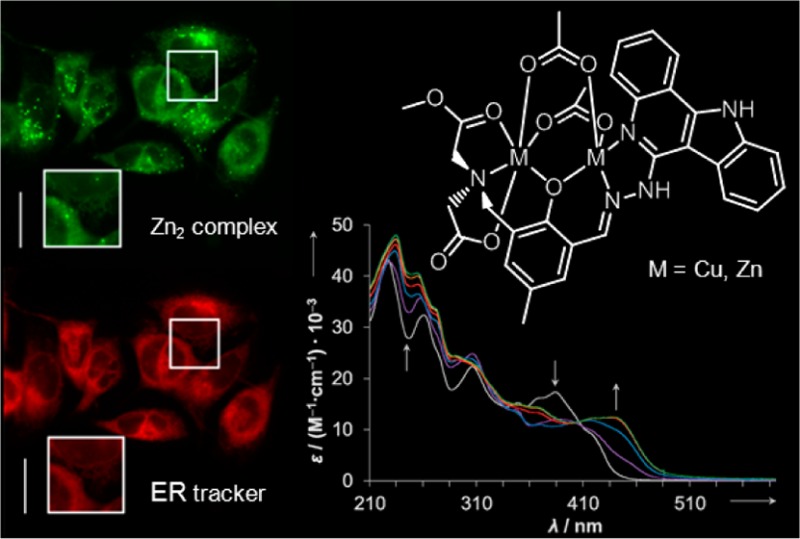
UV–vis spectra of EtOOCHLCOOEt, 1, and 2 in methanol are depicted in Figure S1 (Supporting Information). Metal coordination led to pronounced changes in the visible range of the ligand spectrum, namely, to evolution of an absorption band at ca. 400 nm for 2 and formation of a broad charge-transfer band at 440 nm for 1.
X-ray Crystallography
Results of X-ray diffraction studies of 1·3CH3OH and 2·2CH3OH shown in Figures 1 and 2, respectively, confirm formation of dinuclear complexes with the two copper(II) ions and zinc(II) ions bridged by the phenolate oxygen and two exogenous μ2-η1:η1 acetato ligands.35 Both copper(II) ions in 1 are distorted square pyramidal with τ = 0.2736 for Cu1 with the bridging phenolate oxygen O1 in an apical position and tertiary amine N23, atoms O6 and O8 of the two bridging acetates, and one aminoacetate O2 in the basal plane. We do not describe the coordination environment around Cu1 as octahedral, since the interaction between Cu1 and O5 of the dangling methyl ester group is extremely weak (Cu1···O5 2.946(2) Å). For Cu2 a distorted square-pyramidal coordination geometry (τ = 0.22) was realized with a bridging phenolate oxygen O1, quinoline nitrogen N5, hydrazinic nitrogen N13, one oxygen atom O9 of bridging acetate in a basal plane, and another bridging acetate oxygen atom O7 in apical position.
Unlike 1, the coordination environments of zinc(II) ions in 2 differ from each other. Zn1 has an octahedral environment comprised of the bridging phenolate oxygen O1, tertiary amine donor N23, methyl ester oxygen O5, and atom O6 of the bridging acetate in equatorial positions and two oxygen atoms, one aminoacetate O2, and a second O8 of a bridging acetate in apical positions. Zn2 in contrast to Cu2 shows a more pronounced tendency toward a trigonal-bipyramidal coordination geometry (τ = 0.47) of the same donor atoms. Cu2 lies in the mean plane through Cu2N5C6N12N13 in 1, while Cu1 comes out from this plane by 1.307 Å. In 2 the deviation of Zn1 from the mean plane through Zn2N5C6N12N13 is markedly smaller (0.820 Å), while distortion from planarity of the indoloquinoline moiety is more evident than in 1. The bridging of copper(II) ions via phenolate oxygen results in distinct Cu1–O1 and Cu2–O1 bond distances. The difference between them (0.39 Å) is larger than in other nonsymmetrically μ-phenoxido bridged dicopper(II) complexes, in which the two copper(II) ions in addition are bridged by at least one exogenous μ2-η1:η1 acetato group.37,38 The Cu1–O6 bond distance is markedly shorter than Cu2–O7, and Cu1–O8 is also shorter than Cu2–O9 (see caption to Figure 1). The Cu1···Cu2 distance in the complex is 3.2897(6) Å, which is comparable with Cu···Cu distances of 3.297(3)39 and 3.263(2) Å40 in dicopper(II) complexes with symmetric dinucleating ligands, containing a di-μ-acetato-μ-phenolatodicopper(II) core.
The Zn1–O1 bond distance is only slightly longer than Zn2–O1, as also observed in other complexes with nonsymmetrical dinucleating ligands with a di-μ-acetato-μ-phenolatodizinc(II) core.41 The Zn1–O6 bond distance is only slightly longer than Zn2–O7, while the difference between Zn1–O8 and the shorter bond Zn2–O9 is more pronounced (see caption to Figure 2). The interaction between Zn1 and O5 of the dangling methyl ester group is markedly stronger than comparable interaction in 1. The Zn1···Zn2 distance in the complex is at 3.2154(7) Å, which is similar to the Zn···Zn distance of 3.29(1) Å41a in a dizinc(II) complex with a nonsymmetrical hybrid ligand.
Magnetic Properties
The magnetic behavior of a polycrystalline sample of 1·3CH3OH in the temperature range 2–300 K in a field of 0.1 T is shown in Figure 3. The value of χMT is 0.952 cm3 K mol–1 at 300 K. This value is slightly higher than the expected χMT value (0.750 cm3 K mol–1) for two noninteracting copper(II) ions (d9, g = 2.0, S = 1/2). The value of χMT continuously increases with decreasing temperature and reaches a value of 1.174 cm3 K mol–1 at 3 K. This behavior suggests the presence of ferromagnetic interactions in 1·3CH3OH. According to X-ray diffraction data, complex 1·3CH3OH has a dinuclear structure, in which the two copper(II) ions are connected by a phenolate oxygen atom and two bidentate bridging acetato ligands (Figure 1). Therefore, the magnetic behavior can be analyzed by using the classical spin Hamiltonian (eq 2):29,30,42
| 2 |
where J is the exchange coupling constant and S1 = S2 = 1/2.
Figure 3.
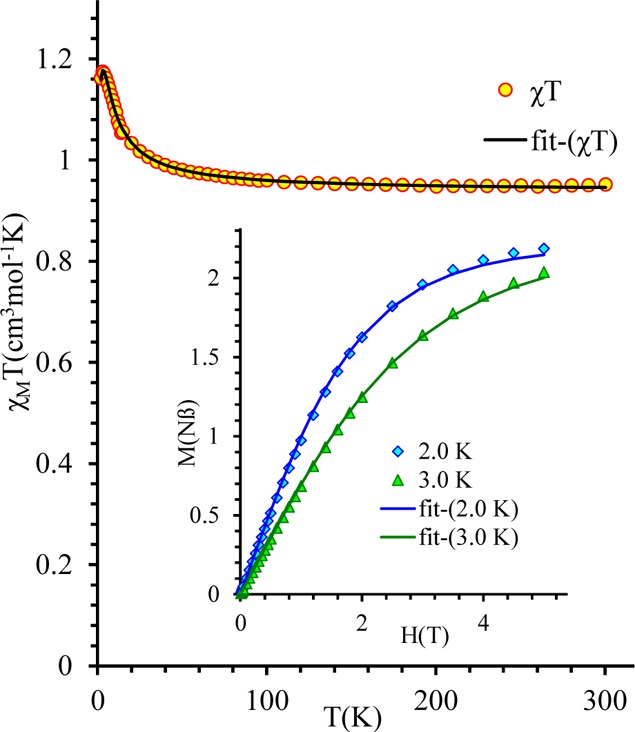
Plots of χMT vs T and magnetization vs H (inset) at 2 and 3 K for 1·3CH3OH. Solid lines correspond to the best fit with parameters quoted in the text.
In this case, the Van Vleck equation leads to the following analytical expression (eq 3)
| 3 |
The fitting procedure results in an excellent agreement between the experimental data and the calculated curve (R = 1.4 × 10⁻⁶; Figure 3). The parameters extracted from the fit are J = 3.49(3) cm–1, g = 2.24(1), and zJ′ = −0.08(1) cm–1 and correspond to ferromagnetic interaction between copper(II) ions. The temperature-independent paramagnetism (TIP) and impurity contribution (ρ) have values close to zero, and both were fixed at zero in the final fit. The presence of ferromagnetic interaction was confirmed by magnetization measurements at low temperature (see inset picture in Figure 3). The fitting of magnetization vs field using the Brillouin function indicates the presence of spin ground state S = 1 (g = 2.203(2)) in 1·3CH3OH, which is consistent with the results obtained from analysis of the temperature dependence of magnetic susceptibility.
The nature of magnetic interaction in dinuclear copper(II) complexes has been extensively studied from both theoretical and experimental points of view.43−51 The magnetic interaction in 1·3CH3OH occurs via three bridges: two μ2-η1:η1 acetato ligands and one bridging phenolate.
According to the literature,47 the acetate bridges mediate the antiferromagnetic interactions, while the phenolate bridge in dinuclear copper(II) complexes can promote both antiferromagnetic as well as ferromagnetic interactions. The character of magnetic interaction depends on geometrical features, especially on the Cu–O–Cu angle α, out-of-plane deviation angle φ (see Figure 4), and torsion angle Cu–O–Cu–O. For α angles < 99° and φ angles > 30°, a strong ferromagnetic interaction can be expected.47 In the case of 1·3CH3OH with α = 101.47° and φ = 30.04°, the presence of a weak ferromagnetic interaction (J = 3.49 cm–1) is justified. We can conclude that due to the out-of-plane deviation of the phenol group relative to Cu–O–Cu plane the resulting magnetic interaction between the triple-bridged Cu(II) ions is weakly ferromagnetic. Comparable weakly ferromagnetic interactions were reported for other dinuclear copper(II) complexes with two50,52 or three different bridges.51,53−57
Figure 4.
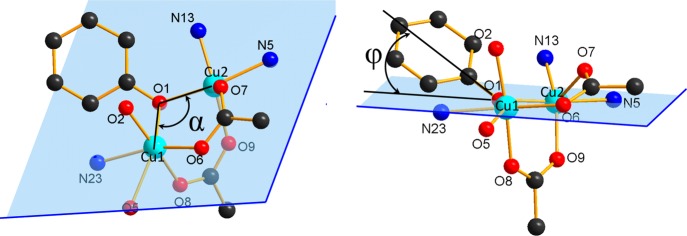
Coordination core in 1·3CH3OH showing the angles α and φ.
Complex Formation Studies
To elucidate whether the two binding sites in EtOOCHLCOOEt show different affinities to copper(II), complex formation was studied for 1 via UV–vis titrations of the ligand EtOOCHLCOOEt at two different concentrations with copper(II) acetate monohydrate in methanol at room temperature (Figures 5 and S2, Supporting Information).
Figure 5.

UV–vis absorbance spectrum of the ligand EtOOCHLCOOEt (dashed trace) and its changes by addition of copper(II) acetate monohydrate (solid traces) in methanol (cL = 10 μM; cCu = 0–22.5 μM; T = 298 K; l = 1 cm). (Inset) Calculated molar absorption spectra of the copper(II) complexes.
Development of a broad charge-transfer band at ca. 440 nm was observed upon addition of up to ∼1.5 mol equiv of copper(II). Then a small shift of λmax occurred (Figure 5). Characteristic spectral changes have also been registered in the range of the d–d transitions (Figure S2, Supporting Information). A wide band with λmax at 664 nm overlapped partly with the charge-transfer band was seen upon addition of copper(II). This absorption band is slightly red shifted upon addition of more than 1 equiv of copper(II). On the basis of the spectral changes in the wavelength range 230–520 nm (Figure 5), overall stability constants have been calculated for the mono- [CuL] (log β = 7.17 ± 0.08) and dinuclear [Cu2L] species (log β = 13.13 ± 0.24; log K = 5.96). The molar absorbance spectra of the ligand, [CuL], and [Cu2L] complexes were also calculated (Figure 5). The goodness-of-fit between measured and calculated absorbance values is shown in Figure 6. Stability constants obtained by using the changes of the d–d transition bands were in good agreement with those obtained by monitoring the charge-transfer band within 0.2 log unit. Stepwise formation constant of the [Cu2L] species is merely ∼1 log unit lower than that of the [CuL] showing the overlapping binding of the metal ions. Therefore, it can be concluded that both binding sites in ligand EtOOCHLCOOEt coordinate with a similar affinity and no preference for either of them can be perceived.
Figure 6.

Measured and calculated (dashed lines) absorbance values at 382 (⧫) and 440 nm (×) at various EtOOCHLCOOEt -to-copper(II) ratios (cL = 10 μM; cCu = 0–22.5 μM; T = 298 K; l = 1 cm, methanol).
ESI-MS Studies
The stability of complexes 1 and 2 in aqueous solution and their reactivity toward small biomolecules was studied by ESI mass spectrometry (ESI-MS) since it proved to be effective for characterizing also complex metallodrug interactions with biomolecules.58−60 Both complexes display a very similar aqueous solution behavior, which is characterized by ester hydrolysis of the ligand and partial metal release over time. Products of ester hydrolysis are detected directly after dissolving the compounds in buffer, and the ester is quantitatively hydrolyzed within 24 h. The major thermodynamic products after this period correspond to ions [M2(L–Me)(OH) – H+]− and [M(L–Me) – H+]−, where M = Cu or Zn and L = MeOOCLCOO, detected in the negative-ion mode (Figure 7). The latter mass signal suggests that release of specifically one metal can occur from both 1 and 2. Interestingly, these signals are detected at 95% and 38% intensities relative to [M2(L–Me)(OH) – H+]− for 1 and 2, respectively, i.e., the Cu complex 1 releases the metal to a greater extent. Therefore, complex 2 appears to be slightly more stable in aqueous solution, which also seems to be of relevance for the cytotoxicity. Additionally, 2 does not ionize in the positive-ion mode, suggesting stable bonds between Zn ions and the acetato ligands (Figure S3, Supporting Information). Note that acetato complexes were not detected in the mass spectra of 1 or 2. Furthermore, the isotopic distributions of the major mass signals of 1 and 2 are in good agreement with simulated patterns (Figure S4, Supporting Information). Both complexes were exposed to mixtures containing equimolar amounts of l-histidine (His), l-aspartic acid (Asp), l-glutamic acid (Glu), and guanosine 5′-triphosphate (GTP). The complexes did not react with any of the biological nucleophiles, and similar mass spectra were observed compared to solutions containing only the respective metal. Addition of 4 equiv of ascorbic acid (Asc) to the amino acids resulted in transient formation of Glu and Asc adducts with 1 in a small amount; however, they were only detected immediately after mixing (Figure 7C) and absent for 2. Free ascorbate was consumed within 1 h but had no impact on the overall reactivity of the complexes.
Figure 7.

ESI mass spectra in negative-ion mode are shown for 1 (A) and 2 (B) in methanol over a period of 24 h. (C) Glu- and Asc-adducts of 1, which were only detected directly after mixing. Samples were diluted with water:methanol (50:50).
An interesting feature of both compounds is their ability to release a metal ion also in a pH-dependent manner (Figure S5, Supporting Information). The samples incubated at pH = 7.95 for 24 h displayed only partial metal release. Lowering the pH of this incubation solution by dilution with 0.1% formic acid resulted in immediate and quantitative release of one metal from both dimetallic complexes. It is suggested that the carboxylates are prone to protonation under these conditions, leading to release of the coordinated metal.
Fluorescence Properties
Fluorescence spectra of EtOOCHLCOOEt and 2 were recorded in HEPES-buffered solutions (20 mM; pH = 7.4) with a 1% (v/v) content of DMSO (Figure S6, Supporting Information). Fluorescence excitation spectra (λem = 470 nm) were measured in the range between 260 and 460 nm and emission spectra (λex = 395 nm) in the range from 410 to 710 nm. The emission maximum of the ligand was observed at 532 nm. Coordination to zinc(II) led to a blue shift of the emission band by 54 nm, with the maximum at 466 nm in the spectra of 2. EtOOCHLCOOEt was found fluorogenic, as excitation and emission spectra strongly increased in intensity upon binding to zinc(II).
Cytotoxicity in Cancer Cells
The cytotoxicity of EtOOCHLCOOEt, 1, and 2 was determined by the MTT assay in three human cancer cell lines, namely, A549 (nonsmall cell lung carcinoma), CH1 (ovarian carcinoma), and SW480 (colon adenocarcinoma), all yielding IC50 values in the micromolar concentration range (Table 2). Values for a simple copper(II) salt, CuCl2, are given for comparison.
Table 2. Cytotoxicity of Ligand EtOOCHLCOOEt, Complexes 1 and 2 in Three Human Cancer Cell Lines.
| IC50 (μM), 96 ha |
||||
|---|---|---|---|---|
| EtOOCHLCOOEt | 1 | 2 | CuCl2·2H2Ob | |
| A549 | 28 ± 1 | 29 ± 4 | 12 ± 1 | 153 ± 8 |
| CH1 | 2.2 ± 0.3 | 6.8 ± 1.4 | 1.6 ± 0.4 | 43 ± 3 |
| SW480 | 16 ± 2 | 22 ± 2 | 7.8 ± 0.3 | >160 |
Fifty percent inhibitory concentrations (means ± standard deviations from at least three independent experiments), as obtained by the MTT assay using exposure times of 96 h.
Taken from ref (12).
CH1 is the most sensitive cell line to all tested compounds, whereas A549, a more chemoresistant cell line equipped with multidrug-resistance-mediating proteins,61 is the least sensitive one, with IC50 values up to 13 times higher than in CH1 cells. Whereas complexation with copper(II) has either little effect on cytotoxicity (A549, SW480 cells) or yields 3-fold decreased potency (CH1 cells), complexation with zinc(II) results in about 2-fold enhancement of cytotoxicity, compared to the metal-free ligand EtOOCHLCOOEt in all three cell lines. In comparison to the dicopper(II) complex 1, the dizinc(II) complex 2 is up to three times more active in SW480 and four times more active in CH1 cells (see also Figure S7, Supporting Information). This might be directly related to the lower tendency of 2 to release a metal in aqueous media compared to 1 as observed in the ESI-MS experiments. On the basis of these observations, it can be concluded that complexation to zinc(II) results in higher cytotoxicity but also better solubility in biocompatible media compared to the metal-free ligand as well as copper(II) complex 1. Cytotoxic potency of a simple copper(II) salt, CuCl2, is lower, with IC50 values being at least five times higher than those of complex 1.
Fluorescence Microscopy
On the basis of the fluorescence properties of EtOOCHLCOOEt and dizinc(II) complex 2, their subcellular localization was studied by fluorescence microscopy in human cancer cells including their colocalization with organelle-specific dyes. For visualization of the compounds in live SW480 cells, the U-MWU2 filter (Olympus Japan, excitation filter BP330-385, emission filter BA420) was used, while the costaining dyes were recorded using the U-MWG2 filter (Olympus Japan, excitation filter BP510-550, emission filter BA590). The compounds do not show interference in the U-MWG2 channel, and autofluorescence of the cells was not observed with the used filters. Microscopic images of cells treated with EtOOCHLCOOEt and 2, as shown in Figure 8, revealed localization of fluorescence in diffuse voluminous as well as distinct small cytoplasmic structures but no discernible uptake into the nucleus. The highest accumulation matches with both the ER-Tracker Red and the Lyso-Tracker Red staining, suggesting that the endoplasmic reticulum as well as lysosomes are potential target compartments of EtOOCHLCOOEt or that lysosomes are involved in sequestration and/or detoxification of the compound. The same may apply to 2, provided that the complex is sufficiently stable throughout its passage through the cell, as it cannot be ruled out that the fluorescence distribution originates from dissociated ligand molecules.
Figure 8.
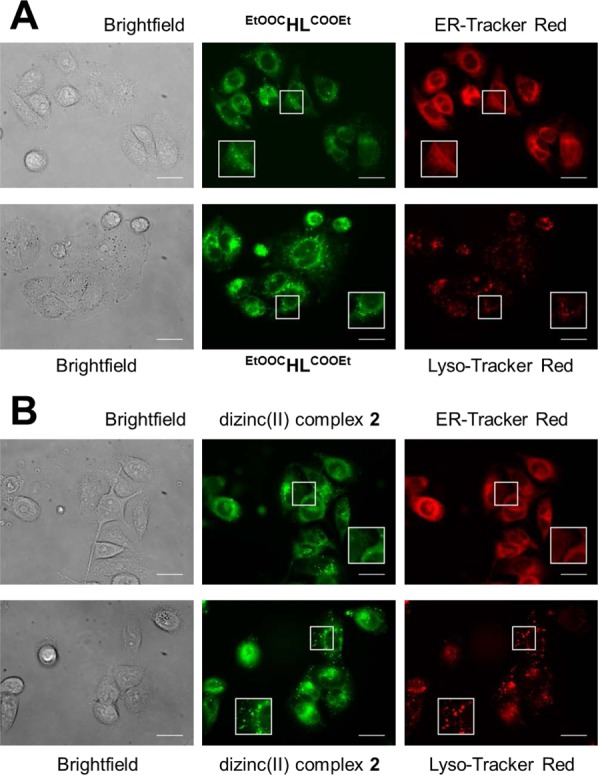
Fluorescence microscopy images of live SW480 cells. Cells were costained with 10 μM of EtOOCHLCOOEt (A) or 5 μM of 2 (B) and ER-Tracker Red (500 nM) and Lyso-Tracker Red (1 μM), respectively. Magnification of areas marked by squares are shown as insets. Scale bars are 20 μm.
Conclusion
Condensation of 6-hydrazinyl-11H-indolo[3,2-c]quinoline with diethyl-2,2′-((3-formyl-2-hydroxy-5-methylbenzyl)azanediyl)diacetate afforded a new nonsymmetric dinucleating ligand EtOOCHLCOOEt with increased aqueous solubility and fluorescence properties. Complexes 1 and 2 were obtained upon treatment of the ligand with 2 equiv of Cu(CH3COO)2·H2O and Zn(CH3COO)2·2H2O in methanol, respectively. Complexation reaction in both cases is accompanied by hydrolysis of one ethyl ester group and transesterification of another ethyl ester function with formation of MeOOCHLCOOH. Dinuclear structure in 1·3CH3OH and 2·3CH3OH is supported by three bridges: two acetato ligands and one phenolato bridge from nonsymmetric MeOOCHLCOOH ligand. The temperature dependence and field dependence magnetic measurements for 1·3CH3OH indicate a weak ferromagnetic interaction (J = 3.49 cm–1) between copper(II) ions. All three compounds show respectable antiproliferative activity in human cancer cell lines (A549, CH1, SW480) with IC50 values in the low micromolar concentration range. It seems that the increased resistance of 2 toward metal release in aqueous solution compared to 1 may be responsible for the higher cytotoxicity. Localization of EtOOCHLCOOEt and 2 in cytoplasmic structures has been found by fluorescence microscopy, suggesting that the endoplasmic reticulum as well as the lysosomes can be potential target compartments of these compounds.
Acknowledgments
We thank Alexander Roller for collection of X-ray data for 1 and 2. This work was financially supported by the University of Vienna within the doctoral program “Initiativkolleg Functional Molecules” (IK I041-N) and the Austrian Science Fund (Project no. P22339-N19).
Supporting Information Available
Synthesis and NMR characterization of intermediates, UV–vis spectra of EtOOCHLCOOEt, 1, and 2 in methanol, UV–vis absorbance spectrum of the ligand EtOOCHLCOOEt and its changes by addition of copper(II) in methanol, ESI mass spectra of 1 and 2, details on isotopic distributions of the major detected mass signals of 1 and 2 with simulations, mass spectra measured at lower pH, fluorescence excitation and emission spectra of EtOOCHLCOOEt and 2 at physiological pH, concentration-effect curves of EtOOCHLCOOEt and complexes 1 and 2 in human cancer cell lines, experimental masses and their assignment, crystallographic data in CIF format. This material is available free of charge via the Internet at http://pubs.acs.org.
The authors declare no competing financial interest.
Dedication
Dedicated to Prof. Dr. Manfred T. Reetz on the occasion of his 70th birthday.
Supplementary Material
References
- Colditz G. A; Sellers T. A; Trapido E. Nat. Rev. Cancer 2006, 6, 75–83. [DOI] [PubMed] [Google Scholar]
- Umar A.; Dunn B. K.; Greenwald P. Nat. Rev. Cancer 2012, 12, 835–848. [DOI] [PubMed] [Google Scholar]
- Kim M.-S. Biomol. Ther. 2011, 19, 371–389. [Google Scholar]
- Jakupec M. A.; Galanski M.; Arion V. B.; Hartinger C. G.; Keppler B. K. Dalton Trans. 2008, 183–194. [DOI] [PubMed] [Google Scholar]
- a Hartinger C. G.; Dyson P. J. Chem. Soc. Rev. 2009, 38, 391–401. [DOI] [PubMed] [Google Scholar]; b Therrien B. Chem.—Eur. J. 2013, 19, 8378–8386. [DOI] [PubMed] [Google Scholar]; c Noffke A. L.; Habtemariam A.; Pizarro A. M.; Sadler P. J. Chem. Commun. 2012, 48, 5219–5246. [DOI] [PubMed] [Google Scholar]; d Smith G. S.; Therrien B. Dalton Trans. 2011, 40, 10793–10800. [DOI] [PubMed] [Google Scholar]; e Barry N. P. E.; Sadler P. J. Chem. Commun. 2013, 49, 5106–5131. [DOI] [PubMed] [Google Scholar]; f Govender P.; Therrien B.; Smith G. S. Eur. J. Inorg. Chem. 2012, 2012, 2853–2862. [Google Scholar]
- Jungwirth U.; Kowol C. R.; Keppler B. K.; Hartinger C. G.; Berger W.; Heffeter P. Antioxid. Redox Signaling 2011, 15, 1085–1127. [DOI] [PMC free article] [PubMed] [Google Scholar]
- Gasser G.; Metzler-Nolte N. Curr. Opin. Chem. Biol. 2012, 16, 84–91. [DOI] [PubMed] [Google Scholar]
- Zaharevitz D. W.; Gussio R.; Leost M.; Senderowicz A. M.; Lahusen T.; Kunick C.; Meijer L.; Sausville E. A. Cancer Res. 1999, 59, 2566–2569. [PubMed] [Google Scholar]
- Kelland L. R. Expert Opin. Invest. Drugs 2000, 9, 2903–2911. [DOI] [PubMed] [Google Scholar]
- Schultz C.; Link A.; Leost M.; Zaharevitz D. W.; Gussio R.; Sausville E. A.; Meijer L.; Kunick C. J. Med. Chem. 1999, 42, 2909–2919. [DOI] [PubMed] [Google Scholar]
- Tolle N.; Kunick C. Curr. Top. Med. Chem. 2011, 11, 1320–1332. [DOI] [PubMed] [Google Scholar]
- Primik M. F.; Mühlgassner G.; Jakupec M. A.; Zava O.; Dyson P. J.; Arion V. B.; Keppler B. K. Inorg. Chem. 2010, 49, 302–311. [DOI] [PubMed] [Google Scholar]
- Dobrov A.; Arion V. B.; Kandler N.; Ginzinger W.; Jakupec M. A.; Rufińska A.; Graf von Keyserlingk N.; Galanski M.; Kowol C.; Keppler B. K. Inorg. Chem. 2006, 45, 1945–1950. [DOI] [PubMed] [Google Scholar]
- Ginzinger W.; Arion V. B.; Giester G.; Galanski M.; Keppler B. K. Centr. Eur. J. Chem. 2008, 6, 340–346. [Google Scholar]
- Schmid W. F.; John R. O.; Arion V. B.; Jakupec M. A.; Keppler B. K. Organometallics 2007, 26, 6643–6652. [Google Scholar]
- Arion V. B.; Dobrov A.; Göschl S.; Jakupec M. A.; Keppler B. K.; Rapta P. Chem. Commun. 2012, 48, 8559–8561. [DOI] [PubMed] [Google Scholar]
- Lavrado J.; Moreira R.; Paulo A. Curr. Med. Chem. 2010, 17, 2348–2370. [DOI] [PubMed] [Google Scholar]
- Filak L. K.; Mühlgassner G.; Jakupec M. A.; Heffeter P.; Berger W.; Arion V. B.; Keppler B. K. J. Biol. Inorg. Chem. 2010, 15, 903–918. [DOI] [PMC free article] [PubMed] [Google Scholar]
- Filak L. K.; Mühlgassner G.; Bacher F.; Roller A.; Galanski M.; Jakupec M. A.; Keppler B. K.; Arion V. B. Organometallics 2011, 30, 273–283. [DOI] [PMC free article] [PubMed] [Google Scholar]
- Primik M. F.; Göschl S.; Jakupec M. A; Roller A.; Keppler B. K.; Arion V. B. Inorg. Chem. 2010, 49, 11084–11095. [DOI] [PubMed] [Google Scholar]
- Filak L. K.; Göschl S.; Hackl S.; Jakupec M. A.; Arion V. B. Inorg. Chim. Acta 2012, 393, 252–260. [DOI] [PMC free article] [PubMed] [Google Scholar]
- Filak L. K.; Göschl S.; Heffeter P.; Ghannadzadeh Samper K.; Egger A. E.; Jakupec M. A; Keppler B. K.; Berger W.; Arion V. B. Organometallics 2013, 32, 903–914. [DOI] [PMC free article] [PubMed] [Google Scholar]
- Huisman M.; Koval I. a.; Gamez P.; Reedijk J. Inorg. Chim. Acta 2006, 359, 1786–1794. [Google Scholar]
- Wang Q.; Wilson C.; Blake A. J.; Collinson S. R.; Tasker P. A.; Schröder M. Tetrahedron Lett. 2006, 47, 8983–8987. [Google Scholar]
- SAINT-Plus, version 7.06a, and APEX2; Bruker-Nonius AXS, Inc.: Madison, WI, 2004. [Google Scholar]
- Sheldrick G. M. Acta Crystallogr. 2008, A46, 112–122. [DOI] [PubMed] [Google Scholar]
- Burnett M. N.; Johnson G. K.. ORTEPIII. Report ORNL-6895; Oak Ridge National Laboratory: Oak Ridge, TN, 1996. [Google Scholar]
- Pascal P. Ann. Chim. Phys. 1910, 19, 5–70. [Google Scholar]
- Kahn O.Molecular Magnetism; VCH Publishers, Inc.: New York, Weinheim, Cambridge, 1993. [Google Scholar]
- O’Connor C. J. Prog. Inorg. Chem. 1982, 29, 203–283. [Google Scholar]
- Myers B. E.; Berger L.; Friedberg S. A. J. Appl. Phys. 1969, 40, 1149–1151. [Google Scholar]
- Zékány L.; Nagypál I. In Computational Methods for the Determination of Stability Constants; Leggett D. L., Ed.; Plenum Press: New York, 1985; pp 291–353. [Google Scholar]
- Hatfield J. M.; Wierdl M.; Wadkins R. M.; Potter P. M. Expert Opin. Drug Metab. Toxicol. 2008, 4, 1153–1165. [DOI] [PMC free article] [PubMed] [Google Scholar]
- Milunovic M. N. M.; Enyedy É. A; Nagy N. V.; Kiss T.; Trondl R.; Jakupec M. A; Keppler B. K.; Krachler R.; Novitchi G.; Arion V. B. Inorg. Chem. 2012, 51, 9309–9321. [DOI] [PubMed] [Google Scholar]
- Bußkamp H.; Deacon G. B.; Hilder M.; Junk P. C.; Kynast U. H.; Lee W. W.; Turner D. R. CrystEngComm 2007, 9, 394–411. [Google Scholar]
- Addison A. W.; Rao T. N.; Reedijk J.; van Rijn J.; Verschoor C. G. J. Chem. Soc., Dalton Trans. 1984, 1349–1356. [Google Scholar]
- Lubben M.; Hage R.; Meetsma A.; Bÿma K.; Feringa B. L. Inorg. Chem. 1995, 34, 2217–2224. [Google Scholar]
- Adams H.; Candeland G.; Crane J. D.; Fenton D. E.; Smith A. J. Chem. Commun. 1990, 93–95. [Google Scholar]
- Nishida Y.; Tokii T.; Mory Y. J. Chem. Soc., Chem. Commun. 1988, 10, 675–676. [Google Scholar]
- Bertoncello K.; Fallon G. D.; Hodgkin J. H.; Murray K. S. Inorg. Chem. 1988, 27, 4750–4758. [Google Scholar]
- a Abe K.; Izumi J.; Ohba M.; Yokoyama T.; Okawa H. Bull. Chem. Soc. Jpn. 2001, 74, 85–95. [Google Scholar]; b Adams H.; Cummings L. R.; Fenton D. E.; McHugh P. E. Inorg. Chem. Commun. 2003, 6, 19–22. [Google Scholar]
- Bleaney B.; Bowers K. D. Proc. R. Soc. London Ser., Math. Phys. Sci. 1952, 214, 451–465. [Google Scholar]
- Melník M. Coord. Chem. Rev. 1982, 42, 259–293. [Google Scholar]
- Onofrio N.; Mouesca J.-M. J. Phys. Chem. A 2010, 114, 6149–6156. [DOI] [PubMed] [Google Scholar]
- Ruiz E.; Alemany P.; Alvarez S.; Cano J. Inorg. Chem. 1997, 36, 3683–3688. [DOI] [PubMed] [Google Scholar]
- Blanchet-Boiteux C.; Mouesca J.-M. Theor. Chem. Acc. 2000, 104, 257–264. [Google Scholar]
- Venegas-Yazigi D.; Aravena D.; Spodine E.; Ruiz E.; Alvarez S. Coord. Chem. Rev. 2010, 254, 2086–2095. [Google Scholar]
- Kato M.; Muto Y. Coord. Chem. Rev. 1988, 92, 45–83. [Google Scholar]
- Kahn O. Comm. Inorg. Chem. 1984, 3, 105–132. [Google Scholar]
- Lopez C.; Costa R.; Illas F.; De Graaf C.; Turnbull M. M.; Landee C. P.; Espinosa E.; Mata I.; Molins E. Dalton Trans. 2005, 2322–2330. [DOI] [PubMed] [Google Scholar]
- Costa R.; Moreira I. R. D. P. R.; Youngme S.; Siriwong K.; Wannarit N.; Illas F. Inorg. Chem. 2010, 49, 285–294. [DOI] [PubMed] [Google Scholar]
- Fondo M.; García-Deibe A. M.; Sanmartín J.; Bermejo M. R.; Lezama L.; Rojo T. Eur. J. Inorg. Chem. 2003, 3703–3706. [Google Scholar]
- Christou G.; Perlepes S. P.; Libby E.; Folting K.; Huffman J. C.; Webb R. J.; Hendrickson D. N. Inorg. Chem. 1990, 29, 3657–3666. [Google Scholar]
- Youngme S.; Phatchimkun J.; Wannarit N.; Chaichit N.; Meejoo S.; van Albada G. A.; Reedijk J. Polyhedron 2008, 27, 304–318. [Google Scholar]
- Chailuecha C.; Youngme S.; Pakawatchai C.; Chaichit N.; van Albada G. A.; Reedijk J. Inorg. Chim. Acta 2006, 359, 4168–4178. [Google Scholar]
- Youngme S.; Chailuecha C.; van Albada G. A.; Pakawatchai C.; Chaichit N.; Reedijk J. Inorg. Chim. Acta 2004, 357, 2532–2542. [Google Scholar]
- Youngme S.; Chailuecha C.; van Albada G. A.; Pakawatchai C.; Chaichit N.; Reedijk J. Inorg. Chim. Acta 2005, 358, 1068–1078. [Google Scholar]
- Meier S. M.; Hanif M.; Kandioller W.; Keppler B. K.; Hartinger C. G. J. Inorg. Biochem. 2012, 108, 91–95. [DOI] [PubMed] [Google Scholar]
- Meier S. M.; Tsybin Y. O.; Dyson P. J.; Keppler B. K.; Hartinger C. G. Anal. Bioanal. Chem. 2012, 402, 2655–2662. [DOI] [PubMed] [Google Scholar]
- Büchel G. E.; Gavriluta A.; Novak M.; Meier S. M.; Jakupec M. A.; Cuzan O.; Turta C.; Tommasino J.-B.; Jeanneau E.; Novitchi G.; Luneau D.; Arion V. B. Inorg. Chem. 2013, 52, 6273–6285. [DOI] [PMC free article] [PubMed] [Google Scholar]
- a Berger W.; Elbling L.; Hauptmann E.; Micksche M. Int. J. Cancer 1997, 73, 84–93. [DOI] [PubMed] [Google Scholar]; b Berger W.; Elbling L.; Micksche M. Int. J. Cancer 2000, 88, 293–300. [PubMed] [Google Scholar]
Associated Data
This section collects any data citations, data availability statements, or supplementary materials included in this article.