Abstract
The protein universe displays a wealth of therapeutically relevant activities, but T cell driven immune responses to non-“self” biological agents present a major impediment to harnessing the full diversity of these molecular functions. Mutagenic T cell epitope deletion seeks to mitigate the immune response, but can typically address only a small number of epitopes. Here we pursue a “bottom up” approach that redesigns an entire protein to remain native-like but contain few if any immunogenic epitopes. We do so by extending the Rosetta flexible-backbone protein design software with an epitope scoring mechanism and appropriate constraints. The method is benchmarked with a diverse panel of proteins and applied to three targets of therapeutic interest. We show that the deimmunized designs indeed have minimal predicted epitope content and are native-like in terms of various quality measures, and moreover that they display levels of native sequence recovery comparable to those of non-deimmunized designs.
Keywords: Therapeutic protein deimmunization, T cell epitope, Rosetta design, flexible-backbone protein design, biologics
SUMMARY
We show that it is possible to redesign a protein so as to have practically no predicted T cell epitope content (thereby circumventing the recognition triggering a T cell driven immune response to a non-“self” therapeutic) but still have native-like structural and sequence properties (thereby being more likely to maintain the desired therapeutic function). To do so, we extend the Rosetta flexible backbone protein design software with epitope scoring machinery, which we combine with charge and evolutionary constraints to counterbalance the tendency towards excessive mutation away from residues characteristic of T cell epitopes.
INTRODUCTION
The ongoing development of protein-based therapeutics has provided novel and efficacious treatments for a number of diseases, and consequently therapeutic proteins are on track to be four of the five top-selling drugs in 2012.1 Recent growth in biologics has been fueled in large part by therapeutic antibodies,2 which are often generated in an animal model and then humanized by grafting their complementarity determining regions onto human protein scaffolds3,4 (or more recently by generating “fully human” antibodies as a starting point5,6). The humanization process is necessary due to the fact that large molecules of non-human origin are subject to surveillance by the human immune system,7 which may yield an anti-biotherapeutic immune response (aBIR) that can accelerate clearance, reduce efficacy or cause varying degrees of allergic reaction.8
While monoclonal antibodies are currently driving the biologics market, they represent but one example of the therapeutically relevant functions found in nature’s protein repertoire. Enzymes, hormones, receptors, toxins, and other classes of proteins constitute a vast and underutilized reservoir of prospective therapeutic candidates. To fully capitalize on this putative panacea, the risks associated with aBIR must be mitigated. Unfortunately the grafting methods that have been so successful for antibodies rely on the particulars of immunoglobulin structure and function and are not generally applicable to other protein classes. Thus developing a more universal deimmunization methodology might catalyze a market-wide acceleration in biotherapeutic development in much the same way that humanization jump-started therapeutic antibodies.
One key source of aBIR is molecular recognition and cellular presentation of constituent immunogenic peptides, called “epitopes”. Epitopes are loaded into the groove of major histocompatibility complex (MHC) proteins. The peptide-MHC complex then interacts with a cognate T cell receptor to initiate an immune response against the original protein. This well-defined immunological pathway can be circumvented by mutating a foreign protein such that its constituent peptides evade recognition by MHC and T cell receptors.9–11 A number of studies have shown that such “epitope deletion” can indeed generate less immunogenic proteins.12–15
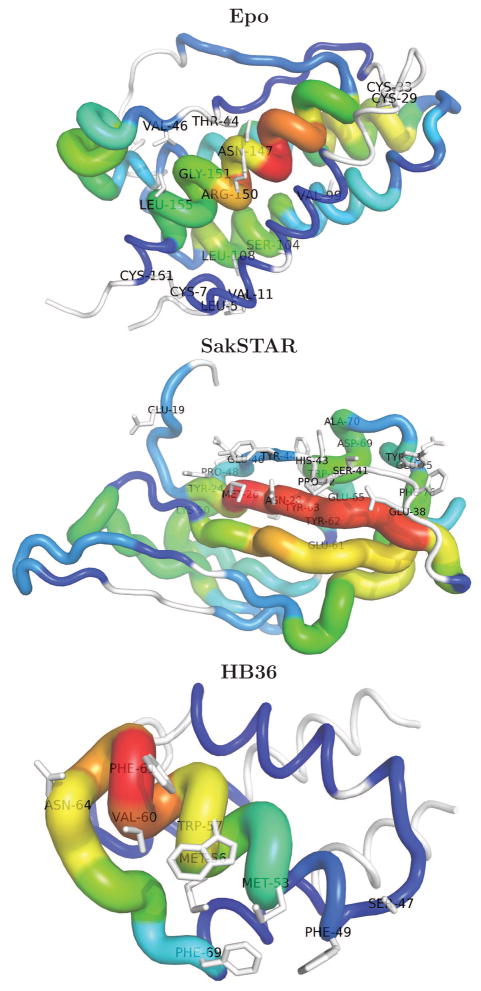
While simple in theory, there are several reasons that T cell epitope deletion has proven more difficult in practice. First, experimental determination of T cell epitopes can be prohibitively expensive and time consuming, as it requires synthesis of costly immunological assays on large panels of peptides that redundantly span a protein’s entire length.13,14 Second, unlike B cell epitopes that exist on the protein surface, T cell epitopes result from proteolytic processing and may therefore be located anywhere within a protein’s primary structure (Figure 1). Thus epitope deletion may require mutations both on the surface and in the close-packed core. Importantly, residues that anchor epitopes in the MHC pocket are often hydrophobic, and their substitution with hydrophilic residues, ideal for disrupting MHC binding, may destabilize the protein’s folded structure. With experimental approaches, such adverse outcomes are identified only in the final stages of the process. As a result, successful deimmunization invariably requires a large number of iterations, long periods of time, and an immense investment of resources.
Figure 1.
Predicted T cell epitope content of the case study targets, showing that epitopes are located throughout the proteins. The color and thickness of the sausage at each position is set according to the total number of epitopes (9mers × alleles) containing it; red > green > blue, with white regions predicted to have no epitopes. The functionally restricted residues (Table 1) are labelled and rendered in stick representation. The figures were generated using PyMol.59
The difficulty of experimentally identifying T cell epitopes can be mitigated by turning instead to computational MHC binding predictors,16–18 which have been successfully employed for deimmunization9,15,19,20 as well as vaccine design.21–23 The difficulty of ensuring protein stability upon mutation may likewise be addressed by sequence- or structure-based computational analysis of the effects of mutation on stability; we have previously integrated such stability evaluation with epitope predictors in support of biotherapeutic deimmunization.20,24–26 While our prior algorithms represent a substantial technological advance by virtue of their ability to simultaneously optimize proteins for both low immunogenicity and high stability and activity, they employ a deconstructive approach analogous to that of conventional T cell epitope deletion strategies. That is, they work backwards from a native protein template, deleting epitopes from the wild type sequence by introducing point mutations. In this paper, we tackle the problem from a very different direction, pursuing the bottom up redesign of proteins (i.e., choosing amino acid types for all residue positions simultaneously) so as to possess minimal epitope content.
Protein deimmunization is a multi-objective optimization problem that seeks to reduce immunogenicity while maintaining function.25,27 Here, we “lock down” identified functional residues and populate the remaining positions in a bottom up fashion while minimizing energy, thereby using low energy / structural stability as a proxy for maintenance of function. Our approach is based on the Rosetta flexible backbone design software,28 which has been successful in designing novel proteins.29–31 We combined Rosetta Design with an epitope scoring mechanism based on ProPred,32 a popular and successful T cell epitope predictor. By sufficiently weighting the epitope component of the score, we drive it to a minimal value while simultaneously obtaining low-energy designs. However, there is more to being “native-like” than just low energy. In the context of deimmunization, it is natural to mutate away from the hydrophobic amino acids that anchor epitopes, and to mutate towards negatively charged amino acids that are under-represented in immunogenic peptide fragments. While a few such mutations might be compatible with a stable protein fold, complete exclusion of epitopes requires counterbalancing the tendency to overly mutate in this manner. We have therefore found it necessary to extend the current design protocol with constraints to ensure maintenance of core hydrophobicity and overall charge.
We demonstrate our deimmunization design strategy on two proteins that have previously been targets of epitope deletion, erythropoietin (Epo)14 and staphylokinase (SakSTAR)12, along with a recently computationally designed flu-binding protein, HB3633. We further investigate the broad applicability of the method to a larger, diverse set of proteins. In all cases, we find that we are able to design away most of the predicted T cell epitopes while preserving key structural properties (energy, packing quality, core hydrophobicity, charge). Moreover, and analogous to the original implementation of Rosetta Design,34 which demonstrated that structure-based designs achieved relatively high sequence identity to their wild-type counterparts, we show here that we can identify high-quality, minimal-epitope protein designs having comparable levels of native sequence identity.
METHODOLOGY
Structure-Based Protein Redesign
We perform structure-based protein redesign using a customized, extended version of the protein design tools provided by the Rosetta suite (Version 3.4).35 In summary, a new amino acid sequence for a target backbone structure is designed by cycling between selection of the side-chains for the current backbone and prediction of the structure for the current amino acid sequence.36 The RosettaScripts flexible backbone design XML script37 iterates this process three times. While the provided script filters designs based on the packstat packing quality score,38 here we instead use the score as a quality measure in assessing different strategies, rather than fixing a threshold value. The entire process is reinitiated and repeated in order to generate a number of different designs for each target backbone (here we sample 30).
The default design process focuses on an energetic evaluation—seeking a set of side-chains that are low-energy for the target backbone such that the backbone is low-energy for the amino acid sequence. It is also common to incorporate a pseudo-energy term encapsulating the evolutionary acceptability of amino acid choices. We here incorporate an additional term seeking minimal T cell epitope content. Since this term can have the side effect of altering global hydrophobicity and charge profiles (see Results), we constrain amino acid choices to preserve the profiles of the wild type proteins. These design criteria are implemented as follows:
-
Deimmunization Evaluation of predicted T cell epitope content is implemented via a new InteractionGraph subclass in Rosetta. The interaction graph assesses each 9mer within a protein, using a sequence-based T cell epitope predictor to determine how many of the eight most common HLA-DR alleles (representing a majority of human populations world-wide39) are predicted to recognize the peptide. A proposed amino acid at a given position requires reevaluation of only the 9mers within the 17-residue window around the site. The total number of predicted binding events (9mers times alleles) is the “epitope score”, and is incorporated as a pseudo-energy at a weight of 1; in our tests, we have found this weight to be sufficient to result in minimal epitope content.
The ProPred32 epitope predictor has been used successfully in a number of experiments,40–42 including our own recent enzyme deimmunization work.20 Moreover, it has been shown to be one of the most effective predictors in benchmark studies,17 and we therefore utilize it in the current method, at a 5% threshold. We note, however, that our implementation is generic and can load other such pocket profile matrices from a file.
Charge constraint In the absence of prior knowledge of functionally acceptable mutations, the amino acids allowed at a position are constrained based on the wild-type amino acid. Only D and E may substitute for each other, and only H, K, and R may substitute for each other (note that we allow for the possibility of H being charged, but do not explicitly assess protonation state based on pH, microenvironment, or other detailed factors).
Evolutionary constraints A set of homologs and associated position-specific scoring matrices (PSSMs) are obtained by running PSI-BLAST43 against the non-redundant database (two iterations, e-value < 0.001). The PSSMs are incorporated with the weight of 1; in our tests, we have found this weight to be sufficient to push the designs substantially toward conservative substitutions.
In order to assess the impact of each of these design criteria, we perform a set of redesigns for each of the 23 = 8 combinations (with/without deimmunization, with/without charge constraint, with/without evolutionary constraints). A string of one-letter codes indicates a design strategy, with uppercase for using the criterion and lowercase for not; e.g., “DCe” is the deimmunization strategy with the charge constraint but without the evolutionary constraints. In the results we focus on the comparison between dcE (the Rosetta default design without the charge constraint accompanied with PSSM) and DCE (the deimmunized Rosetta design with the constraint and PSSM).
Targets
We start with case study applications of our design strategies to three proteins that are of potential therapeutic use. Warmerdam et al.12 sought to delete epitopes in the SakSTAR variant of staphylokinase, a bacterially-derived thrombolytic agent potentially useful for treating heart attacks and strokes. They used T cell proliferation assays to identify an immunogenic region, followed by alanine scanning mutagenesis to identify mutations that reduced immunogenicity in the engineered peptides (but they did not engineer and test entire protein variants). Tangri et al.14 targeted erythropoietin (Epo), a treatment for anemia that, while of human origin, is known to cause an immune response in some patients.44 By extensive assays of overlapping peptides, they identified two highly immunogenic regions and engineered four variants targeting the anchor residues of T cell epitopes in these regions. Finally, Fleishman et al.33 used Rosetta to develop a novel protein, HB36, designed to bind the influenza hemagglutinin of the 1918 H1N1 pandemic virus. While it has not yet been subjected to deimmunization efforts, prospective therapeutic use might require such work.
The wild-type protein complexes are as follows (illustrated in Supporting Figure 1): Epo, PDB code 1EER, chain A; SakSTAR, 2SAK, chain A; HB36, 3R2X, chain C. Functional, bound forms of the protein structures are used, except for SakSTAR for which the unbound structure that we use has a higher resolution (1.8Å) than the bound form (1BUI, chain C, 2.65Å) while maintaining C α RMSD < 1.38Å (TM score: 0.92). For all three targets, we “lock down” the positions where mutations are likely to disrupt or impair function, requiring that the locked residues be either the wild-type or a mutation previously shown to maintain function.33,45–47 Note that a functional restriction overrides the charge constraint. Table 1 lists the functionally restricted residues.
Table 1.
Lists of functionally restricted residues for the case study proteins. Mutable residues are also listed for Epo. These acceptable mutations override the charge constraint.
| SakSTAR | HB36 | Epo | |
|---|---|---|---|
|
| |||
| Fixed | Fixed | Fixed | Restricted |
|
| |||
| 19E, 24Y, 26M, 28N, 38E, 41S, 42P, 43H, 44Y, 46E, 48P, 50K, 61E, 62Y, 63Y, 65E, 66W, 69D, 70A, 73Y, 75E, 76F | 47S, 49F, 53M, 56M, 57W, 60V, 61F, 64N, 69F | 5L, 7C, 11V, 29C, 33C, 44T, 46V, 99V, 104S, 108L, 147N, 150R, 151G, 155L, 161C | D8DS, S9SAN, R10RA, E13EA, R14RL, Y15YF, L16LAS, L17LAS, K20KIRA, K24KN, K38KN, K45KAR, N47NA, F48FAS, Y49YFS, K52KSRQ, Q78QAER, K83KN, D96DA, K97KR, S100SA, R103RK, T107TALS, R110RT, R131RT, K140KMART, R143RE, K154KARS |
We follow the case studies with a test of the general applicability of our design methodology using a larger, diverse benchmark set of 52 proteins obtained as follows (PDB codes are listed in the Supporting Table 1). Soluble protein chains were extracted using PISCES48 under the following criteria: < 25% sequence identity, resolution < 2Å and R-factor < 0.2. Membrane proteins were collected from PDBTM,49 and PSI-BLAST (3 iterations) was run so as to identify any potential membrane proteins in the current PDB (e-value < 0.001). These potential membrane proteins were eliminated from the PISCES list. Chains that were discontinuous (including with 0 atom occupancy in the backbone atoms) or contained nonstandard amino acids were also discarded. Finally, proteins with multiple chains or ligands were discarded.
Design Evaluation
In addition to having minimal epitope content (for strategies with deimmunization), a redesigned protein should “look natural”. We evaluate how well that goal has been achieved with several measures:
energy, according to the Rosetta energy
packing quality, according to the packstatscore in Rosetta; very high resolution X-ray structures (sub 1.0Å) have scores > 0.6.
structural distortion from target backbone, according to TM-score;50 > 0.5 generally indicates the same fold and > 0.8 almost perfectly agrees with SCOP51 and CATH52 fold classifications53
core hydrophobicity compared to wild-type proteins, according to the Kyte-Doolitle measure.54 Core residues are determined as those with absolute solvent accessiblity < 20 according to the DSSP program.55
charge conservation, according to counts of charged residues
native sequence recovery (i.e., sequence identity to wild-type), as implemented by sequence recovery in Rosetta; the initial work by Kuhlman and Baker showed 27% native sequence recovery overall and 51% in the core34
For the benchmark set, as a complement to packing quality assessment by packstat, we also identify cavities in the core by counting how many water molecules can fit. The algorithm is as follows: (1) define core residues as above; (2) place water molecules around the core residues using HOLLOW56,57 (grid spacing of 0.2Å and probe size of 1.4 Å); (3) remove water molecules clashing with atoms from non-core residues; (4) cluster water molecules. Supporting Figure 7(top) illustrates.
Since the wild-type target proteins are not necessarily optimal for the Rosetta score function, the relax application was used to minimize them prior to evaluation. As with designs, 30 models were generated.
Epitope Analysis
To study characteristics of predicted epitopes in natural proteins, a set of 7,111 chains was collected in a manner similar to that described above for the larger test set, except that the PISCES criteria were relaxed to a resolution < 3Å and R-factor < 0.3, and multi-chained and liganded proteins were allowed. Each 9mer was extracted and classified as an epitope fragment (recognized by any of the 8 alleles according to ProPred at a 5% threshold) or not. Solvent accessibility was determined as described above, and a solvent accessibility profile (SA profile) was created for each fragment. A fragment thus has both a sequence (e.g., IVLDKTTAS) and a SA profile (e.g., FTTTTTTFT, F: Buried and T: Surface). If a pair of epitope fragments had the same sequence and SA profile, only one fragment was kept. This yielded 248,660 epitopes and 1,291,126 non-epitopes.
RESULTS
Case Studies
Overview
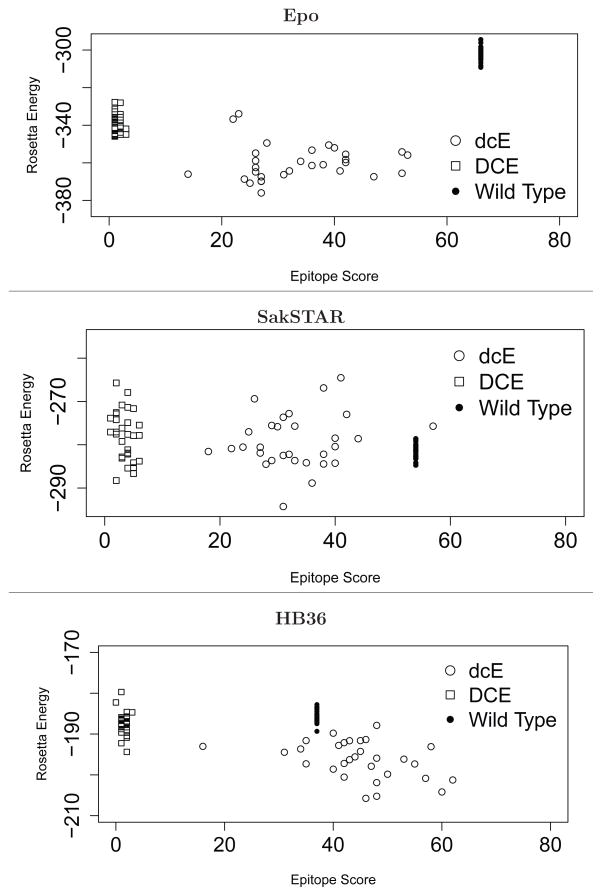
We start by contrasting wild-type proteins, default designs (dcE), and deimmunized designs (DCE), in terms of the two primary design criteria: epitope score and energy. As Figure 2 shows, the deimmunized designs achieve minimal predicted epitope content while maintaining energies comparable to wild-type (though not as good as the default designs, which only seek to minimize energy). SakSTAR is the most difficult target, as 22 out of 122 residues are fixed.
Figure 2.
Scatter plots of 30 each default designs (deE), deimmunized designs (DCE), and relaxed wild-type proteins.
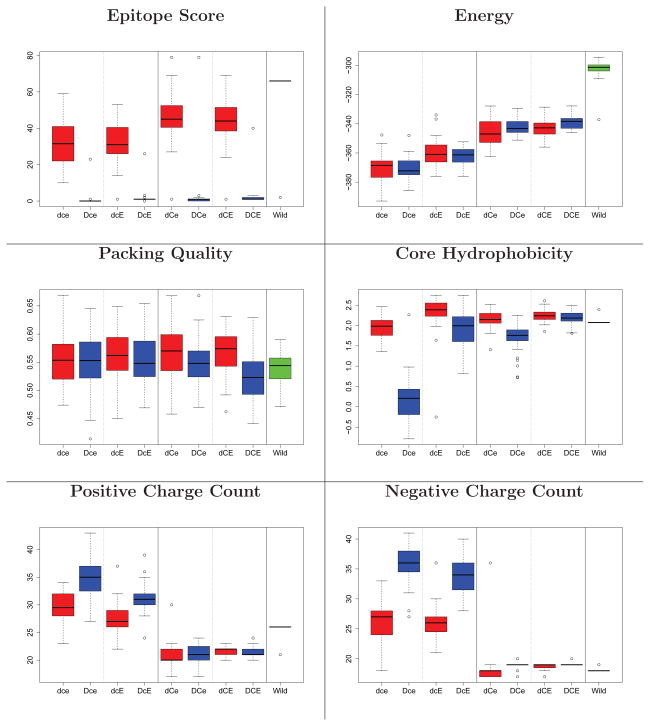
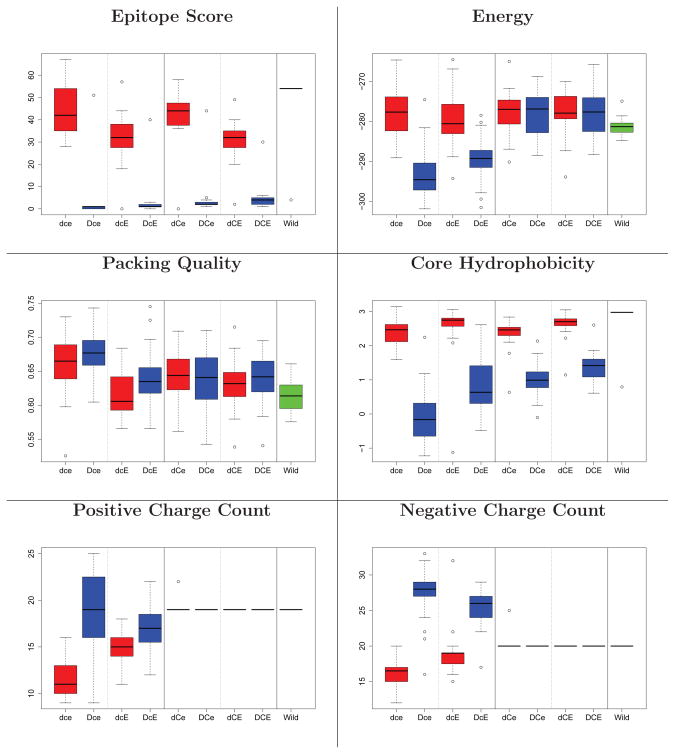
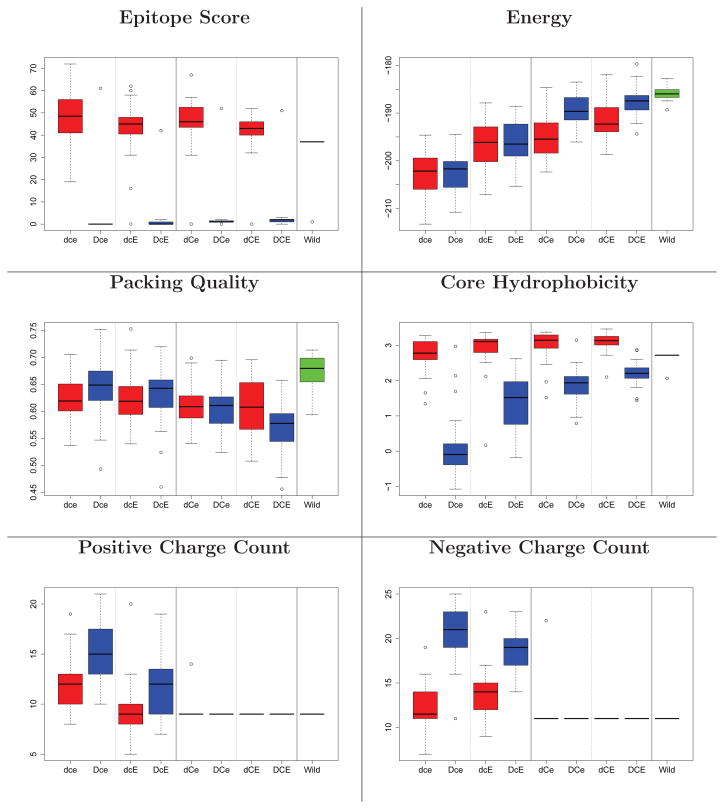
Figure 3, 4, and 5 illustrate the main evaluations of the designs produced by all 8 different strategies. In the deimmunized designs (D**), nearly all epitopes are deleted, while in the non-deimmunized designs, they stay at wild-type values except for Epo. In all cases, Rosetta energy values stay comparable to the wild-type ones. Deimmunized designs without the charge and evolutionary constraints (Dce) suffer in terms of core hydrophobicity and charge counts, while those with them maintain levels comparable to wild-type. All designed models are well-packed, and the backbone is not substantially distorted (Supplementary Figure 2).
Figure 3.
Structural evaluation of Epo designs. Box plots are taken over 30 designs. Red: non-deimmunized (d**); blue: deimmunized (D**); green, far right: wild-type. Panels 1&2 for each metric: no charge filter (*c*); 3&4: filter (*C*). Panels 1&3: no evolutionary constraint (**e); 2&4: evolutionary constraint (**E). For the results of TM score and hydrophobicity on surface, see Supporting Figure 2.
Figure 4.
Structural evaluation of SakSTAR designs (see Figure 3).
Figure 5.
Structural evaluation of HB36 designs (see Figure 3).
Table 2 summarizes the native sequence recovery (i.e., sequence identities between designs and wild-types). The use (**E) or non-use (**e) of evolutionary constraints has a substantial effect on sequence recovery, especially in core regions. The charge constraint (*C*) improves sequence recovery on the surface. While Kuhlman and Baker34 found 27% overall native sequence recovery with 51% in the core, that was for a different set of proteins with a different version of Rosetta. Here our “dce” approach represents the default Rosetta Design. We note that the counterpart deimmunized designs without evolutionary constraints (“DCe”) actually achieve better overall sequence recovery, though they are worse in the core. The incorporation of evolutionary information in deimmunization (“DCE”), which we would recommend, results in even better recovery (52.2 ~ 69.3% overall and 45.7 ~ 51.2% in the core).
Table 2.
Average native sequence recovery for case study proteins under each design strategy.
| dce | Dce | ||||||
|---|---|---|---|---|---|---|---|
|
| |||||||
| Overall | Core | Surface | Overall | Core | Surface | ||
|
| |||||||
| SakSTAR | 51.2% | 47.4% | 50.4% | SakSTAR | 39.8% | 25.9% | 41.5% |
| Epo | 29.9% | 35.7% | 25.9% | Epo | 26.0% | 20.3% | 25.9% |
| HB36 | 35.9% | 61.4% | 29.0% | HB36 | 27.5% | 43.3% | 26.6% |
|
| |||||||
| dCe | DCe | ||||||
|
| |||||||
| Overall | Core | Surface | Overall | Core | Surface | ||
|
| |||||||
| SakSTAR | 61.0% | 42.6% | 69.1% | SakSTAR | 52.8% | 26.7% | 57.5% |
| Epo | 34.5% | 35.8% | 31.1% | Epo | 34.9% | 35.2% | 33.1% |
| HB36 | 45.9% | 57.1% | 41.2% | HB36 | 40.8% | 40.0% | 41.9% |
|
| |||||||
| dcE | DcE | ||||||
|
| |||||||
| Overall | Core | Surface | Overall | Core | Surface | ||
|
| |||||||
| SakSTAR | 65.2% | 75.2% | 65.7% | SakSTAR | 59.8% | 48.1% | 63.9% |
| Epo | 49.4% | 58.1% | 46.1% | Epo | 48.6% | 52.5% | 46.7% |
| HB36 | 50.9% | 64.8% | 49.1% | HB36 | 47.8% | 51.9% | 49.1% |
|
| |||||||
| dCE | DCE | ||||||
|
| |||||||
| Overall | Core | Surface | Overall | Core | Surface | ||
|
| |||||||
| SakSTAR | 74.8% | 75.6% | 80.3% | SakSTAR | 69.3% | 48.1% | 76.8% |
| Epo | 53.1% | 55.1% | 52.0% | Epo | 52.2% | 51.2% | 50.6% |
| HB36 | 58.9% | 61.0% | 61.7% | HB36 | 55.7% | 45.7% | 60.5% |
Epothropoietin (Epo)
In the previous research by Tangri et al.,14 two immunogenic regions in Epo were identified, spanning residues 101–115 and 136–150. Four variants were engineered to specifically target the anchor regions of identified T cell epitopes: L102P/S146D (named G2), T107D/S146D (G3), L102G/T107D/S146D (G4), and L102S/T107D/S146D (G5). G3 and G4 reduced immune responses whereas G2 and G5 were not active. While Tangri et al. focused on L102 and S146 for the epitopes, Parker et al.26 computationally designed putative deimmunized variants by mutating mainly F138 (to A), F142 (to A), and L149 (to Q) as those mutations may eliminate HLA anchor residues while making a good tradeoff with the AMBER force field energy.
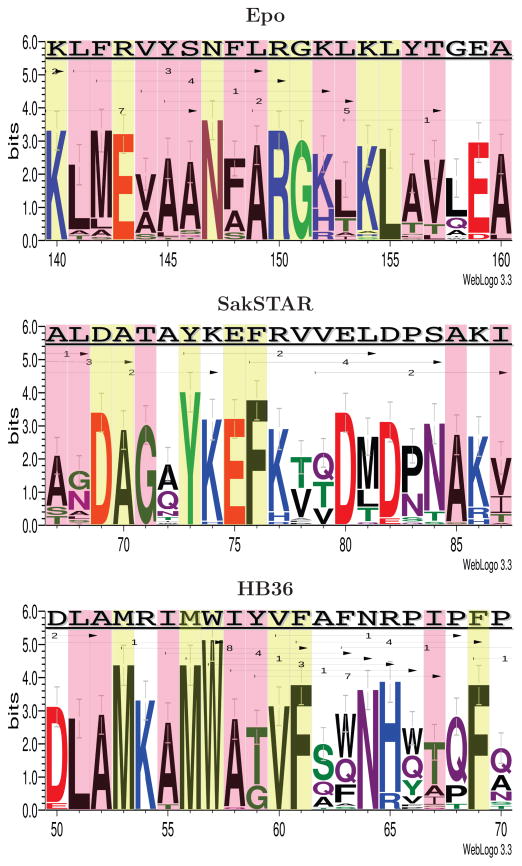
ProPred epitope prediction indicates that there are a large number of epitopes in the two immunogenic regions, especially within 140–160. Figure 6 summarizes that region in terms of the wild-type sequence and epitopes, along with amino acids chosen among the 30 deimmunized designs (see Supporting Figure 3 for the full protein). Within that region (KLFRVYSNFLRGKLKLYTGEA, total epitope score 15) the designs consistently delete all epitopes, while preserving an average of 50% identity to the wild-type sequence. The designs are generally consistent, choosing the same amino acids for most of the positions. We see that alanine is the most frequent choice for the hydrophobic core residues, and yet permits adequate repacking of the core (as evidenced by packing quality and TM-scores discussed above). All designs incorporate alanine at L149 and quite frequently at Y145 and S146, which were also targeted by Tangri et al. and Parker et al.. In contrast, Tangri et al. introduce a number of charges, perhaps locally acceptable but disallowed by our (conservative) constraint to ensure global acceptability. Likewise, Parker et al. employ changes in charge (e.g., K140E). Note that we allow the charge-changing R143E due to prior data (see again Table 1).
Figure 6.
Comparison between the wild-type sequences and the deimmunized designs for Epo, SakSTAR, and HB36. The logo representations are from 30 deimmunized models using the DCE strategy. Red boxes indicate core residues and yellow boxes are functionally restricted regions (Table 1). The top sequences are the wild-types. Each arrow indicates an epitope, labeled with its epitope score in the wild-type. The deimmunized proteins have a minimal number of epitopes on average in those regions (Epo: 0, SakSTAR: 0.23, and HB36: 1.1). The logos were generated using Weblogo.60
Staphylokinase (SakSTAR)
Warmerdam et al.12 found the C3 region of SakSTAR (residues 71–87) to be highly immunogenic and employed alanine mutagenesis to identify deimmunizing positions. From this analysis, they arrived at several designs: R77A/E80A, R77A/E80A/D82A, and K74Q/R77S/E80S/D82S. Parker et al.26 consistently chose F76K, as the C3 region is mostly buried and this single mutation improves energy as well the epitope score. They additionally focused on another highly immunogenic region, which they named Beta, spanning residues 24–38. There they identified several designs using primarily Y24H, M26S, and T30K as deimmunizing mutations.
We found that residues of C3 and Beta are either buried or involved in binding. As any residues related to binding were functionally restricted (Table 1), the only allowed mutations are those of buried residues. Due to such restrictions, the epitope scores are generally higher than for other targets although still ≈10-fold lower than wild type (Figure 2 and 4). Figure 6 details a window around C3 (for the entire protein, see Supporting Figure 4).
In the C3 region, the wild type sequence (TAYKEFRVVELDPSAKI) has a total epitope score of 8. 23 out of the 30 deimmunized SakSTAR models show zero epitopes in the region, with 0.23 epitopes on average over all 30. The designs display more variability than for Epo, as there are fewer functionally restricted and core residues in the latter. We see glutamine substitutions that are not included in the PSSM at A72 and V79. This may result in the less hydrophobic cores.
Influenza Hemagglutinin Binding Protein (HB36)
HB36 was originally developed as a novel protein computationally designed to bind influenza hemagglutinin33 and subsequently experimentally optimized for affinity and specificity.58 As a flu-binding protein, it (or a relative designed in an analogous manner) has prospective utility as a therapeutic agent. ProPred analysis, however, shows that it possesses an especially high epitope content (Figure 1, Figure 6, and Supporting Figure 5), particularly in the region spanning residues 53–69. While it would be advantageous to include deimmunization in the original design process (simultaneous with affinity and specificity), we pursue here a post hoc deimmunization approach, locking down the functionally important residues as described above.
Focusing on the highly immunogenic 53–69 segment (Figure 6), the wild-type has a total epitope score of 29, while the designs exhibit an average of only 1.1 epitopes while yielding 51.4% wild-type sequence identity in the region. The most variable region, 62–66, is largely populated with amino acids that are represented in the PSSM (e.g., A62 and N64) and that satisfy charge constraints (e.g., HR65). We note that alanine is again frequently observed in the core residues (L51 and I55) and glutamine is in the non-core residues (A63, F64, P66, P67 and P70).
Benchmark Set
For the larger-scale benchmark study on a more diverse set of proteins, we focus on the default (dcE) and charge-constrained deimmunization design (DCE), as these generally performed best in our case studies.
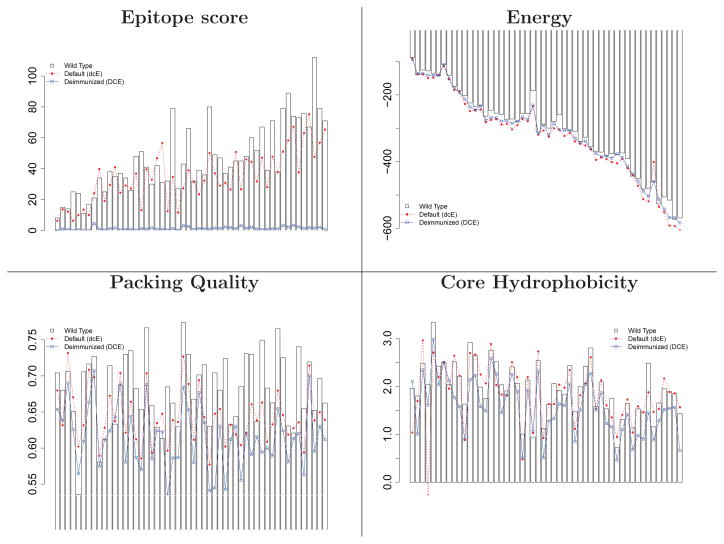
Figure 7 and Supporting Figure 6 illustrate evaluation metrics averaged over the 30 designs for each target, in order by sequence length. As with the case study targets, the deimmunization strategy successfully produces designs of minimal epitope content, with energies comparable to wild-type and the default strategy. The difference in epitope score becomes larger as the sequence gets longer, but the relative energies do not deteriorate. Core hydrophobicity and overall charge are maintained by both strategies, except for one case under the default design (1NKD, a helical dimer with very few buried residues).
Figure 7.
Structural evaluation of the Rosetta default design (dcE) and the deimmunized design (DCE) on the benchmark set. The 52 targets are sorted along the x-axis by sequence length. Barplot: wild-type; red broken line: non-deimmunized (dcE); blue solid line: deimmunized (DCE). For the results of TM score, surface hydrophobicity, and charges, see Supporting Figure 6.
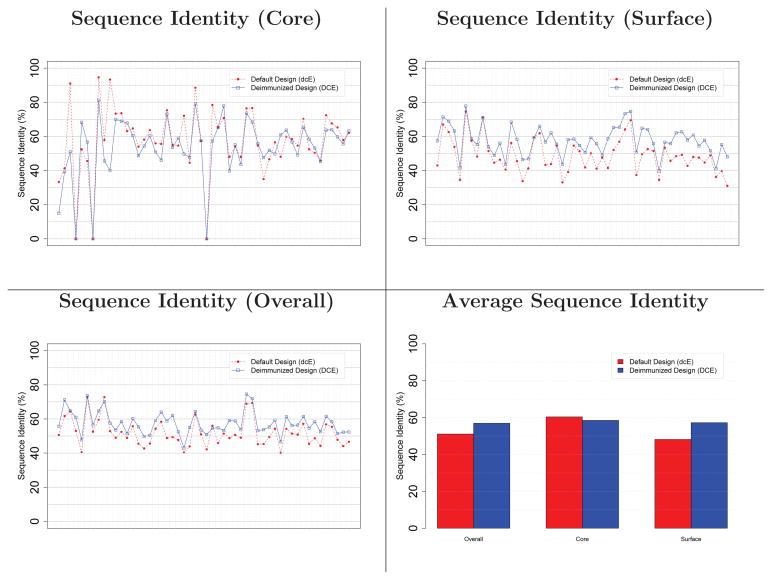
The deimmunized designs have slightly higher overall native sequence recovery (57%) than the default designs (51%), trading off core (58% vs. 60%) and surface (57% vs. 48%) where surface residues constitute a larger fraction of total protein sequence; see Figure 8. As observed for the case studies, these numbers are similar to those of Kuhlman and Baker (though on different datasets), and most importantly, they show that the minimal-epitope sequence space is large enough to admit high-quality designs with relatively high sequence identity to wild-type.
Figure 8.
Native sequence recovery for default and deimmunized designs, averaged over the benchmark proteins. The 52 targets are sorted along the x-axis by sequence length.
The benchmark study also shows (Figure 9) that the most frequent deimmunizing substitutions are to alanine in the core and glutamine on the surface. The structures are still predicted to appropriately repack (packstat scores in Figure 7 and TM scores in Supporting Figure 6). To further assess whether these substitutions might yield cavities in the core, we checked for the fit of water molecules as described in the Methodology section. See Supporting Figure 7. Generally the number of potential cavities increases with sequence length. For short proteins, the default and deimmunized designs, along with the wild-type proteins (minimized by Rosetta), accommodate nearly the same number of water molecules in the core. The difference becomes larger as the protein gets longer, but the deimmunized designs are still comparable to the Rosetta default design strategy.
Figure 9.
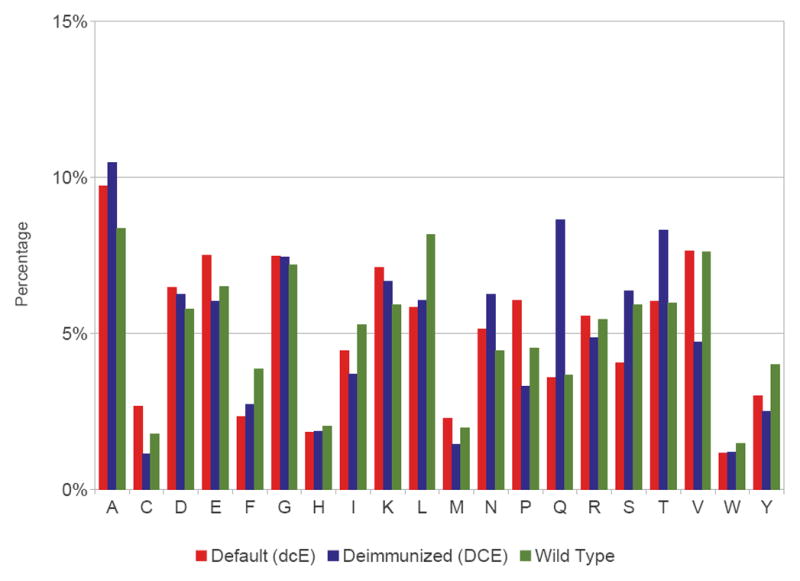
Frequency of amino acid usage in the benchmark targets for default designs (dcE), deimmunized designs (DCE), and wild-types.
We weighted the epitope score in the Rosetta potential so as to produce designs of minimal epitope content. To assess the trade-off between epitope score and other design properties, we further tested the deimmunized design strategy (DCE) with lower epitope score weights of 0.1, 0.2 and 0.5. As expected, we find (Supporting Figure 8) that lowering the weight indeed drives the designs to have characteristics more like those of the default designs (dcE) or wild types with correspondingly higher epitope scores.
Charge and Hydrophobicity
Our bottom-up deimmunization strategy requires charge and evolutionary constraints on allowed mutations in order to preserve the amino acid profiles of wild-type proteins. This is a natural consequence of the binding preferences of HLA pockets for specific types of residues, with hydrophobic residues generally preferable and negatively charged residues less preferred. Whereas conventional epitope deletion strategies make only a relatively small number of mutations, which may therefore be more radical in nature, our bottom up method repopulates the majority of amino acids, thereby necessitating a constraint to counter-balance excessive exploitation of HLA binding preferences.
To explicate the overall effects of the HLA pocket preferences, as encapsulated in the ProPred profiles, we investigated the amino acid content of a large number of predicted epitopes and non-epitopes. We computed the representation of an amino acid by comparing its observed frequency in epitopes vs. that expected from non-epitope 9mers: (observed -expected) / expected. See Figure 10. In general, negatively charged amino acids (D and E) are under-represented whereas most hydrophobic amino acids (F, I, L, M, V, and W) are over-represented. Deimmunization without the charge and evolutionary constraints thus tends to introduce more negatively charged residues and replace hydrophobic residues with hydrophilic ones, as observed in the results.
Figure 10.
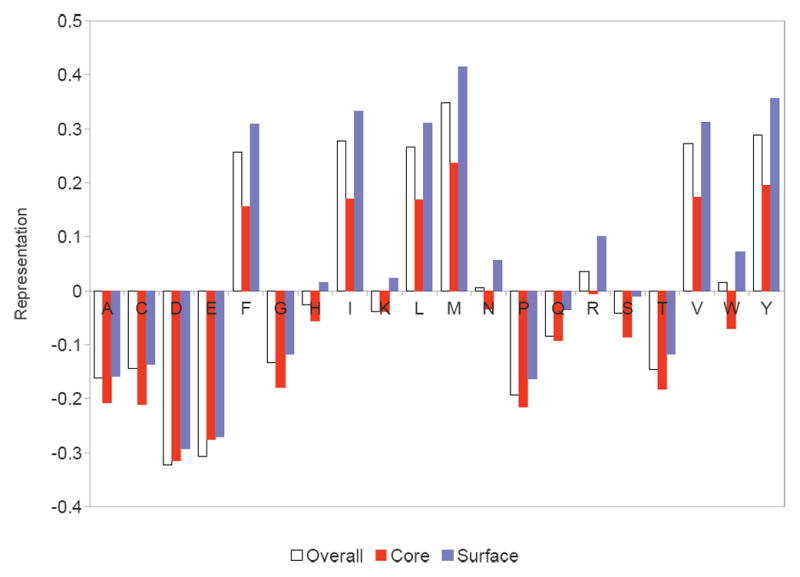
Over-/under-representations of amino acids in predicted epitopes. Hydrophobic amino acids are mostly over-represented except for alanine, while negatively charged ones are under-represented.
CONCLUSION
We have illustrated a computational method that produces therapeutic protein designs predicted to have minimal T cell epitope content while still preserving beneficial structural properties (energy, packing quality, hydrophobicity, charge) and native sequence recovery. Strikingly, the minimal-epitope designs are nearly as “native-like” as the default designs. Structure-based design of entire proteins has been successfully applied in a number of exciting applications, but extending such protocols to deimmunization requires appropriate handling of the complex interactions between energetic models, epitope content, and overall sequence and structural properties. It is perhaps surprising that the available sequence space admits solutions that simultaneously satisfy such disparate concerns, but these preliminary studies suggest the intriguing potential for developing biotherapeutics that are in some sense invisible to the immune system.
Supplementary Material
Acknowledgments
This work is supported by NIH grants R01-GM-098977 and R21-AI-098122. Thanks to Miles Campbell (Hanover High School, New Hampshire) for developing the PyMOL scripts for epitope visualization.
Footnotes
Program Availability
The supplementary material contains example Rosetta-based scripts to perform the different design strategies. C++ source code to patch Rosetta for epitope scoring and minimization is available by request and will be submitted to the Rosetta Commons.
References
- 1.Nat Med. 2012;18:636. [Google Scholar]
- 2.Aggarwal S. Nat Biotechnol. 2011;29:1083–1089. doi: 10.1038/nbt.2060. [DOI] [PubMed] [Google Scholar]
- 3.Jones P, Dear P, Foote J, Neuberger M, Winter G. Nature. 1986;321:522–525. doi: 10.1038/321522a0. [DOI] [PubMed] [Google Scholar]
- 4.Hwang W, Foote J. Methods. 2005;36:3–10. doi: 10.1016/j.ymeth.2005.01.001. [DOI] [PubMed] [Google Scholar]
- 5.Jakobovits A, Amado R, Yang X, Roskos L, Schwab G. Nat Biotechnol. 2007;25:1134–1143. doi: 10.1038/nbt1337. [DOI] [PubMed] [Google Scholar]
- 6.Bradbury A, Sidhu S, Dübel S, McCafferty J. Nat Biotechnol. 2011;29:245–254. doi: 10.1038/nbt.1791. [DOI] [PMC free article] [PubMed] [Google Scholar]
- 7.Kontos S, Hubbell J. Chem Soc Rev. 2012;41:2686–2695. doi: 10.1039/c2cs15289d. [DOI] [PubMed] [Google Scholar]
- 8.Schellekens H. Nature Reviews Drug Discovery. 2002;1:457–462. doi: 10.1038/nrd818. [DOI] [PubMed] [Google Scholar]
- 9.De Groot A, Knopp P, Martin W. Dev Biol (Basel) 2005;122:171–94. [PubMed] [Google Scholar]
- 10.De Groot A, Martin W. Clinical Immunology. 2009;131:189–201. doi: 10.1016/j.clim.2009.01.009. [DOI] [PubMed] [Google Scholar]
- 11.De Groot A, Cohen T, Moise L, Martin W. ESACT Proceedings. 2012;5:525–534. [Google Scholar]
- 12.Warmerdam P, Plaisance S, Vanderlick K, Vandervoort P, Brepoels K, Collen D, De Maeyer M. J Thromb Haemost. 2002;87:666–673. [PubMed] [Google Scholar]
- 13.Harding F, Liu A, Stickler M, Razo O, Chin R, Faravashi N, Viola W, Graycar T, Yeung V, Aehle W, Meijer D, Wong S, Rashid M, Valdes A, Schellenberger V. Mol Cancer Ther. 2005;4:1791–1800. doi: 10.1158/1535-7163.MCT-05-0189. [DOI] [PubMed] [Google Scholar]
- 14.Tangri S, Mothe B, Eisenbraun J, Sidney J, Southwood S, Briggs K, Zinckgraf J, Bilsel P, Newman M, Chesnut R, LiCalsi C, Sette A. J Immunol. 2005;174:3187–3196. doi: 10.4049/jimmunol.174.6.3187. [DOI] [PubMed] [Google Scholar]
- 15.Moise L, Song C, Martin W, Tassone R, De Groot A, Scott D. Clinical Immunology. 2012;142:320–331. doi: 10.1016/j.clim.2011.11.010. [DOI] [PMC free article] [PubMed] [Google Scholar]
- 16.Tong J, Tan T, Ranganathan S. Brief Bioinform. 2007;8:96–108. doi: 10.1093/bib/bbl038. [DOI] [PubMed] [Google Scholar]
- 17.Wang P, Sidney J, Dow C, Mothe B, Sette A, Peters B. PLoS Comp Biol. 2008;4:e1000048. doi: 10.1371/journal.pcbi.1000048. [DOI] [PMC free article] [PubMed] [Google Scholar]
- 18.Zhang L, Udaka K, Mamitsuka H, Zhu S. Brief Bioinform. 2012;13:350–364. doi: 10.1093/bib/bbr060. [DOI] [PubMed] [Google Scholar]
- 19.Cantor J, Yoo T, Dixit A, Iverson B, Forsthuber T, Georgiou G. PNAS. 2011;108:1271–1277. doi: 10.1073/pnas.1014739108. [DOI] [PMC free article] [PubMed] [Google Scholar]
- 20.Osipovitch D, Parker A, Makokha C, Desrosiers J, Kett W, Moise L, Bailey-Kellogg C, Griswold K. Protein Eng Des Sel. 2012 doi: 10.1093/protein/gzs044. [DOI] [PMC free article] [PubMed] [Google Scholar]
- 21.Fischer W, Perkins S, Theiler J, Bhattacharya T, Yusim K, Funkhouser R, Kuiken C, Haynes B, Letvin N, Walker B, Hahn B, Korber B. Nat Med. 2006;13:100–106. doi: 10.1038/nm1461. [DOI] [PubMed] [Google Scholar]
- 22.Moise L, amd McMurry J, Buus S, Frey S, Martin W, De Groot A. Vaccine. 2009;27:6471–6479. doi: 10.1016/j.vaccine.2009.06.018. [DOI] [PMC free article] [PubMed] [Google Scholar]
- 23.De Groot A, Levitz L, Ardito M, Skowron G, Mayer K, Buus S, Boyle C, Martin W. Hum Vaccin Immunother. 2012;8:987–1000. doi: 10.4161/hv.20528. [DOI] [PubMed] [Google Scholar]
- 24.Parker A, Zheng W, Griswold K, Bailey-Kellogg C. BMC Bioinf. 2010;11:180. doi: 10.1186/1471-2105-11-180. [DOI] [PMC free article] [PubMed] [Google Scholar]
- 25.Parker A, Griswold K, Bailey-Kellogg C. J Bioinf Comput Biol. 2011;9:207–229. doi: 10.1142/s0219720011005471. [DOI] [PubMed] [Google Scholar]
- 26.Parker A, Griswold K, Bailey-Kellogg C. Research in Computational Molecular Biology. 2012;7262:184–198. [Google Scholar]
- 27.He L, Friedman A, Bailey-Kellogg C. Proteins. 2012;80:790–806. doi: 10.1002/prot.23237. [DOI] [PMC free article] [PubMed] [Google Scholar]
- 28.Huang P, Ban YA, Richter F, Andre I, Vernon R, Schief WR, Baker D. PLoS One. 2011;6:e24109. doi: 10.1371/journal.pone.0024109. [DOI] [PMC free article] [PubMed] [Google Scholar]
- 29.Kuhlman B, Dantas G, Ireton G, Varani G, Stoddard B, Baker D. Science. 2003;302:1364–1368. doi: 10.1126/science.1089427. [DOI] [PubMed] [Google Scholar]
- 30.Correia B, Ban Y, Friend D, Ellingson K, Xu H, Boni E, Bradley-Hewitt T, Bruhn-Johannsen J, Stamatatos L, Strong R, Schief W. J Mol Biol. 2011;405:284–297. doi: 10.1016/j.jmb.2010.09.061. [DOI] [PubMed] [Google Scholar]
- 31.Sammond D, Bosch D, Butterfoss G, Purbeck C, Machius M, Siderovski D, Kuhlman B. J Am Chem Soc. 2011;133:4190–4192. doi: 10.1021/ja110296z. [DOI] [PMC free article] [PubMed] [Google Scholar]
- 32.Singh H, Raghava G. Bioinformatics. 2001;17:1236–1237. doi: 10.1093/bioinformatics/17.12.1236. [DOI] [PubMed] [Google Scholar]
- 33.Fleishman S, Whitehead T, Ekiert D, Dreyfus C, Corn J, Strauch E, Wilson I, Baker D. Science. 2011;332:816–821. doi: 10.1126/science.1202617. [DOI] [PMC free article] [PubMed] [Google Scholar]
- 34.Kuhlman B, Baker D. PNAS. 2000;97:10383–10388. doi: 10.1073/pnas.97.19.10383. [DOI] [PMC free article] [PubMed] [Google Scholar]
- 35.Leaver-Fay A, Tyka M, Lewis S, Lange O, Thompson J, Jacak R, Kaufman K, Renfrew P, Smith C, Sheffler W, Davis I, Cooper S, Treuille A, Mandell D, Richter F, Ban Y, Fleishman S, Corn J, Kim D, Lyskov S, Berrondo M, Mentzer S, Popovic Z, Havranek J, Karanicolas J, Das R, Meiler J, Kortemme T, Gray J, Kuhlman B, Baker D, Bradley P. Methods Enzymol. 2011;487:545–574. doi: 10.1016/B978-0-12-381270-4.00019-6. [DOI] [PMC free article] [PubMed] [Google Scholar]
- 36.Butterfoss G, Kuhlman B. Annu Rev Biophys Biomol Struct. 2006;35:49–65. doi: 10.1146/annurev.biophys.35.040405.102046. [DOI] [PubMed] [Google Scholar]
- 37.Fleishman S, Leaver-Fay A, Corn J, Strauch E, Khare S, Koga N, Ashworth J, Murphy P, Richter F, Lemmon G, Meiler J, Baker D. PLoS One. 2011;6:e20161. doi: 10.1371/journal.pone.0020161. [DOI] [PMC free article] [PubMed] [Google Scholar]
- 38.Sheffler W, Baker D. Protein Science. 2009;18:229–239. doi: 10.1002/pro.8. [DOI] [PMC free article] [PubMed] [Google Scholar]
- 39.Southwood S, Sidney J, Kondo A, del Guercio M, Appella E, Hoffman S, Kubo R, Chesnut R, Grey H, Sette A. J Immunol. 1998;160:3363–3373. [PubMed] [Google Scholar]
- 40.Dinglasan R, Kalume D, Kanzok S, Ghosh A, Muratova O, Pandey A, Jacobs-Lorena M. PNAS. 2007;104:13461–13466. doi: 10.1073/pnas.0702239104. [DOI] [PMC free article] [PubMed] [Google Scholar]
- 41.Klyushnenkova E, Kouiavskaia D, Kodak J, Vandenbark A, Alexander R. Prostate. 2007;67:1019–1028. doi: 10.1002/pros.20575. [DOI] [PubMed] [Google Scholar]
- 42.Mustafa A, Shaban F. Tuberculosis. 2006;86:115–124. doi: 10.1016/j.tube.2005.05.001. [DOI] [PubMed] [Google Scholar]
- 43.Altschul S, Madden T, Schaffer A, Zhang J, Zhang Z, Miller W, Lipman D. Nucl Acids Res. 1997;25:3389–3402. doi: 10.1093/nar/25.17.3389. [DOI] [PMC free article] [PubMed] [Google Scholar]
- 44.Indiveri F, Murdaca G. Rev Clin Exp Hematol. 2002;1:7–11. [PubMed] [Google Scholar]
- 45.Syed R, Reid S, Li C, Cheetham J, Aoki K, Liu B, Zhan H, Osslund T, Chirino A, Zhang J, Finer-Moore J, Elliott S, Sitney K, Katz B, Matthews D, Wendoloski J, Egrie J, Stroud R. Nature. 1998;395:511–516. doi: 10.1038/26773. [DOI] [PubMed] [Google Scholar]
- 46.Parry M, Fernandez-Catalan C, Bergner A, Huber R, Hopfner K, Schlott B, Guhrs K, Bode W. Nat Struct Biol. 1998;5:917–923. doi: 10.1038/2359. [DOI] [PubMed] [Google Scholar]
- 47.Rabijns A, De Bondt H, De Ranter C. Nat Struct Biol. 1997;4:357–360. doi: 10.1038/nsb0597-357. [DOI] [PubMed] [Google Scholar]
- 48.Wang G, Dunbrack RJ. Nucl Acids Res. 2005;33:W94–W98. doi: 10.1093/nar/gki402. [DOI] [PMC free article] [PubMed] [Google Scholar]
- 49.Tusnady G, Dosztanyi Z, Simon I. Nucl Acids Res. 2005;33:D275–D278. doi: 10.1093/nar/gki002. [DOI] [PMC free article] [PubMed] [Google Scholar]
- 50.Zhang Y, Skolnick J. Proteins. 2004;57:702–710. doi: 10.1002/prot.20264. [DOI] [PubMed] [Google Scholar]
- 51.Andreeva A, Howorth D, Chandonia J, Brenner S, Hubbard T, Chothia C, Murzin A. Nucl Acids Res. 2008;36:D419–D425. doi: 10.1093/nar/gkm993. [DOI] [PMC free article] [PubMed] [Google Scholar]
- 52.Cuff A, Sillitoe I, Lewis T, Redfern O, Garratt R, Thornton J, Orengo C. Nucl Acids Res. 2009;37:D310–D314. doi: 10.1093/nar/gkn877. [DOI] [PMC free article] [PubMed] [Google Scholar]
- 53.Xu J, Zhang Y. Bioinf. 2010;26:889–895. doi: 10.1093/bioinformatics/btq066. [DOI] [PMC free article] [PubMed] [Google Scholar]
- 54.Kyte J, Doolittle R. J Mol Biol. 1982;157:105–132. doi: 10.1016/0022-2836(82)90515-0. [DOI] [PubMed] [Google Scholar]
- 55.Kabsch W, Sander C. Biopolymers. 1983;22:2577–2637. doi: 10.1002/bip.360221211. [DOI] [PubMed] [Google Scholar]
- 56.Ujwal R, Cascio D, Colletier JP, Faham S, Zhang J, Toro L, Ping P, Abramson J. PNAS. 2008;105:17742–17747. doi: 10.1073/pnas.0809634105. [DOI] [PMC free article] [PubMed] [Google Scholar]
- 57.Guo M, Chong YE, Shapiro R, Beebe K, Yang X, Schimmel P. Nature. 2009;462:808–812. doi: 10.1038/nature08612. [DOI] [PMC free article] [PubMed] [Google Scholar]
- 58.Whitehead T, Chevalier A, Song Y, Dreyfus C, Fleishman S, De Mattos C, Myers C, Kamisetty H, Blair P, Wilson I, Baker D. Nat Biotechnol. 2012;30:543–548. doi: 10.1038/nbt.2214. [DOI] [PMC free article] [PubMed] [Google Scholar]
- 59.DeLano W. The PyMOL molecular graphics system (ver 1.4.1) [Google Scholar]
- 60.Crooks G, Hon G, Chandonia J, Brenner S. Genome Research. 2004;14:1188–1190. doi: 10.1101/gr.849004. [DOI] [PMC free article] [PubMed] [Google Scholar]
Associated Data
This section collects any data citations, data availability statements, or supplementary materials included in this article.


