Abstract
In this paper, we report an inertial microfluidic device with simple geometry for continuous extraction of large particles with high size-selectivity (<2 μm), high efficiency (∼90%), and high purity (>90%). The design takes advantage of a high-aspect-ratio microchannel to inertially equilibrate cells and symmetric chambers for microvortex-aided cell extraction. A side outlet in each chamber continuously siphons larger particles, while the smaller particles or cells exit through the main outlet. The design has several advantages, including simple design, small footprint, ease of paralleling and cascading, one-step operation, and continuous separation with ultra-selectivity, high efficiency and purity. The described approach is applied to manipulating cells and particles for ultra-selective separation, quickly and effectively extracting larger sizes from the main flow, with broad applications in cell separations.
INTRODUCTION
Microfluidics has been receiving considerable attention in recent years for cell separations and sorting due to a number of promising advantages, including high throughput, high efficiency, low cost and simplicity. A recently introduced subset of the field, termed inertial microfluidics, has been attracting intense interest and has been proving to be a powerful tool for size-based, high-throughput, and passive sample preparation or separation in cell biology and clinical diagnostics.1, 2, 3, 4 The technique takes advantage of hydrodynamic forces that act on cells to position them within the flow.5, 6 These forces cause cells to migrate across streamlines and order in equilibrium positions based on their size, leading to label-free cell separation, purification and enrichment in a microfluidic device with designed geometries.7 Applications for separation of cells (erythrocytes/leukocytes,8, 9, 10 neuronal cells,6 cancer cells11), flow cytometry,12, 13, 14 and rare cell enrichment15, 16, 17 have been developed achieving passive cell and particle manipulation with extremely high throughput.
A wide range of channel geometries has been explored for inertial microfluidic cell ordering and separation. We2, 5 and others10, 11 developed straight channels to order cells into equilibration positions for size-based particle separation, blood filtration, and deformability-based cell separation. Lee et al.18, 19 used expansion/contraction geometries to induce secondary flow for blood plasma separation (with ∼62% yield) and separation of 10 μm and 4 μm diameter particles with ∼100% purity. Though the purity was high, the separation required a second inlet to induce sheath flow which inevitably complicated the fluidic instrument and device operation. Di Carlo et al.20, 21 developed wavy channels for cell focusing and filtration which could perform separation of 3 μm from 4.5 μm diameter particles, while the efficiency is only 50%. We1, 6, 8 and others9, 22, 23, 24, 25 also used curved or spiral channels to manipulate hydrodynamic forces to focus cells into streams for size-based separation. While spiral channels exhibit >90% separation efficiency at high-throughput (∼1 × 10⁶ cells/min),6, 8 they face challenges in the outlet design, the cascading and integration, and reduced selectivity for separating cells with <5 μm size differences.6
Recently, a novel approach has been reported by several investigators for selective isolation and trapping of cells from a mixture. The approach uses a straight channel to inertially focus cells, followed by microchambers to generate laminar vortices for trapping of larger cells. Sollier et al.26, 27 reported trapping blood cells for high purity plasma extraction, while Hur et al.16, 28 introduced devices in which particles and cells were trapped and subsequently released on demand. In a parallel independent work, we reported size-based selection of particles in rectangular channel expansions.15 These devices offer multiple promising potential applications, including extraction of plasma from blood and isolation of rare cells. While these devices are successful in capturing target cells at ultra-low concentrations (∼100 cells/ml), their non-continuous two-step operation is complicated and requires a complex fluidic setup, with the release/washing step inevitably decreasing (diluting) the capture efficiency.16 But most importantly, the number of cells trapped by each vortex is limited, with saturated vortices leading to loss of the target sample. Although this trapping capacity limit can be subverted by paralleling chambers into an array,16 the overall isolation process still presents a challenge when large sample volumes must be processed (e.g., >10 ml).
In this work, we move away from discrete operation steps and introduce continuous flow-through functionality. Our inertial microfluidic design introduces siphoning channels to two symmetric chambers, resulting in sheath flow sandwiched by vortices and main flow for continuous cell extraction in a single-step process. The design takes advantage of a high-aspect-ratio channel upstream of the trapping chambers to inertially focus cells into equilibrium positions near microchannel sidewalls. A single pair of chambers with siphoning channels follows the focusing channel for formation of vortex and sheath flow and large cell extraction. During operation, the larger cells are selectively entrained by inertial lift force into sheath flow and are released through the siphoning side channels, while the smaller cells remain in main flow and exit at the main outlet.
We show that separation of polystyrene particles with size differences of less than 2 μm is possible, while maintaining high throughput (2.5 × 10⁴ /min), high efficiency (∼90%), and high purity (>90%). To accomplish this, we optimize the flow conditions and the device outlet design both numerically and experimentally. To verify feasibility of biological sample separation for potential clinical applications, continuous separation using blood spiked with particles was also demonstrated, illustrating 86% separation efficiency and 5 × enrichment. Exhibiting a number of key advantages, we believe this simple inertial microfluidic design will benefit a broad range of applications related to particle and cell separation or purification.
RESULTS
Separation principle and device operation
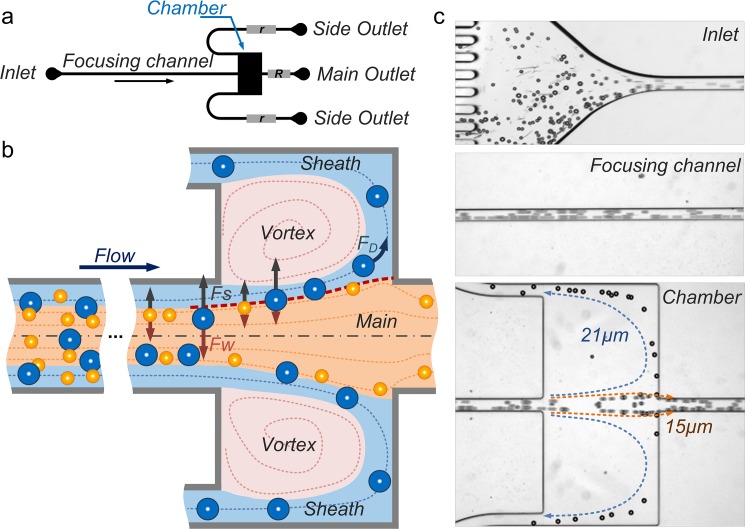
The microvortex-aided design consists of four major components: a high-aspect-ratio channel for inertial particle ordering; two symmetric chambers for microvortex formation; two side outlets at the corners of the chambers for sheath flow formation and extraction of large particles; and a main outlet for exit of small particles (Fig. 1a). The focusing channel is 10 mm long with a 50 μm × 100 μm (w × h) cross-section; each capture chamber is 500 × 500 μm2.15, 29 The length of outlet channels can vary to modulate fluidic resistance ratio (r/R) of the side (r) and main (R) outlets for optimizing the device performance. To understand the design principle, we will first briefly review our two-stage inertial focusing model29 and then discuss each system component in detail.
Figure 1.
(a) Schematic of the vortex-aided inertial microfluidic design. Flow resistances r of the side outlet channel and R the main outlet channel can be modulated to optimize device performance. (b) Illustration of the separation principle. The red dashed line indicates the boundary streamline of separating the main and sheath flow regions. (c) Bright-filed images at various downstream positions illustrating the separation phenomenon at Re = 110. Re was calculated using input flow rate (0.5 ml/min) and focusing channel geometry (50 μm × 100 μm w × h).
The inertial migration of particles in microchannels follows the balance of the lift forces and occurs in two stages.29 Initially, particles are subjected to the shear-gradient induced lift force Fs that pushes them across streamlines towards channel walls and the wall-induced lift force Fw that acts to balance the shear-gradient induced lift force (Fig. 1b). Driven by these two dominant lift forces, the particles settle along each sidewalls into bands where Fw balances Fs. Once this initial equilibrium is reached, near channel walls particle motion is dominated by the rotation-induced lift force FΩ. As a result, particles migrate to the center points of walls in this second stage. This model of inertial focusing is generally applicable to rectangular microchannels of any aspect ratio at finite Re and can be used to aid design of inertial microfluidic systems. The maximum downstream length L necessary for particles of diameter a to focus and fully equilibrate can be described as
| (1) |
where μ is fluid viscosity, ρ is fluid density, Uf is the average flow velocity, and Dh is the hydraulic diameter (Dh = 2wh/ (w+h) for a channel w wide and h high). is the negative lift coefficient related to the first stage migration and is the positive lift coefficient related to the second stage migration.29 The equation illustrates a strong dependence of the focusing length on particle diameter (L ∝ a−3). Thus, larger particles will require much less focusing length than the smaller ones.
The first critical component of the system is the high-aspect-ratio channel aimed at focusing particles or cells in the first stage as two bands along channel sidewalls. Using Eq. 1 and lift coefficients we presented in our recent work,29L1 = 1.6 mm and L2 = 12.8 mm for the first and second stage focusing of 20 μm diameter particles in 100 μm × 50 μm (h × w) channel ( = 0.03 and = 0.007 at Re = 110). Accordingly, we designed a 10 mm long channel to ensure large particles (∼20 μm diameter) focus in the first stage which was the preferable focusing condition for extraction of larger particle in this vortex-aided separation. We will discuss this preferred focusing condition in more detail in the following section.
Downstream of the focusing channel, the fluid is fractionated into five parts with main flow into main outlet, two sheath flows into side outlets and two microscale laminar vortices in symmetric chambers (Fig. 1b). The formation of the vortex creates a virtual wall that reduces the wall-induced lift force Fw, leading to particle lateral migration into sheath flow undergoing the shear-gradient induced lift force Fs.15, 16 Asmolov30 reported the shear-gradient induced lift force scaling as Fs ∝ CLa4, where CL is the size-dependent lift coefficient. Numerical work by Loth and Dorgan31 suggested lift coefficient scaling as CL ∝ a−2, which was confirmed experimentally in our recent work.29 Thus, the magnitude of the shear-gradient induced lift force scales as Fs ∝ a2.29, 30, 31, 32 Assuming that Fs is balanced by the Stokes drag (FD = 3πμaUL), the lateral migration velocity of these particles scales with particle size as UL ∝ a. Thus, the larger particles migrate faster across the streamlines toward the sheath flow. Once large particles migrate across the boundary streamline (red dashed line in Fig. 1b) of main and sheath flow, they become captured and isolated from the main flow. It is this size-selective capture feature that leads to the possibility of selective separation, as particles below the set threshold diameter do not migrate sufficiently far across the boundary and remain in the main flow.
While the capture chambers aim at size-selective selection, side-outlets at the corner of the chambers are critical components inducing the continuous functionality. The flow in the side-outlet leads to fluid fractionation, creating the sheath flow that wraps around the vortex (Fig. 1b blue area). The rotating vortex induces a fluid drag (FD) directing orthogonally to the main flow but in parallel to sheath flow. As large particles are entrained into the sheath flow, they will undergo the fluid drag leading them to the side-outlet for continuous extraction. One critical parameter that determines the continuous release is the fluidic resistance ratio (r/R) of the side (r) and main (R) outlets. The influence of the fluidic resistance ratio on the particle behavior is investigated for the optimization of the device performance in later section.
To demonstrate continuous particle separation in our device, a mixture of 21 μm and 15 μm diameter polystyrene particles was injected into the device at input Re = 110. We should note that although rigid polystyrene particles are not ideal to surrogate cells due to lack of deformability, they are commonly used to mimic cells in evaluations of inertial microfluidic devices.14, 20 The device operation only requires a single syringe pump and includes only a single step of sample injection, thus reducing the complexity and costs of operation. The stacked images in Fig. 1c illustrate the expected behavior—extraction of the 21 μm diameter particles from the mixture. Particles first order at equilibrium positions near microchannel sidewalls. As they travel to the capture chambers, the 15 μm diameter particles exit through the main outlet, while the 21 μm diameter particles enter the chambers following the sheath flow and exit through the side outlets. To optimize selectivity and separation efficiency, in the following sections, we investigate the flow conditions and the outlet resistance network as the two factors critical to device performance.
Optimization of flow conditions for particle capture
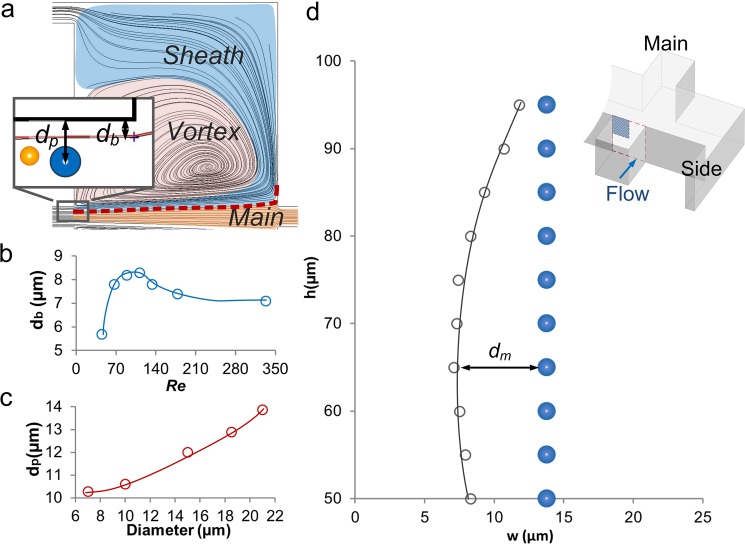
Particle capture is the critical step for continuous extraction. The flow conditions determine particle capture by the modulation of flow separation and the magnitude of inertial force. We first investigated the flow separation, as its position determines the distance necessary for a particle to inertially migrate for capture (Fig. 2a). We found the position of the separation boundary (db) can be tuned by the flow rate. Numerical models for a design with outlet resistance ratio r/R = 10 illustrate that the boundary position at half height of the channel (h = 50 μm) increases with Re from db = 5.7 μm (Re = 44), peaking at db = 8.3 μm at Re = 110 and settling at db = 7.1 μm for Re > 200 (Fig. 2b). To estimate the inertial migration distance to the boundary, we experimentally measured the particle focusing position dp at Re = 110 (Fig. 2c). Thus, the migration distance dm is calculated as a difference between the particle focusing position and location of the separation boundary, given as dm = dp – db. For a 21 μm diameter particle, the minimum migration distance is dm = 5.6 μm at Re = 110, which is the optimal Re for shortest migration distance causing capture at h = 50 μm. We also investigated the boundary at different channel heights by measuring the boundary positions at h = 50 ∼ 95 μm (Fig. 2d). The results show an increase of db from 8.3 μm to 11.8 μm at h > 75 μm, indicating a shorter migration distance for particles focusing near the top (or bottom) of the microchannel. All these results indicate that incomplete, two-band focusing along the sidewalls is preferred for particle capture due to the shorter migration distance.
Figure 2.
Optimization of flow conditions for particle capture. (a) ESI CFD-ACE+ simulation shows the boundary streamline (red line) of the main flow and sheath flow regions. Only one of the two symmetric chambers is shown. Inset figure indicates definitions of db and dp. (b) Boundary streamline position db is modulated by Re. (c) Experimental measurement of particle focusing position dp of various sized particles. (d) Boundary position db changes at different channel height h. Grey hollow circles represent the boundary position, while the blue solid circles represent focusing position of 21 μm particles. dm is defined as a difference between the particle focusing position and location of the separation boundary, given as dm = dp – db. The investigated area is the upper left quadrant of the channel cross-section, shaded blue area in the inset 3D schematic.
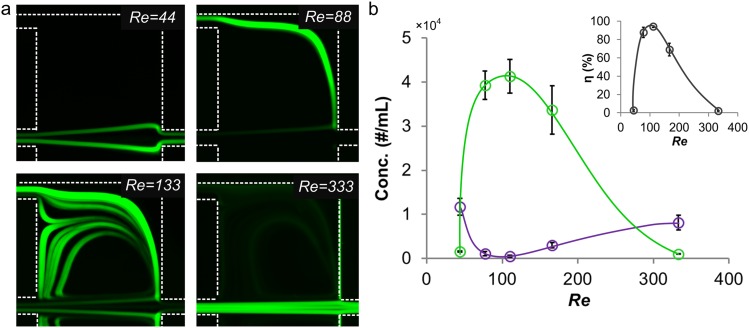
In addition to modulation of flow separation, flow conditions also influence magnitude of the inertial force leading to different lateral migration velocity. Higher flow velocity leads to a larger shear-gradient induced lift force on particles (Fs ∝ Uf2). From the Stoke's law, the lateral migration velocity (UL) scales as UL ∝ Uf2,2 indicating that particles migrate faster toward the vortex at higher Re. To illustrate the impact of flow condition on particle motion at the chamber, we experimentally demonstrated the behavior of 23 μm diameter particles at various Re (Fig. 3a). At Re = 44, the transverse migration is not sufficient for particles to migrate into the sheath region, thus particles exit from the main outlet. At Re = 88, the flow separation boundary shifts closer to the particle focusing position and particles migrate faster driven by the larger shear-gradient induced lift force, causing them to migrate into the sheath region and exit through the side outlet. At Re = 330, the boundary shifts toward the wall indicating a longer distance for particles to migrate into sheath region. In addition, at higher Re the residence time of particles in the chamber region is shorter, and so is the time for lateral migration. Thus, the majority of the particles exit from the main-outlet decreasing the extraction efficiency. We used a hemocytometer to measure concentration of particles from side and main outlets and calculate the corresponding extraction efficiencies at various input Re. The results (Fig. 3b) show the highest extraction efficiency at moderate Re = 110, which is the optimum value for our system. Next, we will examine release of particles through the sheath flow.
Figure 3.
(a) Experimental observations demonstrating behavior of 23 μm diameter particles at different Re. Only one of the two symmetric chambers is shown. (b) Concentration of 23 μm diameter particles from side outlet (green) and main outlet (purple) at various Re. Inset figure shows the corresponding separation efficiency η at various Re. Error bars represent stand deviation (n = 3).
Optimization of flow conditions for particle release
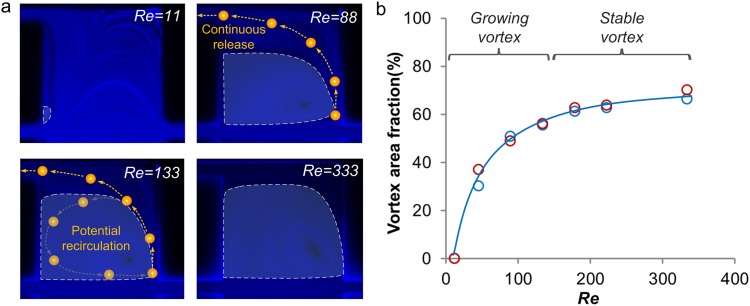
Not only do the flow conditions affect particle selection, but they also influence particle release through changes to the vortex area. We studied the vortex geometric progression at increasing Re both numerically and experimentally using a device with r/R = 10 (Fig. 4). Vortex area experiences an increase of two orders of magnitude as the Re increases from 0 to 88 (growing stage) occupying 50% of the chamber at Re = 88. The remaining 50% of the chamber area is occupied by the sheath flow. As large particles migrate into the sheath flow (Fig. 4a yellow dots), their motion is dominated by the fluid drag along the streamline of the sheath flow. We experimentally showed that 23 μm diameter particles follow the sheath flow for continuous release without recirculation in the vortex (Fig. 3a, Re = 88). As Re increases from 133 to 333, the vortex area increases from 60% to 70% (stable stage) with 30% of the chamber area as the sheath region. Under these conditions, some particles begin to recirculate in the vortex but are eventually released through the side-outlets (Fig. 3a, Re = 133). Since recirculating particles remain in the vortex for a short period of time, they may prevent more particles from entering the chamber due to particle-particle interactions, which leads to lower capture efficiency. For the r/R = 10 device, continuous release without recirculation is observed at Re < 130 indicating the optimal condition for particle release. Next, we will examine the impact of the outlet resistance ratio on the device performance.
Figure 4.
Optimization of flow conditions for particle release. (a) Experiments with tracer-beads (TRITC) demonstrating geometric evolution of the vortex as Re increases. Only one of the two symmetric chambers is shown. The white dashed line indicates the vortex area. Diagrams of the larger particle route show particle at different Re. (b) Experimental (red circle) and simulation (blue circle) measurements showing the increasing vortex size at 0 < Re < 400.
Optimization of outlet flow resistance
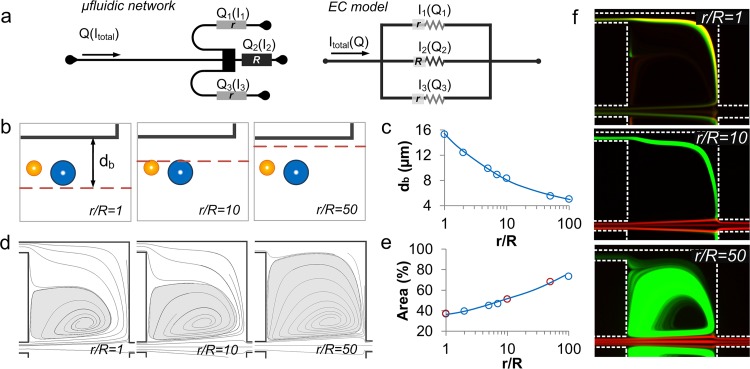
The outlet influences the flow separation and vortex area by modulating the flow rate in the side-outlets leading to distinct particle behavior. As the resistance ratio (r/R) of side-outlet (r) to main-outlet (R) varies, the flow rate in the outlet changes, respectively, following the corresponding analogous electric circuit model (Fig. 5a).33 To investigate influence of the resistance network on the separation boundary position, we developed CFD-ACE+ models for 1≤ r/R ≤ 100 at Re = 88. We selected Re = 88 since continuous extraction starts to happen in a r/R = 10 device at such Reynolds number (Fig. 3a). From the simulation, the boundary streamline db was measured to be 15.3 μm away from the channel wall as r/R = 1(Figs. 5b, 5c). In this condition, all the particles are directly located in the sheath region and exit from the side-outlet matching the experimental observation at r/R = 1 (Fig. 5f). As the ratio increases to r/R = 10, the separation boundary streamline shifts away from the wall to db = 8.2 μm. Further increase to r/R = 50 pushes the separation boundary even closer to the wall, to db = 5 μm. In these situations, particles initially locate in main flow region, thus require shear-gradient induced lift force to push them into the sheath region for extraction from the side-outlet. In our experiments, 23 μm diameter particles undergo larger shear-gradient induced lift force and migrate into sheath region, while 15 μm diameter particles remain in main flow region fulfilling size-based separation (Fig. 5f).
Figure 5.
Optimization of the outlets. (a) Microfluidic network of the device and the corresponding electrical circuit (EC) model. (b) Schematics illustrating shift of boundary streamline at different r/R. (c) ESI CFD-ACE+ simulation illustrates boundary streamline position db for 1 < r/R < 100. (d) ESI CFD-ACE+ simulation demonstrates geometric progression of the vortex at different r/R, and (e) the corresponding quantitative measurements of vortex dimension from both numerical models (blue circles) and experimental (red circles) at for 1 < r/R < 100. (f) Experimental observations illustrate motion of the 23 μm (FITC) and 15.5 μm (TRITC) diameter particles at different r/R ratios at Re = 110.
The resistance network influences vortex dimension by tuning the flow rate in the side outlet thus relates to the particle releasing. The CFD-ACE+ simulations at Re = 88 show the increase of vortex dimension as r/R increases (Fig. 5d). The vortex area at various r/R was measured from both simulation and experimental results (Fig. 5e). At r/R = 1, considering the current distribution in a parallel circuit, flow is distributed evenly in the three outlets (ReQ1 = ReQ2 = ReQ3 = 29.3). Accordingly, the vortex occupies only ∼36% of the chamber area due to the fast release of flow from side outlet. At r/R = 10, the vortex area increases to ∼50% as the flow rate in the side outlet decreases, respectively (ReQ1 = ReQ3 = 7.3 and ReQ2 = 74). As the ratio increases further to r/R = 50, the vortex enlarges to occupy 73% of the chamber area. The experimental results demonstrate particle releasing at different resistance network (Fig. 5f). At r/R ≤ 10, the 23 μm diameter particles exit through the side-outlet without recirculation in the vortex. However, at r/R = 50, due to the larger vortex size, particles become trapped inside the vortex and can be seen as bright fluorescent orbits.
In summary, this study of outlet-resistance offers guideline in device design for achieving continuous extraction of particles. Selecting the appropriate resistance ratio (r/R) is essential for successful particle separation and continuous release. The r/R = 1 or 2 leads to continuous release of particles, but demonstrates no size-selectivity. For r/R = 50, good size-selectivity is observed, yet the continuous release is limited. Ratios in the r/R = 5 ∼ 10 range are found to be appropriate for continuous extraction of > 20 μm diameter particles from a mixture.
Ultra-selective separation
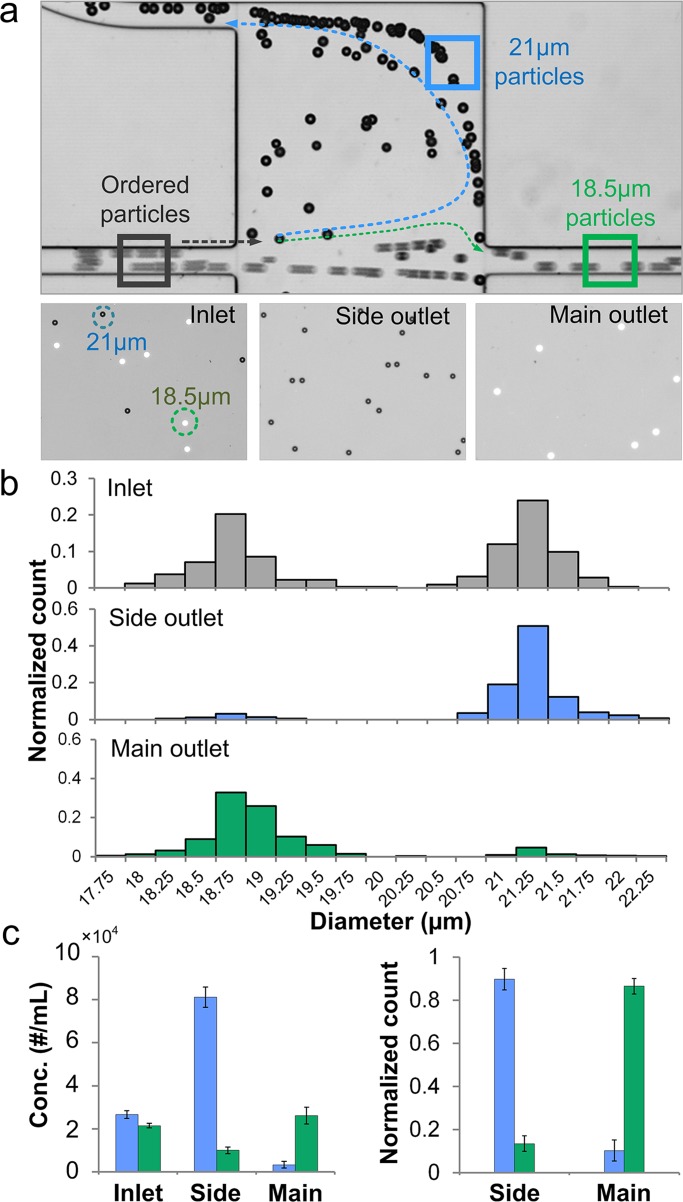
Cellular or microparticle samples often exhibit heterogeneity in terms of size, making it difficult to achieve efficient separation using existing inertial microfluidic systems. Selectivity of a these systems must be considered. Here, we define size selectivity as the difference in particle diameter that can be separated. Our group reported spiral devices for continuous, high throughput separation of cells, but with 5 μm size selectivity.6 Di Carlo et al.20, 21 demonstrated wavy channels for cell filtration that potentially could separate of 3 μm from 4.5 μm diameter particles, but with efficiency of only 50%. Using the optimized experimental condition (at Re = 110 and r/R = 5), the device presented in this paper is capable of separating particles with down to 2 μm selectivity while remaining ∼90% efficiency and > 90% purity. To demonstrate selectivity of separation, a mixture of 21 μm and 18.5 μm diameter particle (∼2.5 × 10⁴/ml each) was injected in the device. The experimental observations at the chamber illustrate syphoning of the 21 μm diameter particles through the side outlets, while the 18.5 μm particles travel to the main-outlet. The images of the inlet and outlet samples in Fig. 6a demonstrate the population of each type of particles indicating the successful separation.
Figure 6.
Ultra-selective separation of 21 μm from 18.5 μm diameter particles in a device with r/R = 5. (a) The top bright-field image shows separation at the device chamber. The lower three images show particles at the inlet, side outlet and main outlet. The black dots are 21 μm diameter non-fluorescent particles in bright-field view. The white dots are fluorescent 18.5 μm diameter particles. (b) Histograms of inlet, side outlet and main outlet samples indicate the efficient separation. (c) Concentration of 21 μm and 18.5 μm diameter particles in inlet, side and main outlet samples. Normalized count shows a separation efficiency of ∼90% for both particles. Error bars represent stand deviation (n = 3).
It is challenging to achieve high purity of targeted particles or cells in separation especially when the sample is not homogeneous. Yet highly purified samples are critical in clinical analysis and particle-related research such as subpopulation counts or bead-based filtration.34 The quantitative analysis of downstream particle samples indicate highly purified 21 μm particles from side outlet and 18.5 μm from main outlet (Fig. 6b). The purity of 21 μm diameter particles from the side outlet is 93%, while the purity of 18.5 μm from main outlet is 91%. In addition, the concentration of 21 μm particles from the side outlet is enriched 3 × than the inlet. The enrichment is caused by the sample volume distribution from side and main outlet (Fig. 6c). Since r/R = 5, the sample volume of the two side outlets Vside and the total sample volume Vtotal has the relationship of Vside / Vtotal = 2/7. Normalized counts show a ∼90% separation efficiency of 21 μm diameter particles from side outlet and 18.5 μm from main outlet (Fig. 6c).
Continuous extraction from blood sample
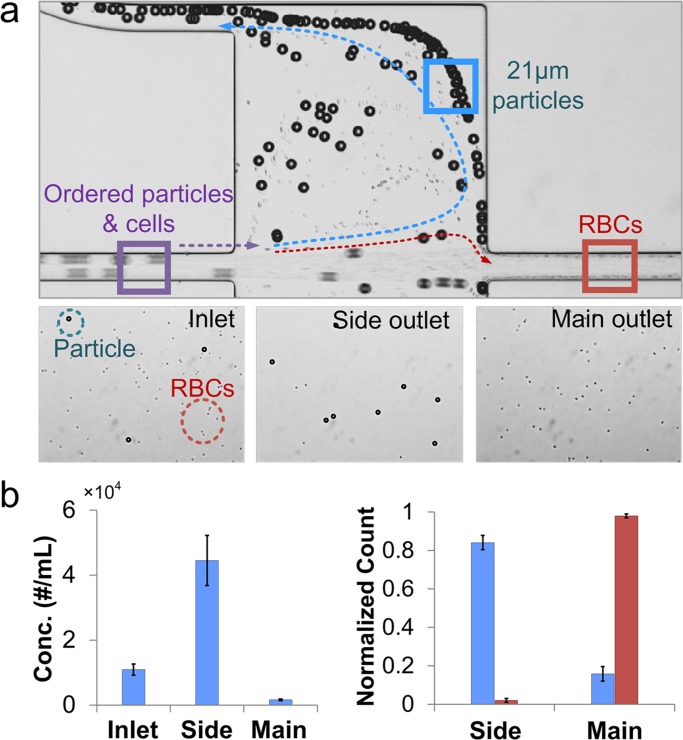
To demonstrate the potential to extract larger cells from blood as sample preparation proof-of-concept, we spiked 21 μm diameter non-fluorescence particles to mimic spheroid cells with larger size into diluted human-blood (particle concentration ∼1 × 10⁴/ml, RBC concentration ∼1 × 10⁶/ml) and ran the sample through device for separation. The separation phenomenon and the resulted outlet sample are presented in bright-field image Fig. 7a. Particles appear to follow the sheath streamlines to the side-outlets, while RBCs exit from the main-outlet. Compared to inlet sample, particles are concentrated 5 × in the side-outlet (Fig. 7b). Normalized count shows ∼86% particle capture efficiency, while nearly all (∼99%) RBCs exit from the main outlet (Fig. 7c). These results indicate that the device is very promising in efficient extraction of large cells from mixture continuously (no limitation on capture cell number) and concentration enrichment by 5 × . Furthermore, the operation of device only requires one syringe pump and a single step injection thus lowering the cost of instruments while improving the convenience of using.
Figure 7.
Continuous extraction from blood sample. (a) Separation of 21 μm diameter particles from human blood in a device with r/R = 10. The top bright-field image shows separation at the device chamber. The lower three images show the particles at the inlet, side outlet and main outlet. (b) The concentration of 21 μm diameter particles in the side outlet increases 5 × as compared to the inlet. Normalized count of 21 μm diameter particles in side and main outlets shows a capture efficiency of 86%, while 99% RBCs exit through main outlet. Error bars represent the stand deviation of three individual experiments.
DISCUSSION
This work reports on an inertial microfluidic building block that uses microvortices and accompanied sheath flows for continuous size-based particle or cell passive separation with high throughput, selectivity as well as high efficiency and purity. The device was formed by a high-aspect ratio channel for particle ordering followed by two symmetric chambers with side outlets for vortex and sheath flow formation and target particle/cell extraction. The separated cells follow the sheath flow to the side outlets while smaller cells exit from the main-outlet. Flow conditions and resistance network of the outlets exhibit significant influences on particle behavior and were discussed thoroughly to optimize the device performance. With proper resistance ratio (r/R = 5∼10) and flow rate (Re ∼ 110), the device successfully separated 21 μm from 18.5 μm diameter particles with > 90% purity and ∼90% efficiency indicating the high selectivity, high efficiency and purity. Besides, we presented separation of large particles from human-blood sample with an efficiency of 86% and 5 × enrichment by concentration, implying the device could be applied for separation of biological sample in clinical sample preparation.
The ultra-high selectivity stems from accurate modulation of the boundary-streamline and inertial lift at the chamber by the flow rate and resistance network. By modulating the resistance ratio (r/R) and the flow rate, the cut-off diameter of the separation can be precise determined leading to separation of particles with 2 μm size-selectivity. This feature enables precise size-based purification which can be potentially used to continuously purify commercial particle solution with large size variation with high throughput (0.5 ml/min for a single device), high efficiency (∼90%) and high purity (>90%). At this stage of work, we presented sharp separation of particles at 20 μm cut-off diameter. Future work is focusing on tuning the cut-off diameter by modulating the flow condition and outlet resistance for separation of particles of other sizes. For example, it is possible to locate separation boundary streamline (db) between the focusing positions (dp) of WBCs (10∼15 μm) and RBCs (7 μm) for separation. Separation of smaller particles (<5 μm) is possible but will require scaling of the system into smaller dimensions.
The extraction efficiency for particle separation and particle-blood separation reaches 90% and 86% with continuous manner. These results are 2 × higher than previously-reported results in non-continuous vortex-trapping devices.15, 16, 28 This high efficiency comes from two factors: (1) design of the focusing channel length that enables equilibration of target particles into two bands which is favorable for vortex capture;15 and (2) The inducing of the sheath flow shifts the separation boundaries (db) closer to the particle focusing position (dp) indicating shorter migration distance for isolation. In addition to high separation efficiency, there is no limit on trapping capacity due to the continuous release from the chambers. The device is capable of continuous manipulation of large sample volume containing higher concentration of target cells (e.g. > 1,000/mL) with high-throughput (0.5 ml/min for a single device). A further increase of the device-throughput can be achieved by paralleling the devices into an array while retaining the simplicity of the device operation.
As an inertial microfluidic building block with simple geometry, it may be convenient to cascade several chambers to build an integrated inertial microfluidic system capable of separating particle or cell mixtures of three or more sizes in a single run. It can potentially be used for single step separation of cellular or particle samples with broad size variation, e.g., single, doublet, and triplet cells. The vortex-aided inertial microfluidic building block provides a simple, cell-separation platform with ultra-high selectivity, efficiency and ease of cascading and paralleling. We envision numerous broader applications in separation of cells or particles for sample preparation or purification.
EXPERIMENTAL METHODS
Fabrication
We fabricated microchannels in polydimethysiloxane (PDMS, Sylgard 184, Dow Corning) with standard soft lithography process. We used a 100 μm high master formed in SU-8 photoresist (2075, Microchem Corp.). A mixture of PDMS base and curing agent (10:1 ratio) were poured on the master; after degassing PDMS was cured for 4 h on a 60 °C hotplate. The cured PDMS devices were peeled off, and inlet/outlet ports were punched with a 14 gauge syringe needle. PDMS was bonded to standard glass slide using a hand-hold plasma surface treater (BD-20AC, Electro-Technic Products Inc.).
Characterization
To demonstrate the device performance, we dispensed non-fluorescence 21 μm diameter particles (Polyscience, Inc.) and 15.5 μm diameter particles (Invitrogen) at 0.1% (v/v) in deionized (DI) water to form a solution of particle mixture. For the experiment of extraction of 23 μm diameter particles (Polyscience, Inc.), we prepared FITC-labeled 23 μm diameter particles in deionized water to obtain a concentration of ∼1 × 10⁴/ml. To visualize vortex, we prepared 200 nm diameter DAPI-labeled tracer beads (Bangs Laboratories) at 0.05% (v/v) in DI water. For the experiment for the outlet optimization, we dispensed FITC-labeled 23 μm diameter particles (Polyscience, Inc.) and TRITC-labeled 15.5 μm diameter particles (Invitrogen) in DI water to form particle mixture (∼1 × 10⁴/ml for each particle). In the experiment of ultra-selective separation, we mixed 21 μm diameter non-fluorescent particles (Polyscience, Inc.) with 18.5 μm FITC-labeled particles (Polyscience, Inc.) to obtain a concentration of ∼ 2.5 × 10⁴/ml for each of the species. We added Tween-20 at 0.1% v/v (Fisher Scientific, Inc.) to the particle solution to avoid issue of particle clogging. For particle-spiked blood separation, we diluted human blood in 0.9% sodium chloride and spiked 21 μm diameter non-fluorescent particle (Polyscience, Inc.) to obtain a sample solution with RBC concentration of ∼1 × 10⁶/ml and particle concentration of ∼1 × 10⁴/ml.
We first loaded a syringe with particle solution and connected it to the device by using a 1/16″ peek tubing (Upchurch Scientific) with proper fittings (Upchurch Scientific). We drove the syringe with a syringe pump (NE-1000, New Era Pump Systems, Inc.). To take fluorescent vortex images or particle stream images, we used an inverted epi-fluorescence microscope (IX71, Olympus Inc.) equipped with a 12-bit high-speed CCD camera (Retiga EXi, QImaging). We overlay 20 images and added pseudo-colors to form fluorescent particle-stream pictures in ImageJ. To exhibit trajectory of particle in bright-field, we used the same equipment while setting the exposure time to minimum value (10 μs) and sequentially took 300 images with minimum time interval. We stacked 300 images in ImageJ to establish a complete view of particle motion.
We used a hemocytometer (Hausser Scientific) to measure the concentration of inlet, side and main outlets in the experiment of extracting 23 μm diameter particles. To calculate the extraction efficiency (normalized count), we combined the concentration with the sample volume from the side and main outlets. For example, the concentrations of 23 μm diameter particles in two side-outlets and one main-outlet are C1, C2, and C3. Using a device of r/R = 10, the sample volume from side-outlet (V1) and main-outlet (V2) has the relationship: 10V1 = V2 according to the electrical circuit model of the microfluidic network (We also injected DI water through the device to prove the relationship of the volume from main and side outlets). Thus, the efficiency (normalized count) of 23 μm diameter particle from side-outlet is calculated to be: (C1V1+C2V1)/(C1V1+C2V1 +10V1C3) = (C1+C2)/(C1+C2+10C3). The similar process was carried out to get the normalized counts in Figs. 6c, 7b. We should note that in the experiment of ultra-selective separation, since 21 μm and 18.5 μm diameter particles have very small size-variation, it is hard to tell the difference in bright field. To count the particles in hemocytometer, we first count the total number of particles in bright field and then we turned on the excitation light source with the FITC filter so that FITC-labeled 18.5 μm diameter particles appeared to be bright dots (Fig. 6a). To measure size distribution of particles, we first injected an outlet sample into a hemocytometer to form monolayer of particles and then took bright field images using the same equipment and used Image Pro Plus to automatically measure the particle size. We repeated the process until measuring 300 particles in each sample and plotted the histogram to show the size distribution of particles (Fig. 6b).
Numerical models
We modeled the device using a commercial computational fluid dynamics software CFD-ACE+ (ESI-CFD Inc., Huntsville, AL). The module we used to solve for fluid motion in the geometry is FLOW. The physical properties of water was applied to the fluid in the simulation (density ρ = 1000 kg m−3 and dynamic viscosity μ = 10−3 kg m−1 s−1). The velocity of x-direction (m/s) calculated from the flow rate was applied to initial inlet velocity. We set the convergence limit for mass fraction to 10−6 and run the simulation for 3000 time steps to ensure the convergence of the simulation.
We analyzed the simulation results in CFD-VIEW. To find the boundary-streamline from the simulation, we first fixed z-plane at half of the channel height, we moved the y-position of the streamline from the center-line of the channel towards the sidewall until the point that the streamline started to stretch to the side outlet. To visualize the vortex in the simulation, we added multiple streamlines at different x or y locations until the vortex were clearly defined. We measured the vortex dimension from these pictures in ImageJ.
ACKNOWLEDGMENTS
We gratefully acknowledge partial support by the Defense Advanced Research Projects Agency (DARPA) N/MEMS S&T Fundamentals Program under Grant No. N66001-1-4003 issued by the Space and Naval Warfare Systems Center Pacific (SPAWAR) to the Micro/nano Fluidics Fundamentals Focus (MF3) Center.
References
- Bhagat A. A. S., Kuntaegowdanahalli S. S., and Papautsky I., Lab Chip 8, 1906–1914 (2008). 10.1039/b807107a [DOI] [PubMed] [Google Scholar]
- Bhagat A. A. S., Kuntaegowdanahalli S. S., and Papautsky I., Phys. Fluids 20, 101702 (2008). 10.1063/1.2998844 [DOI] [Google Scholar]
- Di Carlo D., Lab Chip 9, 3038–3046 (2009). 10.1039/b912547g [DOI] [PubMed] [Google Scholar]
- Bhagat A. A. S., Bow H., Hou H. W., Tan S. J., Han J., and Lim C. T., Med. Biol. Eng. Comput. 48, 999–1014 (2010). 10.1007/s11517-010-0611-4 [DOI] [PubMed] [Google Scholar]
- Bhagat A. A. S., Kuntaegowdanahalli S. S., and Papautsky I., Microfluid. Nanofluid. 7, 217–226 (2009). 10.1007/s10404-008-0377-2 [DOI] [Google Scholar]
- Kuntaegowdanahalli S. S., Bhagat A. A. S., Kumar G., and Papautsky I., Lab Chip 9, 2973–2980 (2009). 10.1039/b908271a [DOI] [PubMed] [Google Scholar]
- Gossett D. R., Weaver W. M., Mach A. J., Hur S. C., Tse H. T. K., Lee W., Amini H., and Di Carlo D., Anal. Bioanal. Chem. 397, 3249–3267 (2010). 10.1007/s00216-010-3721-9 [DOI] [PMC free article] [PubMed] [Google Scholar]
- Nivedita N. and Papautsky I., “Continuous separation of blood cells in spiral microfluidic devices,” Biomicrofluidics (to be published). 10.1063/1.4819275 [DOI] [PMC free article] [PubMed]
- Wu L., Guan G., Hou H. W., Bhagat A. A. S., and Han J., Anal. Chem. 84, 9324–9331 (2012). 10.1021/ac302085y [DOI] [PubMed] [Google Scholar]
- Mach A. J. and Di Carlo D., Biotechnol. Bioeng. 107, 302–311 (2010). 10.1002/bit.22833 [DOI] [PubMed] [Google Scholar]
- Hur S. C., Henderson-Maclennan N. K., McCabe E. R. B., and Di Carlo D., Lab Chip 11, 912–920 (2011). 10.1039/c0lc00595a [DOI] [PubMed] [Google Scholar]
- Bhagat A. A. S., Kuntaegowdanahalli S. S., Kaval N., Seliskar C. J., and Papautsky I., Biomed. Microdevices 12, 187–195 (2010). 10.1007/s10544-009-9374-9 [DOI] [PubMed] [Google Scholar]
- Hur S. C., Tse H. T. K., and Di Carlo D., Lab Chip 10, 274–280 (2010). 10.1039/b919495a [DOI] [PubMed] [Google Scholar]
- Oakey J., Applegate R. W., Arellano E., Di. Carlo D., Graves S. W., and Toner M., Anal. Chem. 82, 3862–3867 (2010). 10.1021/ac100387b [DOI] [PMC free article] [PubMed] [Google Scholar]
- Zhou J., Kasper S., and Papautsky I., Microfluid. Nanofluid. (published online). 10.1007/s10404-013-1176-y [DOI] [PMC free article] [PubMed]
- Mach A. J., Kim J. H., Arshi A., Hur S. C., and Di Carlo D., Lab Chip 11, 2827–2834 (2011). 10.1039/c1lc20330d [DOI] [PubMed] [Google Scholar]
- Bhagat A. A. S., Hou H. W., Li L. D., Lim C. T., and Han J., Lab Chip 11, 1870–1878 (2011). 10.1039/c0lc00633e [DOI] [PubMed] [Google Scholar]
- Lee M. G., Choi S., Kim H.-J., Lim H. K., Kim J.-K., Huh N., and Park J.-K., Appl. Phys. Lett. 98, 253702 (2011). 10.1063/1.3601745 [DOI] [Google Scholar]
- Lee M. G., Choi S., and Park J.-K., J. Chromatogr. A 1218, 4138–4143 (2011). 10.1016/j.chroma.2010.11.081 [DOI] [PubMed] [Google Scholar]
- Di Carlo D., Irimia D., Tompkins R. G., and Toner M., Proc. Natl. Acad. Sci. U. S. A. 104, 18892–18897 (2007). 10.1073/pnas.0704958104 [DOI] [PMC free article] [PubMed] [Google Scholar]
- Di Carlo D., Edd J. F., Irimia D., Tompkins R. G., and Toner M., Anal. Chem. 80, 2204–2211 (2008). 10.1021/ac702283m [DOI] [PubMed] [Google Scholar]
- Lee W. C., Bhagat A. A. S., Huang S., Van Vliet K. J., Han J., and Lim C. T., Lab Chip 11, 1359–1367 (2011). 10.1039/c0lc00579g [DOI] [PubMed] [Google Scholar]
- Gossett D. R. and Di Carlo D., Anal. Chem. 81, 8459–8465 (2009). 10.1021/ac901306y [DOI] [PubMed] [Google Scholar]
- Russom A., Gupta A. K., Nagrath S., Di. Carlo D., Edd J. F., and Toner M., New J. Phys. 11, 075025 (2009). 10.1088/1367-2630/11/7/075025 [DOI] [PMC free article] [PubMed] [Google Scholar]
- Seo J., Lean M. H., and Kole A., J. Chromatogr. A 1162, 126–131 (2007). 10.1016/j.chroma.2007.05.110 [DOI] [PubMed] [Google Scholar]
- Sollier E., Rostaing H., Pouteau P., Fouillet Y., and Achard J.–L., Sens. Actuators B 141, 617–624 (2009). 10.1016/j.snb.2009.05.023 [DOI] [Google Scholar]
- Sollier E., Cubizolles M., Fouillet Y., and Achard J.–L., Biomed. Microdevices 12, 485–497 (2010). 10.1007/s10544-010-9405-6 [DOI] [PubMed] [Google Scholar]
- Hur S. C., Mach A. J., and Di Carlo D., Biomicrofluidics 5, 022206 (2011). 10.1063/1.3576780 [DOI] [PMC free article] [PubMed] [Google Scholar]
- Zhou J. and Papautsky I., Lab Chip 13, 1121–1132 (2013). 10.1039/c2lc41248a [DOI] [PubMed] [Google Scholar]
- Asmolov E. S., J. Fluid Mech. 381, 63–87 (1999). 10.1017/S0022112098003474 [DOI] [Google Scholar]
- Loth E. and Dorgan A. J., Environ Fluid Mech. 9, 187–206 (2009). 10.1007/s10652-009-9123-x [DOI] [Google Scholar]
- Kurose R. and Komori S., J. Fluid Mech. 384, 183–206 (1999). 10.1017/S0022112099004164 [DOI] [Google Scholar]
- Oh K. W., Lee K., Ahn B., and Furlani E. P., Lab Chip 12, 515–545 (2012) 10.1039/c2lc20799k [DOI] [PubMed] [Google Scholar]
- Shim J. S. and Ahn C. H., Lab Chip 12, 863–866 (2012). 10.1039/c2lc21009f [DOI] [PubMed] [Google Scholar]


