Abstract
Cardiovascular simulations provide a promising means to predict risk of thrombosis in grafts, devices, and surgical anatomies in adult and pediatric patients. Although the pathways for platelet activation and clot formation are not yet fully understood, recent findings suggest that thrombosis risk is increased in regions of flow recirculation and high residence time (RT). Current approaches for calculating RT are typically based on releasing a finite number of Lagrangian particles into the flow field and calculating RT by tracking their positions. However, special care must be taken to achieve temporal and spatial convergence, often requiring repeated simulations. In this work, we introduce a non-discrete method in which RT is calculated in an Eulerian framework using the advection-diffusion equation. We first present the formulation for calculating residence time in a given region of interest using two alternate definitions. The physical significance and sensitivity of the two measures of RT are discussed and their mathematical relation is established. An extension to a point-wise value is also presented. The methods presented here are then applied in a 2D cavity and two representative clinical scenarios, involving shunt placement for single ventricle heart defects and Kawasaki disease. In the second case study, we explored the relationship between RT and wall shear stress, a parameter of particular importance in cardiovascular disease.
INTRODUCTION
Cardiovascular simulations typically require post-processing analysis to determine hemodynamic parameters of clinical or physiological significance. These include, among others, wall shear stress and strain, energy loss, oscillatory shear index, flow distribution, and particle residence time. While most of these can be directly computed from the flow field, particle residence time calculations currently require additional post-processing simulations.
Residence time and wall shear stress are known to be linked to thrombus formation, which is a serious clinical issue in numerous pediatric and adult cardiovascular disease applications, including stroke, embolism, myocardial infarction, bypass graft failure, device design, and congenital heart disease. Thrombus formation is a multi-factorial process involving complex chemistry, vascular biology, and hemodynamics. These complexities underscore the need for simpler hemodynamic surrogates to assess thrombotic risk.
High wall shear stress (WSS) is known to cause platelet activation, hemolysis, and endothelial cell damage and is associated with thrombotic risk.1, 2, 3 Red blood cell damage has been reported for WSS values in range of 120–300 (dyne/cm2).4, 5, 6 On the other hand, recirculation regions associated with lower WSS and high residence time (RT), in combination with previous exposure to high shear stress, may also increase the risk of thrombus formation.7, 8 Many prior studies report WSS as an important parameter for comparison of different anatomies and clinical scenarios.9, 10, 11, 12 This measure partly accounts for the time-history of red blood cell exposure to altered shear conditions. In this context, RT calculation is a measure of the degree of fluid entrapment in a specific region, providing a time scale for the thrombus formation process to occur.
Residence time calculation is a non-trivial problem with numerous previous definitions proposed in the literature, each of which produces different values. To obtain a measure of RT in a region of interest, most prior studies have proposed a discrete formulation in which particles are released in the flow and their locations are traced over time.13, 14, 15, 16, 17 RT is then calculated based on the time each individual particle spends in the region of interest. RT results obtained from these approaches depend on the number of particles used, often requiring a large number of particles to obtain a smooth spatial distribution. Results can also be highly effected by seeding location, which is typically upstream of the region of interest, inside the region of interest, or at the model inlet.13, 14, 16 Typically, several particle-tracking simulations are needed for pulsatile flow conditions, since the particle initiation time (e.g., relative to the cardiac cycle) affects the results of the RT calculation.13, 14 To mitigate this drawback, particles are often continuously released at the inflow boundary; however, the spatial distribution of seeded particles may not follow the non-uniform velocity distribution at the inlet.16
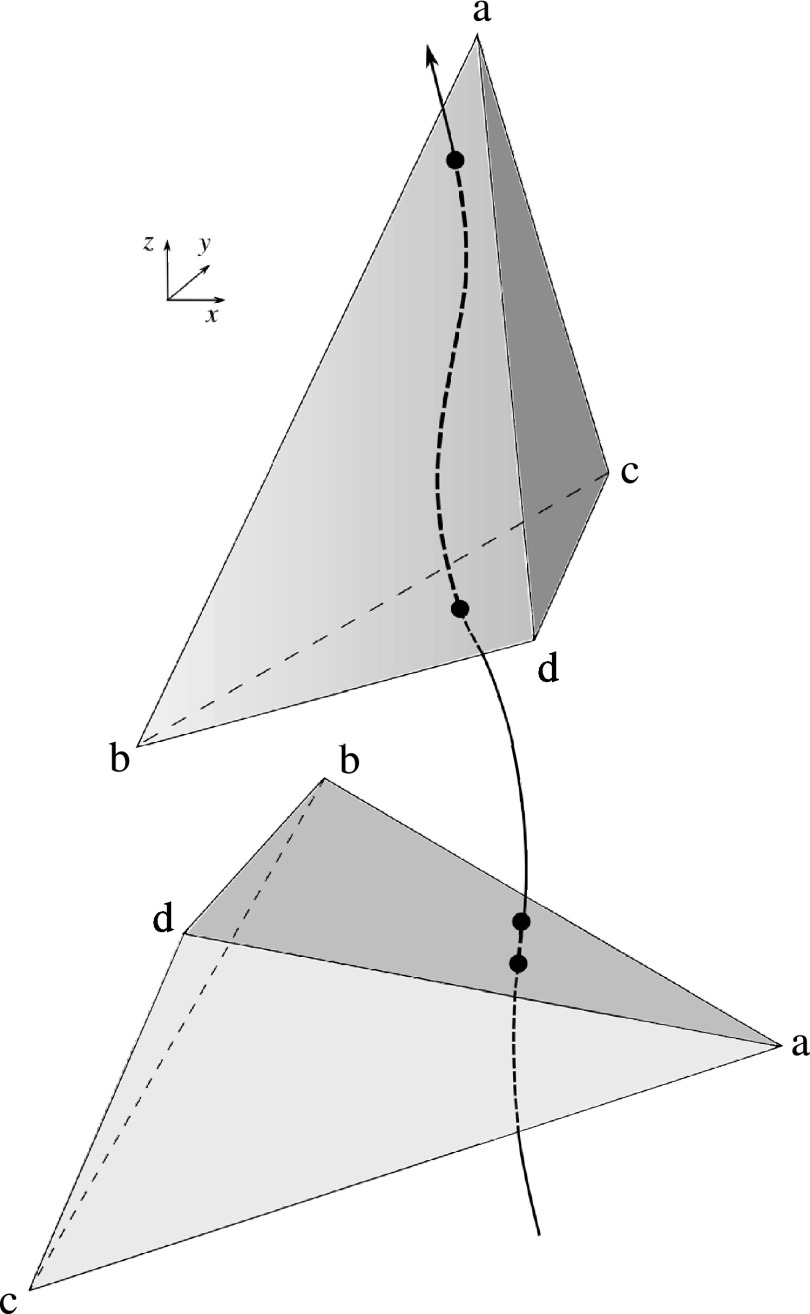
Another drawback of discrete methods is mesh dependency. Because it is often necessary to calculate the time that particles spend inside individual mesh elements, results may depend on the mesh orientation relative to streamlines in the flow. For example, a particle may spend longer in an element that is oriented in the direction of the flow, as shown schematically in Figure 1, producing an artificially higher value of RT. This drawback is more critical for adapted meshes with anisotropic elements. Additionally, particle methods typically require special treatment for particles close to the wall, for example, by adding a small wall-normal velocity to prevent particles from getting stuck on the no-slip boundary. In this work, we offer an alternative approach that avoids the need for large particle numbers with uncertain temporal and spatial resolution, and allows for a continuous and mesh-independent representation of RT.
Figure 1.
Schematic of two possible element orientations. Using a discrete approach, the top orientation produces an artificially higher value of RT compared to the bottom orientation of element “abcd.”
Non-discrete methods for residence time calculation were first introduced for environmental engineering with applications in sedimentation and biology. These methods are based on the solution of an advection-diffusion equation with a non-zero source term.18 There are currently a number of competing definitions of RT in the cardiovascular simulation literature, with no clear consensus. To track contrast agent, Rayz et al. solved an advection equation with a zero source term.19 Narracott et al. calculated RT to model clot formation in a stenosis using an advection-diffusion equation with a non-zero source term.20 In that study, a non-zero source term was used for the entire computational domain and dye was advected from the inlet, so the value of RT depended on the distance from the model inlet to the region of interest. In the present study, we start from two intuitive definitions for RT and go on to develop new non-discrete methods that attempt to address the drawbacks of prior methods. Because we rely on a continuous solution of an advection-diffusion problem, this new method is not limited by the spatial and temporal resolution requirements of particle based methods. Since the present method does not rely on the elements for calculating RT, apart from numerical accuracy of the original solution, the formulation of this method is mesh-independent. This approach also allows one to capture the diffusion process in the boundaries of a region of interest. We also show that for special cases RT can be directly obtained from the velocity field without extra post-processing simulations. We also show that the value obtained from this approach provides a lower bound for the RT value calculated from the advection-diffusion problem.
In previous studies, WSS and RT have been viewed as independent surrogates for thrombotic risk. However, it is clear that these quantities are not physically independent. To quantify the relationship between RT and WSS, a range of clinical scenarios is considered and the correlation between measures of RT and WSS is reported.
METHODS
Residence time calculation
In this section, starting with both existing and slightly modified RT definitions, a mathematical model is constructed and then simplified to obtain a new formulation for calculating RT. We consider two approaches for calculating RT in a region of interest. In the first, we solve an advection-diffusion equation to compute temporally and spatially averaged RT for fluid inside a region of interest. In the second, we calculate the temporally and spatially averaged RT for fluid entering and leaving a region of interest using a control volume approach. In other words, in the first method we examine fluid inside a certain region of interest and calculate the time it has stayed in that region, while in the second method we examine the boundaries of the region of interest and examine the residence time of the fluid passing over these boundaries.
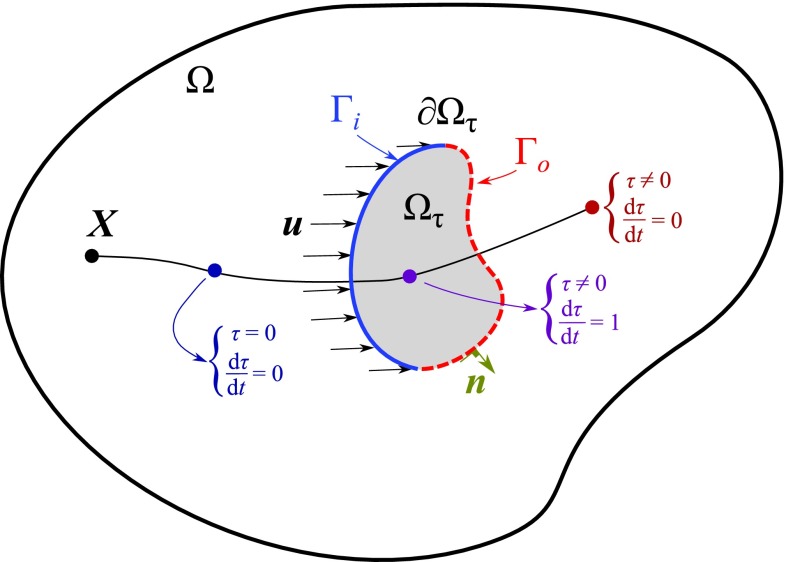
As shown in Figure 2, we denote the time a fluid particle has been in the region of interest, , by , in which and “nsd” denotes the number of spatial dimensions. For fluid that has never entered the region of interest, τ = 0. As soon as a fluid particle enters the region of interest, τ is incremented in time. Hence in a Lagrangian framework
| (1) |
where is the origin of a fluid particle and is defined as
| (2) |
This definition is identical to the formulation in Ref. 18, if Ωτ = Ω or H = 1 is assumed. Note that with this assumption varies with the distance of point x from the inlet. Since we generally wish to calculate RT in a specific region of interest, we assume in general Ωτ ≠ Ω. Defining the operator as follows:
| (3) |
and accounting for diffusion, Eq. 1 in an Eulerian framework is
| (4) |
To derive Eq. 4, it is assumed that there are enough particles to use a continuum mechanics formulation. Also it is assumed that particles follow the pathlines in the flow or . In Eq. 3, , is a periodic velocity field obtained from solving the Navier-Stokes equations in the 3D domain, and κ is the physical diffusion coefficient. In this study, the physical diffusion coefficient is set to zero because it is negligible.
Figure 2.
2D schematic of region of interest Ωτ in the computational domain Ω. A single Lagrangian particle originating at X is shown at three locations, each with different time derivative.
Equation 4 is an advection-diffusion equation with a non-zero source term that is solved in a post-processing step to find τ. This partial differential equation can be solved using various numerical methods, including a finite element approach. Using a finite element method, we find such that for all , in which , the following stabilized weak form holds:21
| (5) |
where is the number of simulated cycles and and are defined as
| (6) |
| (7) |
where is the Jacobian that maps between the parent and physical domains,22 and is a discontinuity capturing diffusion coefficient. This residual based coefficient goes to zero as L goes to zero, and is minimally intrusive where ∇τ is maximal. This is added to improve the solution by removing the overshoot and undershoot adjacent to a jump in τ.21, 23 The last term in Eq. 5 is a nonlinear function of τ; therefore, multiple nonlinear iterations are performed at each time step to obtain convergence (3 iterations are used in our computations). A Dirichlet boundary condition is imposed on inlets and outlets with backflow and a Neumann boundary condition with zero flux is imposed on the walls. The Dirichlet boundary condition is imposed on outlets with partial backflow to prevent any possible divergence of the simulations or unrealistic solution. Note that in the studied scenarios since advection is much stronger than diffusion, the imposed value on the outlets in the presence of outward flow have a negligible effect on the interior solution.
The first measure of residence time, , is calculated by averaging τ over Ωτ × ((n − 1)T, nT] so that
| (8) |
where
| (9) |
The number of simulated cycles, n, is selected such that the transient part of the solution is damped and τ is a periodic function of time. To ensure periodicity, RT1 is calculated from Eq. 8 and the result is compared to its preceding cycle.
The second measure of residence time, RT2, is calculated based only on the particles that are entering and leaving Ωτ. We define and , in which is the outward normal vector to Ωτ (Figure 2). Note that Γi∪Γo = ∂Ωτ and Γi∩Γo = {} and the total time spent in Ωτ by the fluid is equal to the increase in τ from Γi to Γo. We let be the average flow into Ωτ in time T, so that the continuity equation gives
| (10) |
Considering a non-uniform distribution of τ and u over ∂Ωτ, we have
| (11) |
which is a temporally and spatially weighted average of the increase in τ from Γi to Γo. Considering the definition of Γi and Γo,
| (12) |
Integrating Eq. 4 over Ωτ × [(n − 1)T, nT] gives
| (13) |
The first integral in Eq. 13 vanishes due to cyclic periodicity, as is typically the case in cardiovascular simulations. Integrating H and applying the divergence theorem to the second integral gives
| (14) |
Considering the continuity equation, the second integral in Eq. 14 is zero, hence,
| (15) |
| (16) |
This result is a very simple formula for calculating RT, which requires measuring only the volume of a region interest, , and the average flow passing through the boundaries of the region of interest in a cycle, . This result is identical to the definition of flushing time that has applications in environmental flows.24, 25 Note that this measure of RT does not require solving the advection-diffusion problem and can be directly calculated from the velocity field at the boundaries of the region of interest, i.e., all such that . Since the incompressibility assumption was used to derive Eq. 15, Eq. 16 is only valid for incompressible flows, while Eq. 8 can be used for compressible flows as well. In the case of Ωτ = Ωτ(t), as is the case in fluid-structure interaction (FSI) problems using the arbitrary Lagrangian-Eulerian (ALE) method, it can be shown that the above result holds if u is replaced with and is calculated on the referential domain, in which is the referential domain velocity.26 In this case, is time dependent in RT1 calculation (Eq. 8) and time average of is used in RT2 calculation (Eq. 16).
RT1 and RT2 relationship
Although the definitions of RT1 and RT2 are distinct, they are strongly related. Here we show that RT2 can be used as a lower bound for RT1.
Lemma 1: Let τ be zero at Γi, then
| (17) |
Proof: Integrating Eq. 1 in time with H ⩾ 0 directly produces this result.
Lemma 2: For a non-diffusive steady flow, in which κ = 0 and , in a manifold defined by the following relation holds: RT2 ⩽ 2RT1.
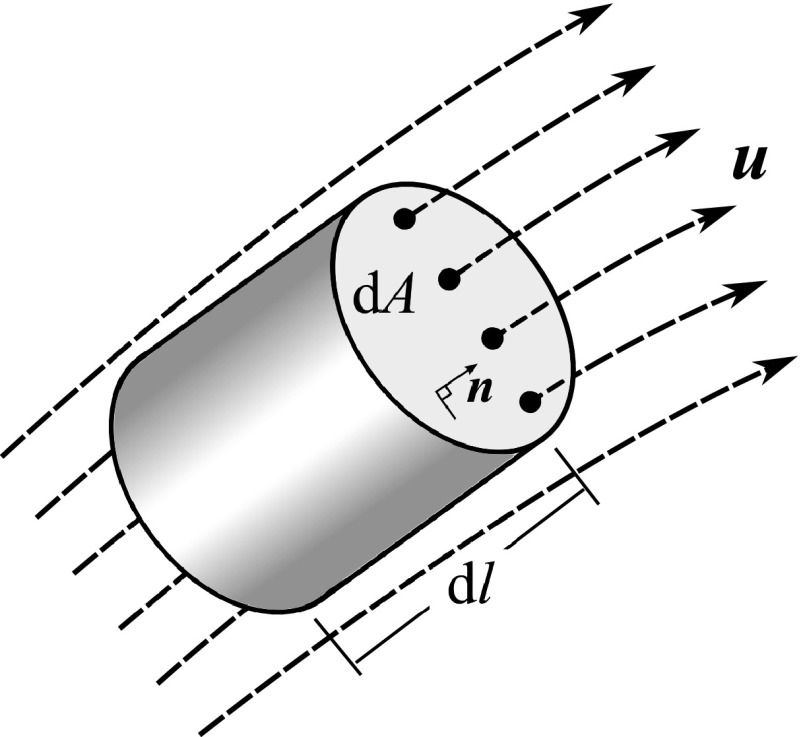
Proof: A schematic of a topological manifold is shown in Figure 3. Equation 4 in a non-diffusive steady flow is
| (18) |
Integrating Eq. 18 on a manifold gives
| (19) |
which after integration by parts and applying the continuity relationship gives
| (20) |
and since is constant along s and H = 1, from Eq. 18,
| (21) |
Simplifying Eq. 8 for a manifold with the above properties and using a steady flow assumption gives
| (22) |
After evaluating Eqs. 20, 21, 22, we have
| (23) |
which after integration is
| (24) |
Now Eq. 16 for a steady flow on a manifold is
| (25) |
which with Eq. 20 reduces to
| (26) |
Since based on Lemma 1, τ(0) ⩾ 0, the proof is complete. Note that if x(0) ∈ Γi, τ(0) = 0, and RT2 = 2RT1.
Figure 3.

Schematic of a single topological manifold, S, which encloses a flow streamline. Velocity at each section, , cross section area, δA(s), flow rate, δQ, and its extents, , are shown. Note there is no transport across Γt.
Lemma 3: If for i = 1, 2 and Ωi ⊂ Ωτ, Ω1∩Ω2 = {} the following is true: , then for Ωt = Ω1 ∪ Ω2, is also true.
Proof: By breaking the integral in Eq. 8 into two sub-domains, it can be shown that
| (27) |
and from Eq. 16, it can be shown that
| (28) |
Defining
| (29) |
then
| (30) |
and since we have
| (31) |
and hence
| (32) |
Multiplying Eq. 32 by and adding to both sides gives
| (33) |
Rearranging, we have
| (34) |
and hence from Eq. 28,
| (35) |
and since ,
| (36) |
and hence from Eq. 27,
| (37) |
| (38) |
Proposition: For a steady non-diffusive flow, RT2 ⩽ 2RT1 on Ωτ.
Proof: Let us divide Ωτ into n manifolds such that
| (39) |
and
| (40) |
Note that, Eq. 39 does not impose any extra assumptions since there is no upper bound imposed on n and Ωi can be selected as an infinitesimal volume that satisfies Lemma 2. From Lemma 2 for each Ωi,
| (41) |
Defining
| (42) |
and
| (43) |
and using Lemma 3, we have the following:
| (44) |
Since
| (45) |
we have
| (46) |
which completes the proof. Physically, the ratio is an indicator of the degree of flow disturbance. In a completely unidirectional flow, which is associated with a single manifold, this ratio is equal to two, where as in a highly disturbed flow with mixing it is closer to zero.
Point-wise RT
A point-wise definition of RT can be extracted from RT2 by reducing the volume of the region of interest, , to an infinitesimal value. However, RT2 goes to zero as goes to zero, which is expected from a physical point of view. Therefore, to define a point-wise measure of RT that is independent from the volume, we define RT per unit length, , i.e., the time required for a fluid particle to travel a unit length from any given point in the direction of flow. One might find this analogous to the normalization of residence time or exposure time by the volume in discrete methods.13, 14, 16 Considering the schematic shown in Figure 4 and Eqs. 9, 10, 16 and setting gives
| (47) |
in which Γw is the wall boundary, where and RTx is not defined. As expected, the value of the point-wise RT reduces to the inverse of the velocity magnitude at that point.
Figure 4.
Schematic of a finite element considered for point-wise RT calculation. Note that the selected element is aligned with the direction of flow, i.e., .
TEST CASES
To demonstrate the application of the proposed RT definitions and determine their relationship to WSS and flow structures, three scenarios are considered in this section: (1) A 2D flow over a cavity, (2) flow through an idealized model of a single ventricle heart patient simulated with a multi-domain method, and (3) flow in a patient specific model of coronary aneurysms caused by Kawasaki disease (KD).
The results that are obtained directly from the velocity field, including WSS, RT2, RTx are calculated numerically based on previously computed velocity data. To solve Eq. 5 and obtain RT1, an in-house finite element code is used.
Flow over a cavity
In this case study, we consider a 2D model of a cavity in cross flow. This example is designed to demonstrate the behavior of different measures of RT in a strong recirculating flow.
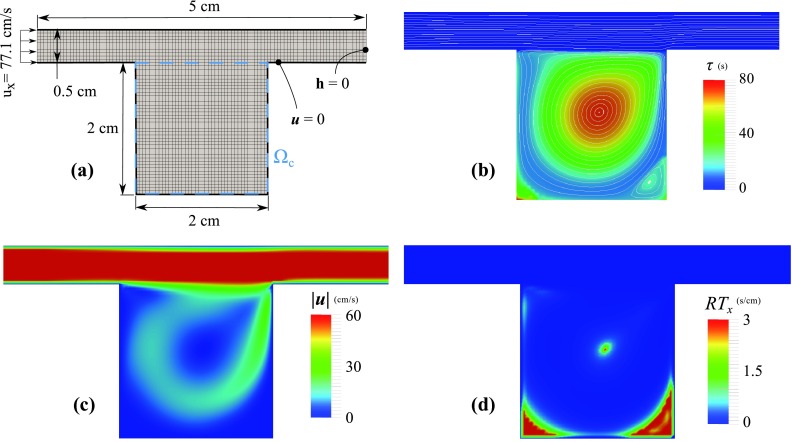
The computational domain, Ω, is an ensemble of a 2×2 cm cavity attached to a 5×0.5 cm duct (Figure 5a). The fluid viscosity and density are 1.82 × 10⁻⁴ g/(s cm) and 1.18 × 10⁻³ g/cm3, respectively. At the inlet, a uniform velocity (77.1 cm/s) is prescribed and zero traction is imposed at the outlet. Based on the cavity dimension this produces Re = 1000. A uniform bilinear mesh with a size of 0.5 mm is used that produces 2600 elements and 2751 nodes. Two regions of interest are considered: (1) Ωτ = Ω and (2) Ωτ = Ωc (see Figure 5a). This is to show the sensitivity of RT1 and RT2 to the region of interest selection.
Figure 5.
Flow over a 2D cavity, (a) The mesh and dimensions of the computational domain, (b) flow streamlines are plotted on top of τ contours, obtained from solving Eq. 5, (c) velocity magnitude contours, and (d) RTx contours. While τ is very high at the central recirculation regions, RTx fails to identify this region. The velocity streamlines are roughly perpendicular to ∇τ inside the cavity.
Flow is stagnant at the bottom corners and vorticity is high in the middle, trapping the fluid inside the cavity (Figure 5). This caused τ to be in the range of 50 s in the center and bottom corners of the cavity, as compared to τ ≈ 0.05 s in the duct. This shows that recirculation regions may produce much higher τ compared to regions with uni-directional flow. For this case RTx, which only depends on the local velocity value, is only high at the corners and fails to predict high RT for the central region.
RT1 and RT2 are calculated for the cavity only (Ωc) and the entire computational domain (Ω), with results summarized in Table 1. RT2, which is directly proportional to , differs significantly between these two regions of interest. Due to much higher τ inside the cavity, is almost the same between two regions of interest, causing RT1 only to scale with the area of the region of interest. As a result, the ratio is increased by a factor of 23, by selecting cavity as the region of interest instead of the entire domain.
Table 1.
Simulation results for the cavity model. Results are reported for two regions of interest: the cavity only (Ωτ = Ω), and the entire computational domain (Ωτ = Ωc). Note the sensitivity of RT2 to the region of interest selection.
| Ωτ | (cm2) | (cm2/s) | (cm2 s) | RT1 (s) | RT2 (s) | |
|---|---|---|---|---|---|---|
| Ω | 6.5 | 38.56 | 135.9 | 20.90 | 0.17 | 0.008 |
| Ωc | 4.0 | 0.627 | 135.5 | 33.87 | 6.38 | 0.188 |
Single ventricle patients
Hypoplastic Left Heart Syndrome (HLHS) and other single ventricle conditions occur in approximately 2.4 out of 10 000 live births.27, 28 Neonates with pulmonary atresia or severe pulmonary stenosis associated with balanced or unbalanced ventricles represent a heterogeneous group of patients that often require initial surgical palliation by means of systemic-to-pulmonary artery shunts. Currently, children diagnosed with these abnormalities undergo three palliative open-heart surgeries. Immediately after birth, these neonates require initial surgical palliation by means of systemic-to-pulmonary artery shunts that provide an oxygenated blood supply until further surgical procedures can be performed. The goal of this surgery is to use the single functional ventricle to pump blood to both systemic and pulmonary arteries (PAs).27, 28 Failure of this surgery often involves thrombus formation that blocks the pulmonary circulation, leading to hypoxia and sudden death. In our first example, we explore the RT formulation in an idealized post-surgical anatomy, with one or two systemic to pulmonary shunts (Figure 6). This idealized model includes the systemic to pulmonary connection, the aortic arch, four upper branches, two coronary arteries, and the pulmonary arteries. Each of these branches is created by lofting vessel segments along their centerline. This process is performed using a customized in-house version of the open source Simvascular software package29 with more details provided on surgical and simulation methods in our previous work.30
Figure 6.

Representative anatomies used in this study: (a) distal BTS and a 4.0 mm PDA, (b) proximal BTS and a 3.0 mm PDA, and (c) proximal BTS and a 4.0 mm CS. The PA segment (the red region between CS/PDA and BTS) and the BTS (the blue region) are used to compare RT and WSS results.
Three basic geometries were constructed to include (Figure 6): (a) a distal Blalock-Taussig shunt (BTS) and a patent ductus arteriosus (PDA), (b) a proximal BTS and a PDA, and (c) a proximal BTS and a central shunt (CS).
While the flow in the shunt is always unidirectional, flow stagnation can occur in the PA segment due to flow competition from the BTS and the PDA/CS. Depending on the diameter of the PDA/CS, the flow in this region can be stagnant, directed toward the right pulmonary artery (RPA), or directed toward the left pulmonary artery (LPA). Ten geometries were constructed for cases (a) and (b) with PDA diameters of: 0.0 (no PDA), 2.0, 3.5, 4.0, and 5.0 mm. Three geometries were constructed for case (c) with the CS diameters of: 2.0, 3.0, and 4.0 mm. For cases (a) and (b) two values of the pulmonary vascular resistance (PVR) were simulated. In total, 23 cases were simulated and compared.
All 3D models were meshed with tetrahedral elements using the commercial package MeshSim© (Simmetrix, Clifton Park, NY). To study the mesh sensitivity, the model with a single BTS was considered. For the interior, four maximum edge lengths of 1.0, 0.8, 0.625, and 0.5 mm were selected, producing approximately 130 K, 210 K, 400 K, and 700 K tetrahedral elements, respectively. The maximum edge length for the coronary artery wall was 40% of the interior maximum edge length and the maximum edge length for the other walls was 80% of the interior maximum edge length for all mesh densities. After simulating five cardiac cycles, the differences in the cardiac output between the first three meshes and the last mesh (most refined one) were 2.91%, 0.793%, and 0.524%, respectively. Based on these results, an interior maximum edge length of 0.625 mm was chosen for this study, producing an average of 400 K elements for all models.
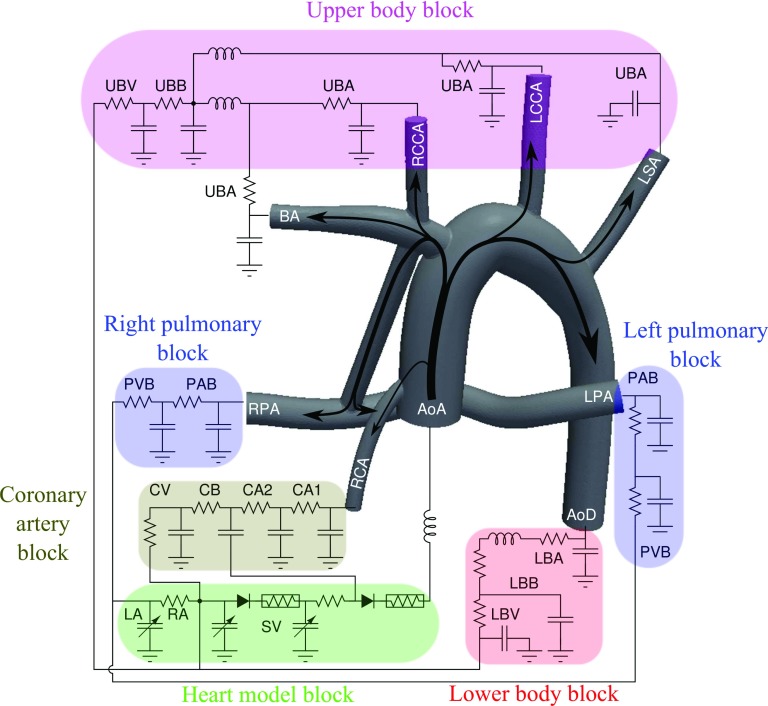
Flow simulations were performed using a multi-domain approach, in which the 3D computational fluid dynamic (CFD) domain is coupled to a 0D domain. The 0D domain consists of a lumped parameter network that models the heart and downstream circulation following our previous work (Figure 7).30, 31, 32 This multi-domain simulation, which models the vascular system in a closed loop, provides spatial and temporal information in the 3D domain and global temporal information at particular points in the 0D domain. A robust iterative implicit method is used to couple the 3D and 0D domain through the boundaries.33 All outlets are coupled Neumann boundaries and the inlet, i.e., the ascending aorta, is a coupled Dirichlet boundary. In the in-house finite element flow solver, we make use of a stabilized formulation (see, e.g., Refs. 34, 35, 36, 37), which allows equal-order velocity and pressure interpolation, and addresses the convective instability associated with Galerkin's method. Due to the presence of reversed flow at the outlets, special care is taken at the coupled Neumann boundaries to avoid rapid simulation divergence by using a minimally intrusive method, in which an advective stabilization term is added to the weak form.38, 39 A specialized preconditioning method is used to solve the linear system of equations, achieving significant improvements in efficiency compared to standard methods.40 An efficient data structure is used in the linear algebraic equations solver to improve parallel scalability.49
Figure 7.
The lumped parameter network (LPN) coupled to the geometry with single BTS. This LPN contains blocks for the upper body arteries (UBA), upper body capillary bed (UBB), upper body veins (UBV), pulmonary artery bed (PAB), pulmonary vein bed (PVB), lower body arteries (LBA), lower body capillary bed (LBB), lower body veins (LBV), two coronary artery (CA1, CA2), coronary capillary bed (CB), coronary veins (CV), left atrium (LA), right atrium (RA), and single ventricle (SV). The ascending aorta (AoA), descending aorta (AoD), brachiocephalic artery (BA), right common carotid artery (RCCA), left common carotid artery (LCCA), left subclavian artery (LSA), left pulmonary artery (LPA), right pulmonary artery (RPA), right coronary artery (RCA) are shown in the 3D model.
Two regions of interest are considered: a segment of the PA between the BTS and PDA/CS and the BTS (red and blue regions in Figure 6, respectively). The two regions of interest are selected based on the dramatic difference in their hemodynamics and their potential clinical significance. The flow inside the BTS is unidirectional for the entire cardiac cycle, since blood flows to the lower pressure pulmonary arteries from the higher pressure systemic side. In the PA segment, however, there is flow competition between the BTS and PDA/CS and the flow direction is highly dependent on the diameter of the PDA/CS. The flow at the core of this region is stagnant for the midrange PDA/CS diameters with highly unsteady recirculation regions close to the BTS and PDA/CS anastomoses.
The advection-diffusion problem was solved using the same finite element method time integration and spatial discretization scheme as the Navier-Stokes solver. In these simulations T was the length of the cardiac cycle and the time step size was set to 5 × 10⁻⁴ s. The normalized difference between the results of the second and subsequent cycles was on the order of 10−7, demonstrating that cyclic convergence was obtained after two cycles.
RT1 and RT2 were calculated (Eqs. 8, 16) for these two regions and WSS was spatially averaged over the walls (Table 2).
Table 2.
Comparison between RT and WSS. “PA-Seg” denotes the region between the PDA and BTS and “BT” denotes the region in the BTS (see red and blue regions in Figure 6). D is the diameter of the PDA/CS, with D = 0 corresponding to the single BTS case. “Geom” denotes the choice of geometries shown in Figure 6. PVR is the pulmonary vascular bed resistance (“N” denotes normal PVR and “H” denotes one fold increase in PVR).
|
RT1 (ms) |
RT2 (ms) |
WSS (cgs) |
||||||
|---|---|---|---|---|---|---|---|---|
| Case | D | Geom/PVR | PA-Seg | BT | PA-Seg | BT | PA-Seg | BT |
| 01 | 0.0 | A/N | 30.4 | 4.3 | 48.0 | 8.4 | 98.9 | 267 |
| 02 | 0.0 | A/H | 32.4 | 4.5 | 51.7 | 8.9 | 91.9 | 252 |
| 03 | 0.0 | B/N | 28.4 | 4.3 | 38.0 | 8.0 | 93.9 | 244 |
| 04 | 0.0 | B/H | 28.3 | 4.6 | 39.4 | 8.4 | 91.5 | 232 |
| 05 | 2.0 | A/N | 56.5 | 4.7 | 44.9 | 9.1 | 58.9 | 249 |
| 06 | 2.0 | A/H | 57.5 | 5.0 | 47.6 | 9.8 | 58.4 | 232 |
| 07 | 2.0 | B/N | 50.6 | 4.8 | 30.0 | 8.9 | 77.7 | 219 |
| 08 | 2.0 | B/H | 51.5 | 5.1 | 31.7 | 9.5 | 73.8 | 206 |
| 09 | 3.5 | A/N | 50.5 | 6.1 | 40.7 | 11.2 | 78.0 | 207 |
| 10 | 3.5 | A/H | 58.0 | 7.0 | 44.1 | 12.8 | 67.3 | 181 |
| 11 | 3.5 | B/N | 28.1 | 6.2 | 27.2 | 11.2 | 107.3 | 174 |
| 12 | 3.5 | B/H | 35.8 | 7.0 | 31.5 | 12.7 | 90.7 | 154 |
| 13 | 4.0 | A/N | 36.3 | 6.8 | 39.2 | 12.2 | 84.7 | 190 |
| 14 | 4.0 | A/H | 44.0 | 7.8 | 45.2 | 13.8 | 74.2 | 167 |
| 15 | 4.0 | B/N | 21.7 | 6.8 | 26.8 | 12.3 | 119.5 | 159 |
| 16 | 4.0 | B/H | 27.0 | 7.7 | 32.0 | 13.9 | 101.4 | 140 |
| 17 | 5.0 | A/N | 23.8 | 8.5 | 34.7 | 14.1 | 105.3 | 164 |
| 18 | 5.0 | A/H | 28.5 | 9.9 | 39.7 | 16.5 | 90.7 | 139 |
| 19 | 5.0 | B/N | 14.9 | 8.4 | 22.8 | 14.8 | 131.3 | 134 |
| 20 | 5.0 | B/H | 17.5 | 9.9 | 26.5 | 17.3 | 114.0 | 113 |
| 21 | 2.0 | C/H | 47.9 | 5.0 | 36.3 | 9.3 | 79.0 | 211 |
| 22 | 3.0 | C/H | 73.7 | 5.6 | 38.9 | 10.2 | 49.4 | 190 |
| 23 | 4.0 | C/H | 58.6 | 6.4 | 38.5 | 11.8 | 51.5 | 167 |
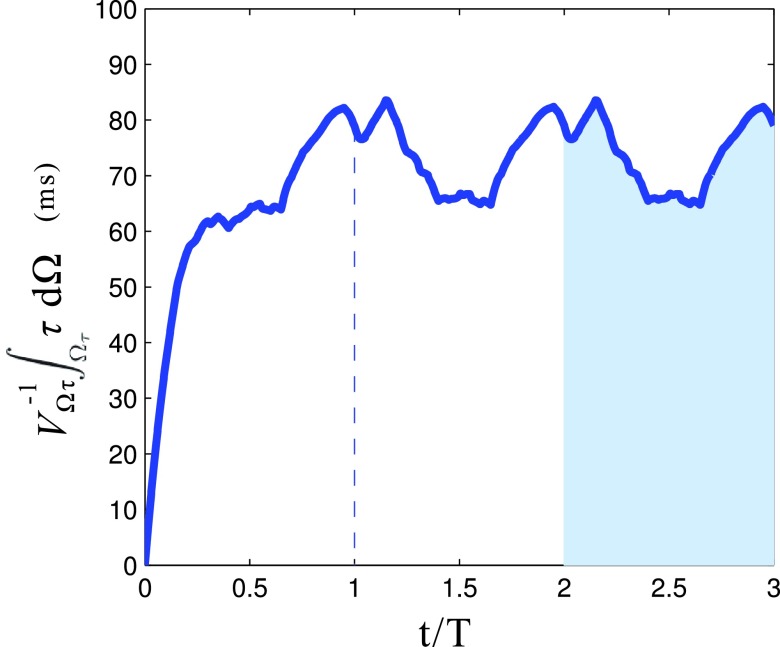
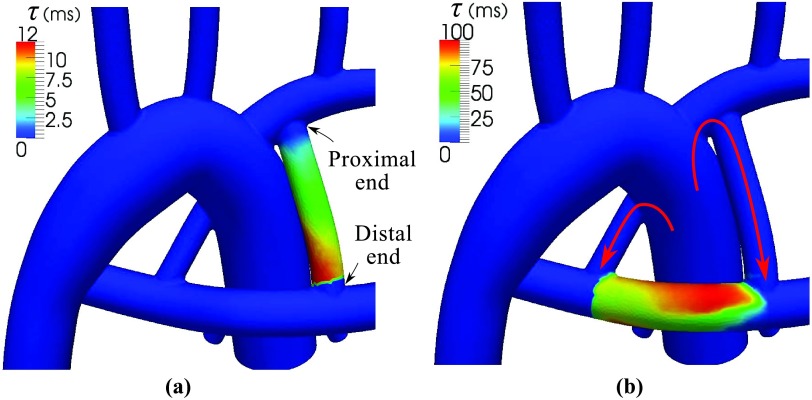
Due to the flow pulsatility, the spatial average of becomes nearly periodic after the first cardiac cycle with a higher value during diastole and a lower value during systole, as expected (Figure 8). Due to the unidirectional flow in the BTS, varies almost linearly in the BTS (Figure 9a), starting from zero at the proximal/systemic end and reaching approximately 2RT1 at the distal/pulmonary end, producing a spatial average of RT1. Since at the distal end, i.e., Γo, is essentially equal to RT2, RT2 ≈ 2RT1 in the BTS, which is consistent with the results in the Table 2. However, looking at RT in the PA section, this approximation is no longer true due to the presence of vortices near the PA segment boundaries. This flow produces high towards the center despite higher flow rates at the boundaries (Figure 9b), leading to higher RT1 and lower RT2. The ratio is close to 2 in the BTS and close to 1 in the PA section. Consistent with Eq. 46, the flow in the BTS can be assumed to be a single manifold, while the flow in the PA section is recirculating and is composed of several manifolds.
Figure 8.
Time variation of spatial average τ in the PA section for the case with 3.0 mm CS. The shaded area is equal to RT1.
Figure 9.
(a) Spatial distribution of time averaged τ in the BTS. Note the linear distribution due to the unidirectional flow. (b) Spatial distribution of time averaged τ in the PA. Note the higher value at the center of the PA that leads to higher RT1. Due to the high flow rates across the boundaries of the PA-Seg, RT2 has a lower value in this case. The proximal and distal ends of BTS and flow direction in the BTS and PDA are shown.
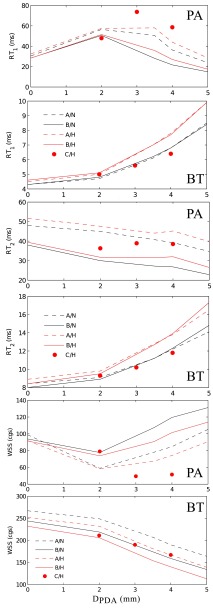
The results of Table 2 are summarized in Figure 10. The 3.0 mm CS and 3.5 mm PDA cases had the highest RT in the PA, confirming the presence of a stagnation region between the BTS and PDA at mid-range diameters. Increasing the PDA diameter beyond 3.5 mm reduces RT in the PA because an imbalance between the PDA/CS and the BTS flow leads to flow through the PA segment. Since the PA flow rate is lower for the higher PVR cases, RT is higher in the PA and BTS for these cases.
Figure 10.
RT1, RT2, and WSS in the PA segment and in the BTS as a function of PDA diameter. See Table 2 for notation details.
Examining the general trends in Figure 10, RT1 and RT2 are generally directly related while RT1 and RT2 are anti-correlated with WSS. To quantify this relation more directly, we computed the correlation between these three parameters, which is defined as
| (48) |
(Figure 11). Good correlation was obtained between RT1 and WSS in both regions of interest, which are associated with different hemodynamics. However, the slope of the correlations in the BTS and PA segment is not the same. As discussed before, RT1 and RT2 are strongly correlated in the BTS, but poorly correlated in the PA segment.
Figure 11.

Correlation between RT1, RT2, and WSS measured in the BTS (blue) and in the PA-Seg (red). Dashed lines are the best correlated lines. RBT and RPA are the correlation values between parameters in corresponding region and Rtot is the correlation between parameters calculated based on all the data points from both regions.
Kawasaki disease
In our third case study, we consider a patient specific model of coronary aneurysms caused by KD. KD is the leading cause of acquired heart disease in children, resulting in coronary artery aneurysms in up to 25% of untreated patients. Patients with aneurysms are at a higher risk of thrombosis formation inside the aneurysms, which can lead to myocardial infarction and sudden death.41, 42 Regions of low wall shear stress and high particle residence times in the aneurysm are hypothesized to be an indicator for higher risk of thrombus formation. Clinicians treating KD patients currently use aneurysm diameter as the primary determinant of thrombotic risk, according to American Heart Association (AHA) guidelines. Aneurysm diameter is typically measured using CT imaging, and patients with diameters >8 mm are treated with anticoagulation therapy. Clinicians are thus often faced with a difficult decision to treat otherwise normal healthy patients with aggressive anticoagulation therapy or to treat with antiplatelet therapy alone and accept the risk of possible myocardial infarction. While aneurysms can be imaged to obtain detailed anatomical information, there are currently no available clinical tools to predict the risk of coronary artery thrombosis or myocardial infarction. Simulations can provide critical hemodynamic information linked to thrombotic risk, including WSS, RT, and oscillatory shear index (OSI), which are difficult or impossible to obtain from standard imaging modalities.
Our previous work revealed markedly abnormal hemodynamic conditions compared to normal control, including low WSS and high particle RT, in a case study of a 10 year old male KD patient (Figure 12).15 Subsequently, hemodynamic simulations in a group of KD patients with aneurysms have demonstrated better correlations between simulated WSS and particle RT and incidence of thrombosis compared to using aneurysm diameter alone.43 Here, we use the previous results from one patient to compute RT using the proposed method, and compare to prior discrete model calculations.
Figure 12.
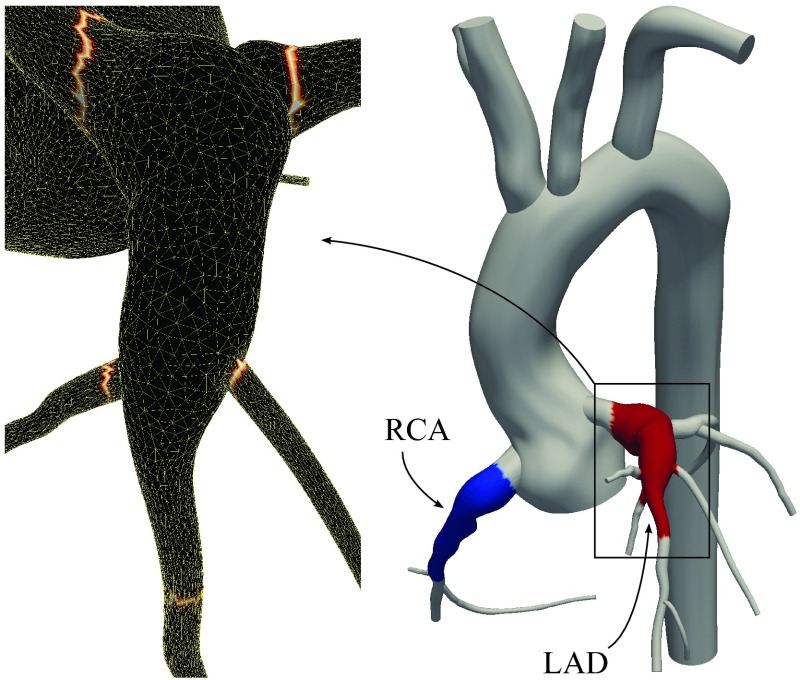
The regions of interest, Ωτ, are indicated by red and blue on the right. The tagged surface for calculating RT2 in the red region is outlined by a brighter color on the left. is evaluated on these boundaries to calculate RT2.
For RT calculations, the formerly used mesh and reported velocity are used.15 Model construction, simulation, and adaptive meshing methods are described in our prior work. The maximum diameter of the left anterior descending coronary artery (LAD) and right coronary artery (RCA) were 1.14 and 1.08 cm, respectively. The mesh contained over 3.5 × 10⁶ tetrahedral elements with a 0.2 mm minimum element size. A boundary condition that is specifically designed for the coronary arteries was used and an implicit method was used to couple boundary conditions to the 3D domain.44 Flow simulation was continued for six cardiac cycles, with a time step size of 1 ms.
Regions of interest are colored red and blue in Figure 12. Due to the higher residence times, the advection-diffusion solver required 6 cycles to obtain converged solution with a time step size of 1 ms.
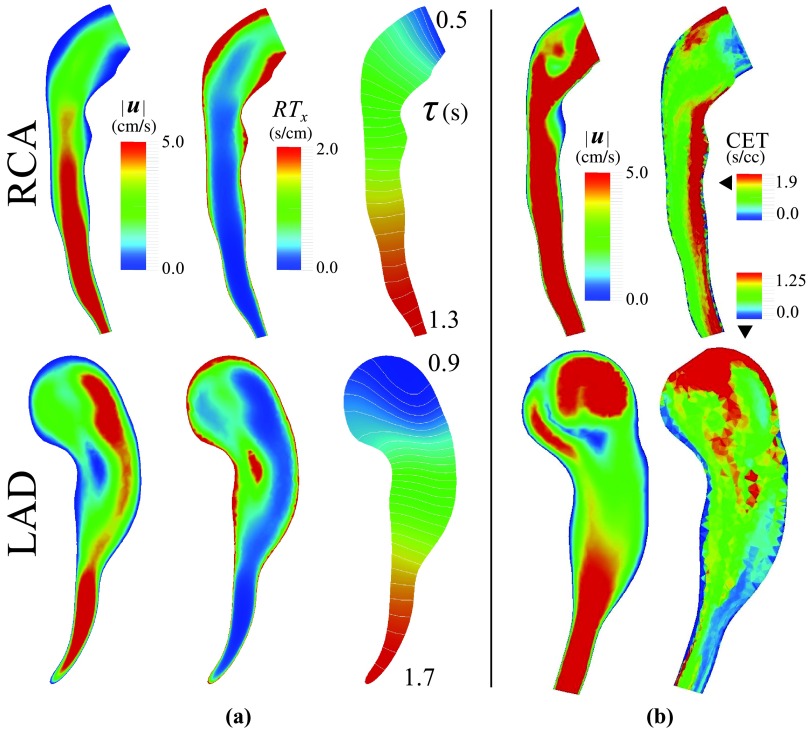
High RT is predicted for aneurysmal regions closer to the wall and the middle section of the LAD, where the flow is changing direction (Figure 13). Due to the lower velocities and recirculating flow, RT values were higher in this model compared to the second case study (Figure 9). Cumulative exposure time (CET), which is calculated with a discrete method, was used previously to quantify RT in the LAD and RCA.15 CET has units of time per unit volume, hence a quantitative comparison cannot be made between CET and RTx. Qualitatively, however, CET and RTx are similarly high in the low velocity regions. CET has an advective effect and predicts higher values in the distal RCA, despite the high velocity in that region (Figure 13b). Although 10M particles were released in each cardiac cycle, the CET contours remain pixelated with a large variation between two adjacent elements. To compare simulation costs, the full blood flow simulations took 26 h on 60 processors, the CET calculation took 2–3 days on a single processor, and the advection-diffusion simulation took 18 h on a single processor.15 This indicates the lower computational cost of the proposed method, though simulation times for both CET and the proposed method could be improved through parallelization.
Figure 13.
(a) Time-averaged velocity, local residence time, RTx, and τ in the LAD and RCA. Regions of high RTx are associated with regions of low velocity. Note the linear distribution of τ in the downstream branches due to the unidirectional flow. (b) Velocity and CET using a discrete method taken from prior work.15 Note the continuous distribution of RT measures obtained using the proposed method.
The ratio is larger in the RCA compared to the LAD, indicating less flow disturbance in the RCA (Table 3). This can be linked to more uniform variation of τ along the RCA compared to the LAD.
Table 3.
RT1 and RT2 in the LAD and RCA. The regions of interest and the model are shown in Figure 12.
| Ωτ | RT1 | RT2 | |
|---|---|---|---|
| LAD | 1.178 | 0.988 | 0.839 |
| RCA | 0.817 | 1.077 | 1.318 |
DISCUSSION
Clot formation is a gradual process, requiring regions of trapped fluid for platelet aggregation to occur. RT is a measure which is sought to identify regions with trapped fluid, thus acting as a surrogate quantitative measure of the likelihood of clot formation. Since there is currently no universal definition of RT, we proposed two intuitive definitions (RT1 and RT2) to quantify RT in a given region of interest. Considering τ as the time that particles are inside the region of interest, RT1 is the average of τ over the region of interest. Physically, this is equivalent to the average in time that particles have been in a region of interest. RT2 is calculated by averaging τ over the boundaries of the region of interest. This can be interpreted as the average of the time that particles leaving the region of interest, have been in that region. This measure reduces to RTx by reducing the size of region of interest to a point and normalizing it with a characteristic length. In that sense, RTx is a spatial comparative measure of RT at a point, which is directly proportional to the inverse of the velocity norm.
In this study, a non-discrete method was formulated for RT calculations using an Eulerian framework. A time-dependant advection-diffusion equation was solved to compute RT1 or a control volume technique was used to compute RT2 based on boundary fluxes on the region of interest. As a result this method accounts for diffusivity and in our experience requires less computational cost and complexity compared to discrete methods. With the present approach, the same numerical framework used in the flow solver can be used to calculate RT. Extending the proposed method to a FSI application with a moving domain will only require including the referential domain velocity in the advective term, hence minimal implementation effort is required. The presented formulation is not based on the calculation of RT or exposure time in individual elements, hence this method can be applied accurately to an anisotropic mesh with a wide range of element sizes. We note that discrete methods have been used effectively in computing Lagrangian coherent structures (LCS) derived from dynamical systems theory for improved understanding of unsteady flow structures. Previous methods have used LCS in the cardiovascular setting to characterize flow in aneurysms and for assessing thrombotic risk.45, 46
We have shown that local representation of RT is directly related to the local velocity. RT2 was shown to be a lower bound for 2RT1 in steady non-diffusive flow; however, this relation also held for all unsteady cases we considered. Extension of the presented proof to unsteady diffusive flows is left as a subject for future studies. The applicability of this method was shown in a 2D recirculating flow and two representative clinical scenarios, including multiple geometries associated with a first stage single ventricle repair, and a coronary artery aneurysm in a KD patient.
The finite element framework used in this work for solving the advection-diffusion equation requires stabilization that is standard to all finite element methods for fluid. In practice, this translates to the accuracy of the solution, τ, that among other factors depend on the mesh quality, time step size, and Peclet number. In the presented formulation, τ typically lives in the same discrete space as velocity, linking its numerical accuracy to the Navier-Stokes equations solution quality. In other words, by reducing the mesh size and reducing the error of the Navier-Stokes solution (which is the transport of momentum), the error of the advection-diffusion equation solution also reduces (which is the transport of τ).
The main purpose of calculating RT is to identify recirculation regions that trap fluid for extended times. Selecting a region of interest that contains a recirculation region produces locally high τ, leading to high RT1. The value of RT2, on the other hand, is determined only by the flow through the boundaries, regardless of the hemodynamic behavior within the domain. This indicates RT2 is more sensitive to the selected region geometry and may not adequately capture a recirculation region if Ωτ is not selected properly. Hence, although RT2 has the advantage of negligible computational cost, RT1 was found to be a more physically consistent measure of RT. Likewise, RTx, which is calculated only based on local quantities, fails to capture recirculation regions that depend on the global spatial characteristics of the flow.
In this study, we observed good correlation between WSS and RT1 in the single ventricle example. This is consistent with previous in vivo and experimental studies, which reported an inverse correlation between WSS and RT.47, 48 In the BTS, due to the unidirectional flow, there was a strong correlation between RT1 and RT2, hence also between WSS and RT2. However, in the PA segment, there were many structures in the flow and the flow direction changed with the PDA/CS diameter. Hence the strong correlation between WSS and RT1 is less obvious. This suggests high RT can also be directly linked to low WSS regions, and hence either of these two parameters may be useful for evaluating a clinical scenario. Since WSS and RT scale differently with vessel diameter, viscosity, and the length of the region of interest, WSS and RT1 are not correlated in the two different regions of interest considered in the first clinical scenario (Rtot is not close to −1 in Figure 11). We observed this correlation in a single case study, hence before any generalization this result must be confirmed by further studies in the future.
In the third case study on Kawasaki disease, the proposed measures of RT offer a promising means to obtain surrogates for thrombotic risk that could be used to improve patient selection for anticoagulation therapy. The decision whether to put a patient on anticoagulation medication is a serious one, particularly in children. Our results have demonstrated that the proposed RT methods produce smooth solutions with relatively modest computational effort.
Thrombus formation is a complex process, and recent advances in modeling the chemistry of the coagulation cascade are highly promising.2 However, there remains a need for surrogates of thrombotic risk that can be obtained directly from the flow field. Because RT1 measures the time that a fluid particle spends in a given region, it may be a better surrogate for local platelet aggregation time than RT2, which lacks those local information.
CONCLUSIONS
A non-discrete method was introduced for calculating residence time in a given region of interest. The proposed method lacks drawbacks associated with Lagrangian discrete methods, such as dependence of the results to the temporal and spatial seeding points and mesh dependency. RT can be calculated based on the time a parcel of fluid spends in a region of interest (RT1) or the time fluid exiting the boundary has spent in the region of interest (RT2). Results show that RT2 is more sensitive to the region of interest selection and this definition can lead to misleadingly low values if a segment of the region of interest lies in a high velocity region. The results show that WSS and RT1 values are inversely correlated in different flow conditions. It was shown that in a steady flow RT2 provides a lower bound for 2RT1.
ACKNOWLEDGMENTS
Funding for this work was provided by a Leducq Foundation Network of Excellent grant, a Burroughs Wellcome Fund Career Award at the Scientific Interface, and NIH Grant No. RHL102596A. The authors wish to thank Ethan Kung, Christopher Long, and Yuri Bazilevs for their useful comments, Dibyendu Sengupta, Jane Burns, and Andrew Kahn for the Kawasaki disease simulations, and Bari Murtuza for his clinical insight.
References
- Rouleau L., Farcas M., Tardif J., Mongrain R., and Leask R., “Endothelial cell morphologic response to asymmetric stenosis hemodynamics: Effects of spatial wall shear stress gradients,” J. Biomech. Eng. 132(8), 081013 (2010). 10.1115/1.4001891 [DOI] [PubMed] [Google Scholar]
- Xu Z., Chen N., Kamocka M., Rosen E., and Alber M., “A multiscale model of thrombus development,” J. R. Soc., Interface 5(24), 705–722 (2008). 10.1098/rsif.2007.1202 [DOI] [PMC free article] [PubMed] [Google Scholar]
- Meng H., Wang Z., Hoi Y., Gao L., Metaxa E., Swartz D., and Kolega J., “Complex hemodynamics at the apex of an arterial bifurcation induces vascular remodeling resembling cerebral aneurysm initiation,” Stroke 38(6), 1924–1931 (2007). 10.1161/STROKEAHA.106.481234 [DOI] [PMC free article] [PubMed] [Google Scholar]
- Turitto V. and Hall C., “Mechanical factors affecting hemostasis and thrombosis,” Thromb. Res. 92(6, Supplement 2), S25–S31 (1998). 10.1016/S0049-3848(98)00157-1 [DOI] [PubMed] [Google Scholar]
- Holme P., Orvim U., Hamers M., Solum N., Brosstad F., Barstad R., and Sakariassen K., “Shear-induced platelet activation and platelet microparticle formation at blood flow conditions as in arteries with a severe stenosis,” Arterioscler., Thromb., Vasc. Biol. 17(4), 646–653 (1997). 10.1161/01.ATV.17.4.646 [DOI] [PubMed] [Google Scholar]
- Yin W., Shanmugavelayudam S., and Rubenstein D., “The effect of physiologically relevant dynamic shear stress on platelet and endothelial cell activation,” Thromb. Res. 127(3), 235–241 (2011). 10.1016/j.thromres.2010.11.021 [DOI] [PubMed] [Google Scholar]
- Bluestein D., Niu L., Schoephoerster R., and Dewanjee M., “Fluid mechanics of arterial stenosis: Relationship to the development of mural thrombus,” Ann. Biomed. Eng. 25, 344–356 (1997). 10.1007/BF02648048 [DOI] [PubMed] [Google Scholar]
- Reininger A., Reininger C., Heinzmann U., and Wurzinger L., “Residence time in niches of stagnant flow determines fibrin clot formation in an arterial branching model–detailed flow analysis and experimental results,” Thromb. Haemostasis 74, 916–922 (1995). [PubMed] [Google Scholar]
- Yang W., Jeffrey A., and Marsden A., “Constrained optimization of an idealized Y-shaped baffle for the Fontan surgery at rest and exercise,” Comput. Methods Appl. Mech. Eng. 199(33–36), 2135–2149 (2010). 10.1016/j.cma.2010.03.012 [DOI] [Google Scholar]
- Marsden A., Feinstein J., and Taylor C., “A computational framework for derivative-free optimization of cardiovascular geometries,” Comput. Methods Appl. Mech. Eng. 197(21–24), 1890–1905 (2008). 10.1016/j.cma.2007.12.009 [DOI] [Google Scholar]
- Taylor C. and Figueroa C., “Patient-specific modeling of cardiovascular mechanics,” Annu. Rev. Biomed. Eng. 11, 109–134 (2009). 10.1146/annurev.bioeng.10.061807.160521 [DOI] [PMC free article] [PubMed] [Google Scholar]
- Sankaran S., Esmaily-Moghadam M., Kahn A., Tseng E., Guccione J., and Marsden A., “Patient-specific multiscale modeling of blood flow for coronary artery bypass graft surgery,” Ann. Biomed. Eng. 40, 2228–2242 (2012). 10.1007/s10439-012-0579-3 [DOI] [PMC free article] [PubMed] [Google Scholar]
- Kunov M., Steinman D., and Ethier C., “Particle volumetric residence time calculations in arterial geometries,” J. Biomech. Eng. 118, 158–164 (1996). 10.1115/1.2795954 [DOI] [PubMed] [Google Scholar]
- Suh G., Les A., Tenforde A., Shadden S., Spilker R., Yeung J., Cheng C., Herfkens R., Dalman R., and Taylor C., “Quantification of particle residence time in abdominal aortic aneurysms using magnetic resonance imaging and computational fluid dynamics,” Ann. Biomed. Eng. 39, 864–883 (2011). 10.1007/s10439-010-0202-4 [DOI] [PMC free article] [PubMed] [Google Scholar]
- Sengupta D., Kahn A., Burns J., Sankaran S., Shadden S., and Marsden A., “Image-based modeling of hemodynamics in coronary artery aneurysms caused by kawasaki disease,” Biomech. Model. Mechanobiol. 11, 915–932 (2012). 10.1007/s10237-011-0361-8 [DOI] [PMC free article] [PubMed] [Google Scholar]
- Lonyai A., Dubin A., Feinstein J., Taylor C., and Shadden S., “New insights into pacemaker lead-induced venous occlusion: Simulation-based investigation of alterations in venous biomechanics,” Cardiovasc. Eng. 10, 84–90 (2010). 10.1007/s10558-010-9096-x [DOI] [PubMed] [Google Scholar]
- Gundert T., Shadden S., Williams A., Koo B.-K., Feinstein J., and LaDisa J., “A rapid and computationally inexpensive method to virtually implant current and next-generation stents into subject-specific computational fluid dynamics models,” Ann. Biomed. Eng. 39, 1423–1437 (2011). 10.1007/s10439-010-0238-5 [DOI] [PubMed] [Google Scholar]
- Jozsa J. and Kramer T., “Modelling residence time as advection-diffusion with zero-order reaction kinetics,” in Proceedings of the Hydrodynamics 2000 Conference, International Association of Hydraulic Engineering and Research, 2000.
- Rayz V., Boussel L., Ge L., Leach J., Martin A., Lawton M., McCulloch C., and Saloner D., “Flow residence time and regions of intraluminal thrombus deposition in intracranial aneurysms,” Ann. Biomed. Eng. 38(10), 3058–3069 (2010). 10.1007/s10439-010-0065-8 [DOI] [PMC free article] [PubMed] [Google Scholar]
- Narracott A., Smith S., Lawford P., Liu H., Himeno R., Wilkinson I., Griffiths P., and Hose R., “Development and validation of models for the investigation of blood clotting in idealized stenoses and cerebral aneurysms,” Int. J. Artif. Organs 8, 56–62 (2005). 10.1007/s10047-004-0274-8 [DOI] [PubMed] [Google Scholar]
- Hughes T., Mallet M., and Akira M., “A new finite element formulation for computational fluid dynamics: II. beyond SUPG,” Comput. Methods Appl. Mech. Eng. 54(3), 341–355 (1986). 10.1016/0045-7825(86)90110-6 [DOI] [Google Scholar]
- Hughes T., The Finite Element Method: Linear Static and Dynamic Finite Element Analysis (Dover Publications, 2000). [Google Scholar]
- Bazilevs Y., Calo V., Tezduyar T., and Hughes T., “Yzβ discontinuity capturing for advection-dominated processes with application to arterial drug delivery,” Int. J. Numer. Methods Fluids 54(6–8), 593–608 (2007). 10.1002/fld.1484 [DOI] [Google Scholar]
- Steen R., Evers E., Hattum B. V., Cofino W., and Brinkman U., “Net fluxes of pesticides from the scheldt estuary into the north sea: a model approach,” Environ. Pollut. 116(1), 75–84 (2002). 10.1016/S0269-7491(01)00123-3 [DOI] [PubMed] [Google Scholar]
- Delhez E., Heemink A., and Deleersnijder E., “Residence time in a semi-enclosed domain from the solution of an adjoint problem,” Estuarine Coastal Shelf Sci. 61(4), 691–702 (2004). 10.1016/j.ecss.2004.07.013 [DOI] [Google Scholar]
- Bazilevs Y., Calo V., Hughes T., and Zhang Y., “Isogeometric fluid-structure interaction: theory, algorithms, and computations,” Comput. Mech. 43, 3–37 (2008). 10.1007/s00466-008-0315-x [DOI] [Google Scholar]
- Canfield M., Honein M., Yuskiv N., Xing J., Mai C., Collins J., Devine O., Petrini J., Ramadhani T., Hobbs C., and Kirby R., “National estimates and race/ethnic-specific variation of selected birth defects in the united states, 1999–2001,” Birth Defects ResA 76(11), 747–756 (2006). 10.1002/bdra.20294 [DOI] [PubMed] [Google Scholar]
- Tikkanen J. and Heinonen O., “Risk factors for hypoplastic left heart syndrome,” Teratology 50(2), 112–117 (1994). 10.1002/tera.1420500205 [DOI] [PubMed] [Google Scholar]
- Schmidt J., Delp S., Sherman M., Taylor C., Pande V., and Altman R., “The Simbios National Center: Systems biology in motion,” Proc. IEEE 96(8), 1266–1280 (2008). 10.1109/JPROC.2008.925454 [DOI] [PMC free article] [PubMed] [Google Scholar]
- Esmaily-Moghadam M., Migliavacca F., Vignon-Clementel I., Hsia T., and Marsden A., “Optimization of shunt placement for the Norwood surgery using multi-domain modeling,” J. Biomech. Eng. 134(5), 051002 (2012). 10.1115/1.4006814 [DOI] [PubMed] [Google Scholar]
- Migliavacca F., Pennati G., Dubini G., Fumero R., Pietrabissa R., Urcelay G., Bove E., Hsia T., and de Leval M., “Modeling of the Norwood circulation: Effects of shunt size, vascular resistances, and heart rate,” Am. J. Physiol. Heart Circ. Physiol. 280, H2076–H2086 (2001). [DOI] [PubMed] [Google Scholar]
- Lagana K., Balossino R., Migliavacca F., Pennati G., Bove E., de Leval M., and Dubini G., “Multiscale modeling of the cardiovascular system: application to the study of pulmonary and coronary perfusions in the univentricular circulation,” J. Biomech. 38(5), 1129–1141 (2005). 10.1016/j.jbiomech.2004.05.027 [DOI] [PubMed] [Google Scholar]
- Esmaily-Moghadam M., Vignon-Clementel I., Figliola R., and Marsden A., “A modular numerical method for implicit 0D/3D coupling in cardiovascular finite element simulations,” J. Comput. Phys. 244, 63–79 (2013). 10.1016/j.jcp.2012.07.035 [DOI] [Google Scholar]
- Whiting C. and Jansen K., “A stabilized finite element method for the incompressible Navier-Stokes equations using a hierarchical basis,” Int. J. Numer. Methods Fluids 35(1), 93–116 (2001). [DOI] [Google Scholar]
- Franca L. and Frey S., “Stabilized finite element methods: II. the incompressible Navier-Stokes equations,” Comput. Methods Appl. Mech. Eng. 99(2–3), 209–233 (1992). 10.1016/0045-7825(92)90041-H [DOI] [Google Scholar]
- Brooks A. and Hughes T., “Streamline upwind/Petrov-Galerkin formulations for convection dominated flows with particular emphasis on the incompressible Navier-Stokes equations,” Comput. Methods Appl. Mech. Eng. 32(1–3), 199–259 (1982). 10.1016/0045-7825(82)90071-8 [DOI] [Google Scholar]
- Bazilevs Y., Calo V., Cottrell J., Hughes T., Reali A., and Scovazzi G., “Variational multiscale residual-based turbulence modeling for large eddy simulation of incompressible flows,” Comput. Methods Appl. Mech. Eng. 197(1–4), 173–201 (2007). 10.1016/j.cma.2007.07.016 [DOI] [Google Scholar]
- Esmaily-Moghadam M., Bazilevs Y., Hsia T., Vignon-Clementel I., and Marsden A., “A comparison of outlet boundary treatments for prevention of backflow divergence with relevance to blood flow simulations,” Comput. Mech. 48(3), 277–291 (2011). 10.1007/s00466-011-0599-0 [DOI] [Google Scholar]
- Bazilevs Y., Gohean J., Hughes T., Moser R., and Zhang Y., “Patient-specific isogeometric fluid-structure interaction analysis of thoracic aortic blood flow due to implantation of the Jarvik 2000 left ventricular assist device,” Comput. Methods Appl. Mech. Eng. 198(45–46), 3534–3550 (2009). 10.1016/j.cma.2009.04.015 [DOI] [Google Scholar]
- Esmaily-Moghadam M., Bazilevs Y., and Marsden A. L., “A new preconditioning technique for implicitly coupled multidomain simulations with applications to hemodynamics,” Comput. Mech. (published online). 10.1007/s00466-013-0868-1 [DOI]
- Newburger J., Takahashi M., Gerber M., Gewitz M., Tani L., Burns J., Shulman S., Bolger A., Ferrieri P., Baltimore R. et al. , “Diagnosis, treatment, and long-term management of kawasaki disease,” Circulation 110(17), 2747–2771 (2004). 10.1161/01.CIR.0000145143.19711.78 [DOI] [PubMed] [Google Scholar]
- Gordon J., Kahn A., and Burns J., “When children with kawasaki disease grow up: Myocardial and vascular complications in adulthood,” J. Am. Coll. Cardiol. 54(21), 1911–1920 (2009). 10.1016/j.jacc.2009.04.102 [DOI] [PMC free article] [PubMed] [Google Scholar]
- Sengupta D., Kung E., Kahn A., Burns J., and Marsden A., “CFD-based thrombotic risk assessment in Kawasaki disease patients with coronary artery aneurysms,” in Proceedings of 65th Annual Meeting of the APS Division of Fluid Dynamics (APS, 2012), Vol. 57.
- Kim H., Vignon-Clementel I., Coogan J., Figueroa C., Jansen K., and Taylor C., “Patient-specific modeling of blood flow and pressure in human coronary arteries,” Ann. Biomed. Eng. 38, 3195–3209 (2010). 10.1007/s10439-010-0083-6 [DOI] [PubMed] [Google Scholar]
- Shadden S. C., Lekien F., and Marsden J. E., “Definition and properties of Lagrangian coherent structures from finite-time Lyapunov exponents in two-dimensional aperiodic flows,” Physica D 212(3), 271–304 (2005). 10.1016/j.physd.2005.10.007 [DOI] [Google Scholar]
- Lekien F., Shadden S. C., and Marsden J. E., “Lagrangian coherent structures in n-dimensional systems,” J. Math. Phys. 48, 065404 (2007). 10.1063/1.2740025 [DOI] [Google Scholar]
- Himburg H. A., Grzybowski D. M., Hazel A. L., LaMack J. A., Li X.-M., and Friedman M. H., “Spatial comparison between wall shear stress measures and porcine arterial endothelial permeability,” Am. J. Physiol. Heart Circ. Physiol. 286(5), H1916–H1922 (2004). 10.1152/ajpheart.00897.2003 [DOI] [PubMed] [Google Scholar]
- Kersh D. and Liberzon A., “Relations of pulsatility index and particle residence time to the wall-shear-stress properties in pulsating flows with reverse flow phase,” eprint arXiv:1303.3727.
- Esmaily-Moghadam M., Bazilevs Y., and Marsden A., “Low entropy data mapping for sparse iterative linear solvers,” in Proceedings of the Conference on Extreme Science and Engineering Discovery Environment: Gateway to Discovery, p. 2 (ACM, 2013).


