Abstract
A flow diverter (FD) is a flexible, densely braided stent-mesh device placed endoluminally across an intracranial aneurysm to induce its thrombotic occlusion. FD treatment planning using computational virtual stenting and flow simulation requires accurate representation of the expanded FD geometry. We have recently developed a High Fidelity Virtual Stenting (HiFiVS) technique based on finite element analysis to simulate detailed FD deployment processes in patient-specific aneurysms (Ma et al. J. Biomech. 45: 2256–2263, 2012). This study tests if HiFiVS simulation can recapitulate real-life FD implantation. We deployed two identical FDs (Pipeline Embolization Device) into phantoms of a wide-necked segmental aneurysm using a clinical push-pull technique with different delivery wire advancements. We then simulated these deployment processes using HiFiVS and compared results against experimental recording. Stepwise comparison shows that the simulations precisely reproduced the FD deployment processes recorded in vitro. The local metal coverage rate and pore density quantifications demonstrated that simulations reproduced detailed FD mesh geometry. These results provide validation of the HiFiVS technique, highlighting its unique capability of accurately representing stent intervention in silico.
Keywords: Flow diverter, Pipeline Embolization Device, Stent deployment, Intracranial aneurysm, Finite element analysis, Braided stent
3. Introduction
The emerging neurovascular flow diverter (FD) treatment paradigm has been successfully used to treat challenging intracranial aneurysms such as wide-necked, large, or segmental aneurysms.19,22 The FD, a densely-braided self-expandable stent-mesh device, is deployed across the aneurismal region to reduce the aneurysm inflow, induce intra-aneurysm thrombosis, and reconstruct the parent vessel.11,18 Its dense metallic mesh serves as a scaffold for re-endothelialization of the lumen, thereby reconstructing a new flow conduit across the diseased vascular segment.
As this novel, minimally invasive technique rapidly expands its application, especially after recent FDA approval of Pipeline Embolization Device (Covidien, Irvine, CA, USA),6,12 there is an increasing number of complications, including post-treatment ischemic stroke, parent vessel bleeding, and delayed rupture.25,26 The marked variability in FD treatment outcomes underscores the need for better understanding of the flow alteration mechanisms caused by FD, thrombosis process induced thereof, and the interaction of the flow field, thrombus, and the aneurysm wall biology. To this end, a combination of high-fidelity numerical simulation, in vitro/vivo experiments, and clinical observations is needed to comprehensively address these clinical problems.
An FD mesh is highly flexible. As such, its positioning and configuration are highly dependent on how the actual device is deployed in the vessel. Recent experimental studies have shown that variable pore size/density along a single FD can be easily created with different axial compressions or via deployment into highly curved vasculatures.21 Such variations could strongly influence blood clotting process and treatment outcome. Our clinical team has developed a “push-pull” FD deployment technique, which allows us to optimize the aneurysm orifice coverage for better flow-diversion, and maximize the FD-vessel apposition for vessel patency and FD resistance to migration. This is done by synergistically pushing and pulling the microcatheter and the delivery wire during FD deployment. However, due to limited resolution of clinical angiography, the result of the push-pull technique is difficult to be directly evaluated clinically.
We have recently published a finite-element-analysis (FEA) based virtual stenting technique, here referred to as the High Fidelity Virtual Stenting (HiFiVS) method. It simulates FD and braided stent implantation procedures to provide accurate deployed FD geometry in patient-specific aneurysms. Unlike previous virtual stenting methods using simplified surface/stent mesh expansion,1–3,9 our method simulates the entire mechanical manipulation of the FD delivery system to produce accurate final geometry of the FD. We validated this method in two simplified scenarios: (1) mechanical testing of a Wallstent (another braided construct), where simulation results quantitatively matched available testing data in the literature; (2) unsheathing of a Pipeline Embolization Device in free space, where our simulation results qualitatively matched experimental recording. However, it remains unclear if the HiFiVS technique can recapitulate real FD deployment in patient-specific aneurysms, or if it can replicate complex processes such as the push-pull technique clinically during FD implantation.
To address these questions, we deployed two identical Pipeline Embolization Devices in the current study using the push-pull technique in two identical transparent phantoms of a patient-specific aneurysm. We implemented the deployments with slightly varied delivery wire advancement values, generating two different mesh distributions of the deployed FD. The matching in silico simulations were performed for both experimental deployments. We then made side-by-side comparisons between the experimental deployments and the corresponding virtual deployments. The purpose of this in vitro-in silico study was twofold: (1) to visualize the deployment process and the final FD configurations to verify the variations in FD mesh distribution by using the push-pull technique, and (2) to validate the modeling technique’s capability in accurately simulating the push-pull technique as well as obtaining the final FD configurations.
4. Materials and Methods
4.1. In Vitro Phantom and Flow Loop
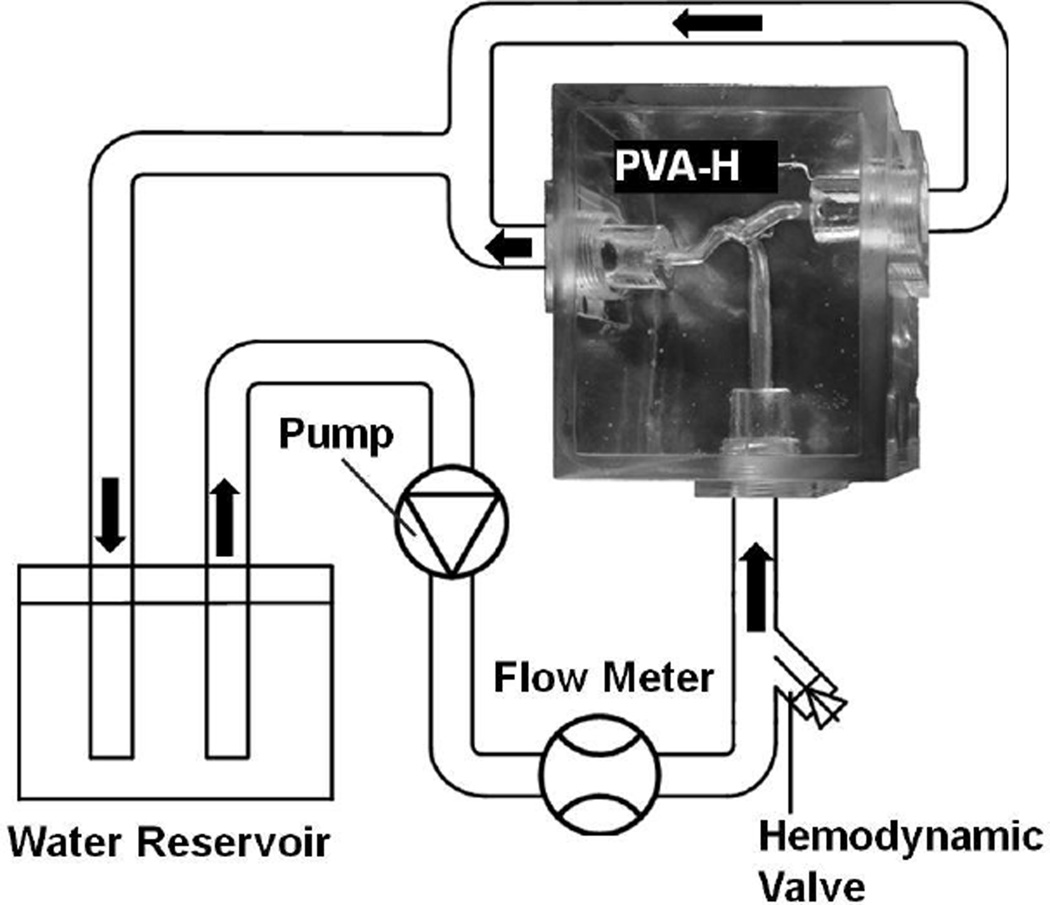
The lost-wax casting method was used to fabricate polyvinyl alcohol hydrogel (PVA-H) patient-specific aneurysm phantoms.23 An acrylic case was made to contain the phantom and join it into the flow loop (Figure 1). The PVA-H phantom was prepared by low-temperature crystallization method using polyvinyl alcohol solution. The solution was prepared by dissolving 15 wt% of polyvinyl alcohol powder in DMSO/aqueous solution (80 wt%) at 100°C. After overnight cooling (−30°C), the polymerized phantom was brought to room temperature and the mold of aneurysm was removed. Compared to traditional silicone models, the PVA-H phantoms offer better transparency as well as mechanical properties and surface friction conditions that are comparable to real vascular wall.14,23 To mimic the friction condition in vivo and to gain better visibility of the vascular lumen, we supplied the phantom with steady-state flow with a flow loop (Reynolds number = 160 at the parent vessel inlet).8
Figure 1.
Schema of flow loop setup for the in vitro experiment. The hemodynamic valve is used to prevent leakage after inserting the guidewire, microcatheter, and the FD delivery system.
4.2. Patient-Specific Aneurysm Geometry
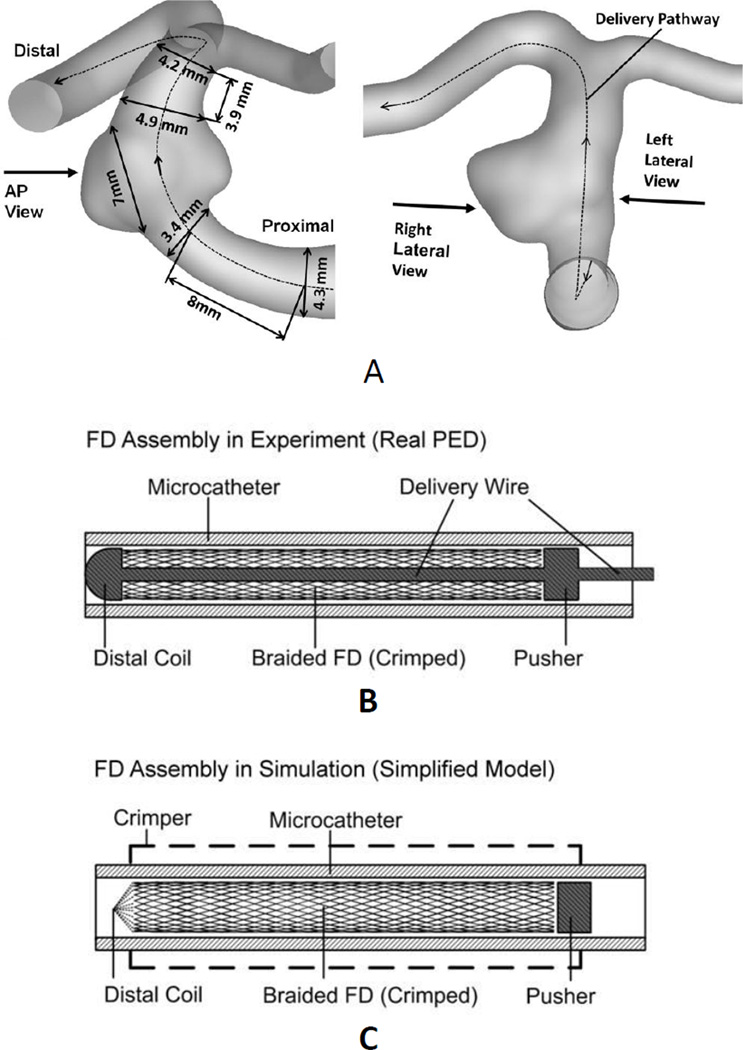
A patient-specific, wide-necked basilar artery aneurysm model (Figure 2A) used in our previous study28 was employed in the current experimental and numerical studies of FD implantation. Three view were defined for later FD mesh analysis (Figure 2A): anterior-posterior (AP), right lateral, and left lateral. Two identical phantoms were manufactured for this aneurysm geometry. The AP view was used to video-record the deployment process using a surgical microscope.
Figure 2.
Aneurysm model and FD assembly used in both experiment and simulation. (A) Aneurysm geometry with measurements. Left: definition of anterior-posterior (AP) view. Right: definitions of right lateral view and left lateral view. Dashed line: FD delivery pathway in simulation. (B) Schema of the actual Pipeline Embolization Device implantation system. A distal coil provides a removable constraint to the FD; a pusher drives FD forward during the FD expansion stage; both are soldered onto the delivery wire. (C) Simplified implantation system used in simulation. A crimper model compressed the stress-free FD to fit into the microcatheter. The distal coil was simplified as a removable reference point. The delivery wire was neglected. The effect of pushing the delivery wire was mimicked by the advancement of either the distal coil (before releasing the distal constraint) or the pusher (after releasing the distal constraint).
4.3. Flow Diverter
The Pipeline Embolization Device is a braided 48-strand tube with metal coverage rate of 30% – 35% 27 and single pore area about 0.02–0.05 mm2. It is packed inside a microcatheter, with a delivery wire passing through the braided construct. The wire has a distal coil and a pusher soldered on, designed to constrain the positioning of the FD at its distal and proximal ends, respectively (Figure 2B). In the current study, two identical Pipeline Embolization Devices (labeled sizes: 5×20 mm) were deployed into two identical aneurysm phantoms with the push-pull technique, using a 0.356 mm (0.014 inch) diameter micro-guidewire (Transend EX, Boston Scientific, MA, USA) and a 0.686 mm (0.027 inch) internal diameter microcatheter (Marksman, Covidien, MN, USA).
4.4. Push-Pull Technique Implemented in Phantom Experiment
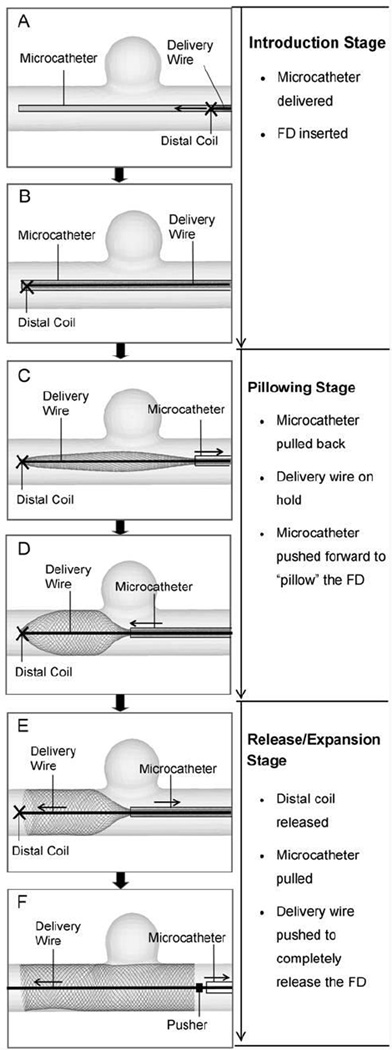
Three stages were identified over the course of the push-pull technique with different prescribed maneuvers of the key components: Introduction (Figure 3A, B), Pillowing (Figure 3C, D), and Release/Expansion (Figure 3E, F).
Figure 3.
Procedure of FD deployment using the push-pull technique, illustrated in an idealized sidewall aneurysm. (A) Advancing FD through microcatheter to the targeting site (from right to left); (B) FD is completely placed into microcatheter and across aneurysm orifice; (C) Pulling back the microcatheter to partially release the FD; (D) Pushing forward the microcatheter while holding the delivery wire (attached to the distal coil) to “pillow” the FD to gain apposition to the vessel wall; (E) Releasing the distal constraint to expand the FD; (F) Pulling back the microcatheter and pushing forward the delivery wire/pusher to completely release the FD.
During the Introduction, the microcatheter was advanced to the target site, followed by the advancement of the FD and the delivery wire. In the Pillowing stage, the microcatheter was pulled back about 10~15 mm while the delivery wire was held in place to expose the distal portion of the FD (Figure 3C). The microcatheter was then pushed forward by 5~8 mm, forcing the exposed portion of the FD to expand radially (“pillowing”) to oppose to the vessel wall for secured contact (Figure 3D). Such FD-vessel apposition was generated to counteract the foreshortening of the FD once its distal end was released.
For the Release/Expansion, the FD distal end was released by rotating the delivery wire (Figure 3E). The FD then expanded radially. Then the microcatheter was pulled back while the delivery wire/pusher was simultaneously pushed forward to completely deploy and expand the proximal FD (Figure 3F). The wire/pusher advancement supported the FD mesh from being pulled back by the retracting microcatheter and actively controlled the mesh density in the deployed portion of the FD. Denser mesh can be generated by decreased pull-back of the microcatheter and increased advancement of the wire. Looser mesh can be generated by increased pull-back of the microcatheter and decreased advancement of the wire.
Based on the push-pull deployment technique, we experimented with two different advancement values of the delivery wire, while keeping movements of other components generally unchanged. The purpose was to examine the feasibility of generating the relatively dense and loose mesh by pushing the delivery wire differently in patient-specific aneurysm geometry. The FEA simulation tool was then used to virtually reproduce these two deployment scenarios.
4.5. In Silico Modeling of FD Deployment
To recapitulate the in vitro experiments numerically, we made the following simplifications while balancing the computational cost and the mechanical authenticity.
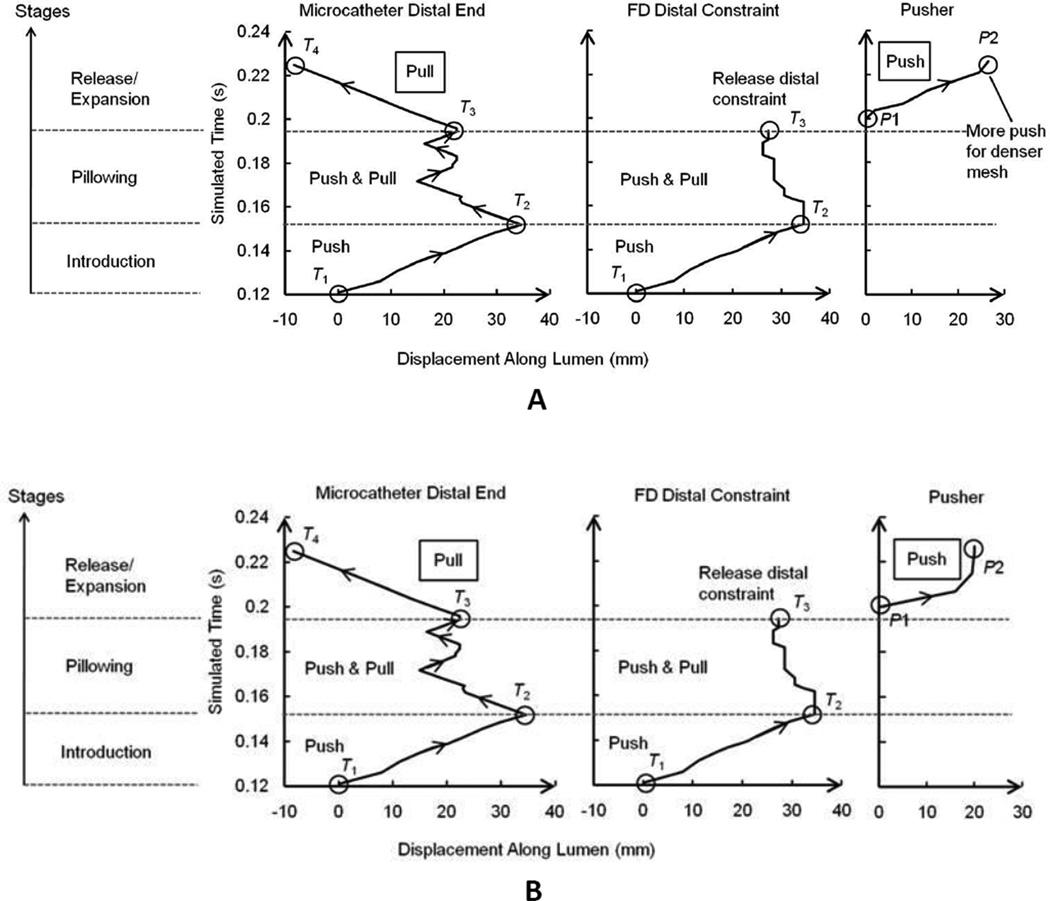
Several key procedural time points were chosen to delineate different stages and to serve as check points for obtaining positioning information from the experiment and later comparing the experiment with the simulation. They were: the starting time point of the Introduction stage (T1), the time point at the end of the Introduction stage (T2), the time point at the end of the Pillowing stage (T3), and the time point at the end of the Release/Expansion stage (T4).
The Pillowing and the FD Release/Expansion stages were strictly matched stepwise, because of their importance in determining the final FD positioning and configuration. The Introduction stage was identical for different deployment scenarios, therefore only the ending point was checked.
The virtual FD deployment was implemented in a shorter time than the actual delivery process. Instead of directly matching the operation time, we ensured that the quasi-static condition (which means slow motion with negligible kinetic effect) was satisfied for both the experiment and simulation, thus allowing for comparisons at procedural check points. We kept in vitro experiments in slow pace (>5 minutes total) and specified simulation time long enough to ensure the system’s kinetic energy was negligible (over one magnitude smaller) compared to the total strain energy.13
Delivery wire was not explicitly modeled in the simulation. Instead, the functionality of delivery wire was modeled by the distal coil model, the pusher model, and the virtual delivery pathway (Figure 2C). The distal coil was modeled as a removable reference point, with its motion dictating the motion of the FD distal end. The pusher was modeled as a rigid-wall cylinder at the proximal end of the FD. Pushing the delivery wire was emulated by either advancing the distal coil (before releasing the distal constraint) along the delivery pathway or forwarding the pusher (after releasing the distal constraint) along the proximal parent vessel. The delivery pathway (Figure 2A) was numerically determined by the centroids and norms of several sequential cross-sections of the lumen. The delivery of the FD-microcatheter assembly was realized by moving the distal ends of the microcatheter and the FD through the delivery pathway.
The vascular wall was treated as rigid in the simulation. This is because the manufactured aneurysm phantom had a relatively thick wall (>5 mm), justifying the rigid wall assumption.
To implement the virtual deployment process, the nonlinear FEA solver Abaqus/Explicit (SIMULIA, RI, USA) was used, following the modeling strategy of HiFiVS presented previously.20 Briefly, the FD model was generated based on the labeled sizes (5×20 mm) with 48 strands braided together (strand thickness ≈ 0.03 mm). The labeled FD sizes denote a slightly compressed state intended for the deployed state in the vessel (not the stress-free state). We determined the braiding angle at labeled state by assuming 30% metal coverage rate (a general design objective for FD) based on standard geometrical equations.5,10,15 We then calculated the FD geometry at stress-free state (known to be 0.25 mm wider than the labeled diameter) (5.25×12 mm, braiding angle = 77°). The stress-free FD geometry was discretized by over 24,000 finite beam elements with a nominal mesh size determined from a previous mesh independence study.20 The elastic material properties of Cobalt-Chromium alloy for Wallstent (Elasticity E=206 GPa, Poisson ratio=0.26, and density=8 g cm−3) were used because of the similarities in structure and material composition between these two devices.5 The plastic behavior (0.2% yield stress=2.8 GPa, isotropic hardening slope = 8.8 GPa) was estimated based on existing experimental data of the similar material.24
In simulations, each FD model was virtually crimped and fit into a microcatheter model (internal diameter = 0.686 mm (0.27 inch), wall thickness = 0.8 mm). The microcatheter was modeled by rebar-reinforced shell elements with polymer-like elastic material as substrate (elasticity E=1 GPa, Poisson ratio=0.49, density=1g cm−3) and stainless steel rebar as reinforcement to help resist buckling and kinking.
The FD-microcatheter assembly was delivered along the delivery pathway to the target region. Once the FD-microcatheter assembly was in place across the aneurysm orifice, the simulation followed the maneuvers observed from in vitro experiment (Figure 3C–F), resulting in FD deployment.
In order to better utilize the “general contact” algorithm in Abaqus to obtain robust solutions for the complex interactions involved in FD deployment, a global friction coefficient (FC) value 0.15 was chosen for the current study. Our previous parametric study20 showed that the change of strand-strand FC among higher FC values (> 0.4) significantly affected the FD deployment result, while the change of strand-strand FC among lower values (< 0.2) and the changes of all other major FCs (strand-microcatheter and strand-vessel) within their normal ranges (0.02~0.2) had negligible effects. Therefore the simulation result obtained with current global FC value should be insensitive to the regular variations of those considered FCs.
In vitro recording was analyzed to determine the simulation boundary conditions, such as the positions of distal coil at procedural time points. Since only AP view recording was available, the pusher could not be seen from images and its position had to be estimated. The position of the pusher at T3 (registered as P1) was estimated as the wire length (L) between the distal coil and the pusher subtracted by the wire length shown in the recording (only the distal part of L was shown in AP view). The position of the pusher at T4 (registered as P2) was approximated as the location of the proximal end of the fully deployed FD. The advancement of the delivery wire/pusher during FD expansion was (P2 – P1) along the luminal axial direction.
The total computational time for simulating each FD deployment scenario was around 120 hours on a Dell Precision 490 workstation with two Intel Xeon 5150 processers (2.66 GHz) and 16 GB memory. Thread-based parallel processing was implemented at domain-level by the FEA solver. We expect the simulation time to decrease significantly with the increase of computing power in the future.
4.6. Qualitative Comparison of FD Positioning
The AP view of the aneurysm model was used for comparison of dynamic deployment. Stepwise pillowing and expansion processes at several key procedural time points were qualitatively compared between recorded video frames of in vitro deployment and the FEA-simulated processes.
Only the camera-facing side of FD mesh was in focus and visible in the in vitro experiment. To make the simulation results comparable to these experimental images, a virtual plane was inserted in the FD 3D model so the same side was visible and analyzed.
4.7. Quantitative Comparison of Local Mesh Density
We quantified and compared the mesh configuration of deployed FD using metal coverage rate and pore density. Metal coverage rate is defined as the ratio of total outer surface area of FD strands over the total tubular surface area occupied by FD. Pore density is defined as the number of pores per unit area of the tubular surface covered by FD.18
For mesh profile comparison, 2D images of FD in the phantom from three views defined in Figure 2A were taken using a dissecting microscope. The corresponding images of modeling were obtained from screen prints. Image J (http://rsbweb.nih.gov/ij/, NIH, USA) was used for image analysis.
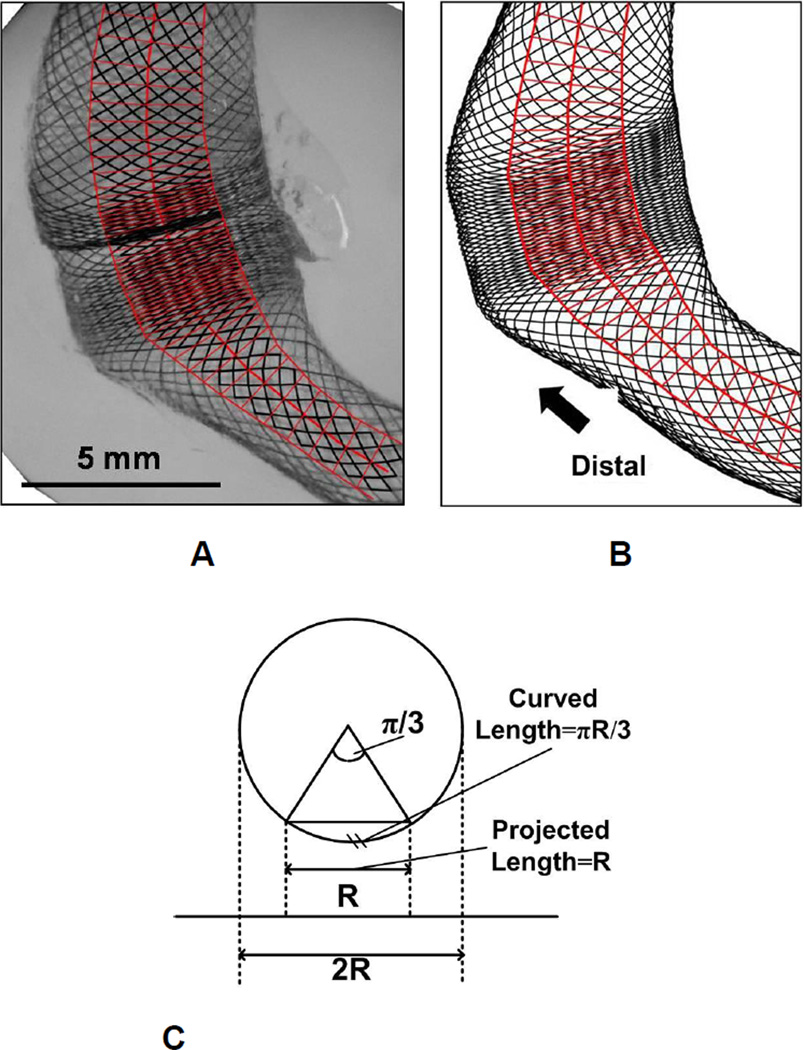
To minimize the error in area estimation of a 3D curved surface (the tubular FD lumen) using a projected 2D image, we defined our region of interest (ROI) as a band along the centerline of the FD image, with the bandwidth equal to the half of the local FD luminal width (Figure 4A, B). Within the ROI, the relative difference between the 2D and 3D area is less than 5% (Figure 4C).
Figure 4.
The sampling boxes (red) laid within central area of the FD mesh for quantification of mesh configuration. (A) Sketch of sampling areas on experimental result (left lateral view of the dense packing scenario). The boxes are drawn along the lumen with width equal to half of the lumen width (to avoid edge effect from 2D image projection) and box heights comparable to the axial diagonal length of a local cell (minimal dividable unit); (B) Sketch of sampling areas on the corresponding numerical result (with the same length scale as A); (C) Schema of the projection of 3D cylindrical surface on 2D image. If the central region with half of the cross section width (diameter) is chosen to represent the curved surface, the relative error in area estimation from 2D projection is (πR/3-R) / (πR/3) = 4.5%.
To obtain longitudinal variations of the FD mesh, the ROI was divided into a series of sampling boxes along the centerline (Figure 4A, B). The height of individual box was initially equal to the diagonal length of a local mesh cell measured along the longitudinal direction. Average metal coverage rate and pore density were then calculated for each box and plotted against the centerline distance. To eliminate noise (oscillations) from the data, an optimal box height of 0.5 mm was then used to analyze parameter distribution. The anatomical starting point of the plot was chosen at the proximal parent vessel about one local vessel width proximal to the orifice.
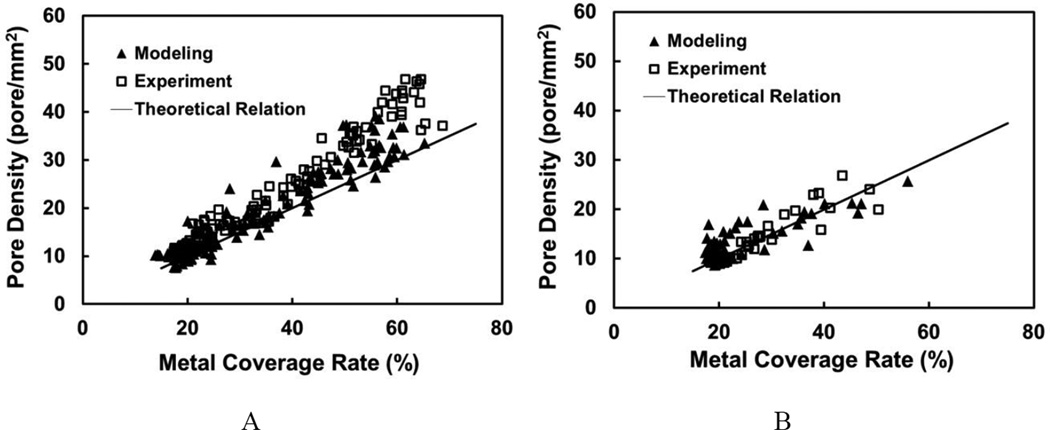
Theoretically, the local metal coverage rate of a braided FD maintains a constant linear relation to the pore density of the same region during FD deformations. Consider a single rhombus-shaped FD cell with edge length as l, strand thickness as t, and braiding angle as α. Then pore density is l2 sin 2α −1, and metal coverage rate is 2lt l2 sin 2 α −1, indicating a linear relation between the two with the slope of 2 lt −1. If we assume the total length of each helical strand and its thickness unchanged during FD deformation, then the slope is a constant (both l and t are constants). To examine this relationship in experiment and simulation, pore density value was plotted against metal coverage rate value for all sampling boxes from both experiment and simulation images.
5. Results
5.1. In vitro FD Deployment
Two Pipeline Embolization Devices (5×20 mm) were successfully deployed into phantoms using the push-pull technique. Different delivery wire advancements were applied during FD release stage with the intention of generating different mesh densities, while the movements of other components were essentially unchanged. From video recording, positions of key elements, such as the position of the distal coil and the position of the microcatheter distal end were obtained to generate boundary conditions for FEA simulations which were later performed to reproduce the two implantation scenarios in silico.
The overall displacement boundary conditions are plotted in Figure 5 based on measurements of the experimental recording. Deployment stages were delineated by procedural time points (T1~T4) marked with open circles. The forwarding of the delivery wire during the Expansion stage is reflected by the displacement of the pusher (diagrams on the right side, Figure 5). The estimated pusher advancement values (distance between P1 and P2) were 27 mm and 21 mm for dense and loose packing scenarios respectively, signifying a 6 mm difference in delivery wire advancement.
Figure 5.
FD deployment time versus component advancements along lumen in simulation. (A) Dense packing scenario, (B) loose packing scenario. The delivery started at the inlet of parent vessel (zero value for catheter distal end and FD distal constraint) at time 0.12 s, when the FD was completely crimped into the microcatheter. The zero position for pusher was at the proximal end of the FD after releasing the distal constraint. The pusher was not functioning until the FD distal constraint was released. Procedural time points were: T1, the point with zero displacement value of the Introduction stage; T2, the time point at the end of the Introduction stage when the microcatheter was first time pulled back; T3, the time point at the end of the Pillowing stage; T4, the time point at the end of Release/Expansion stage. Positions of the pusher were: P1, the luminal axial position of pusher at T3; P2, the luminal axial position of pusher at T4,
5.2. Qualitative Comparison between FD In Vitro Deployment and Simulated Deployment
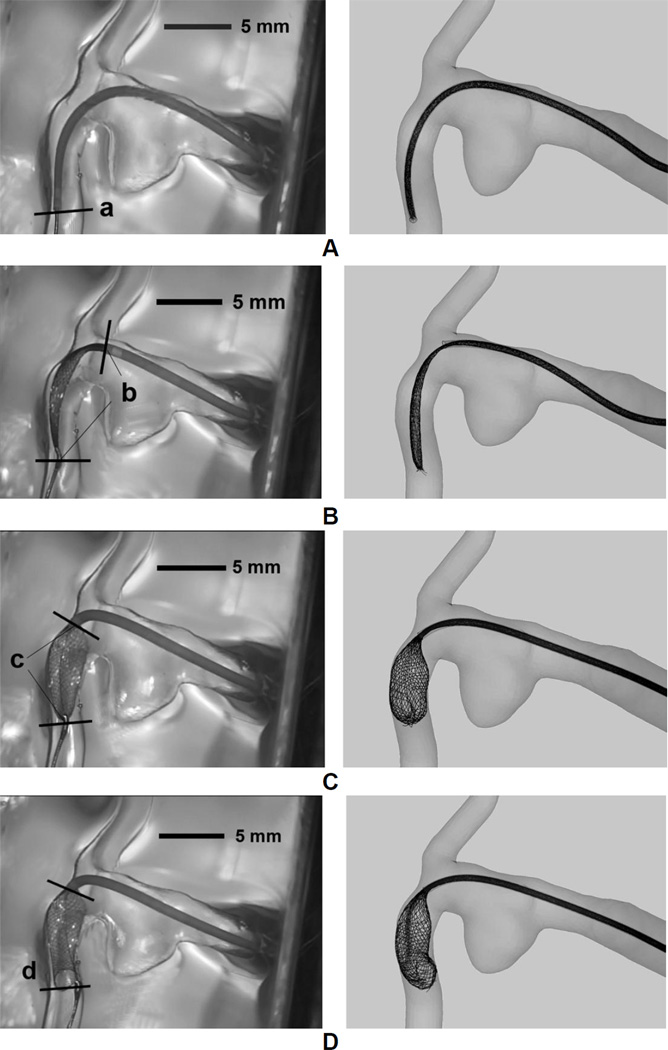
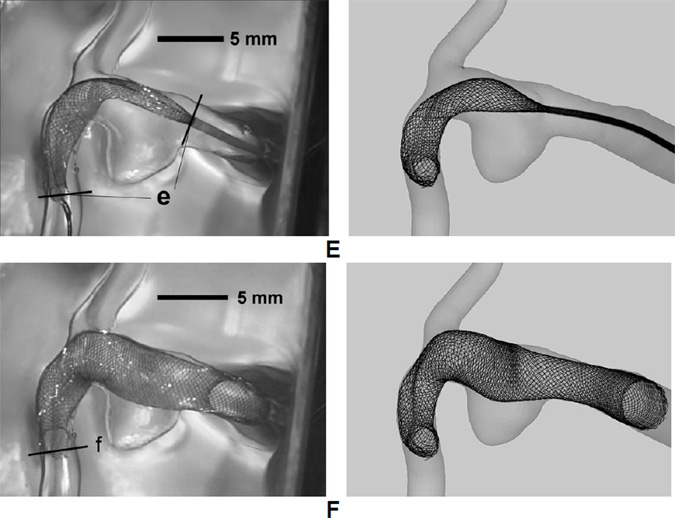
As an example, the stepwise FD deployment process (viewed from AP direction) for the loose packing scenario in both in vitro experiment and simulation are shown side by side in Figure 6. Excellent agreement in FD positioning was achieved at all key procedural time points including:
Figure 6.
Stepwise deployment results of in vitro experiment (Left column) compared with numerical simulation (Right column, with the same length scale as the left column) side by side. (A) FD and microcatheter were delivered to pass the aneurysm region; (B) Microcatheter was pulled back, with FD distal end being on hold by the distal coil. The FD can be seen to slightly expand; (C) Microcatheter was pushed forward with FD distal end still being secured. This operation effectively pillowed the FD to appose to the vessel wall; (D) The FD distal end was released after FD properly apposed to the wall; (E) Microcatheter was pulled back and the delivery wire was pushed forward synergistically to pack the FD mesh with proper metal coverage; (F) The FD completely came out of microcatheter and achieved its final positioning.
Position of FD-microcatheter assembly at the end of the Introduction stage (Figure 6A)
Position of the distal coil, the distal end of microcatheter, and the slightly pillowed FD after the first retraction of microcatheter during the Pillowing stage (Figure 6B)
Position of the distal coil, the distal end of microcatheter, and the pillowed FD before releasing the distal coil (Figure 6C)
Position of the distal end of microcatheter, and the distal end of FD at the end of the Pillowing stage (Figure 6D)
Position of the distal end of microcatheter and the distal end of FD at an intermediate time point during the Release/Expansion stage (Figure 6E)
Position of the distal end of FD at the end of the Release/Expansion stage (Figure 6F).
The simulation was able to capture important characteristics observed in the in vitro experiments. The intended location for the distal end of FD was successfully preserved after releasing the distal constraint (Figure 6A vs. Figure 6D). The pillowed distal portion of the FD successfully resisted foreshortening after the release of distal constraint.
5.3. Comparison of Metal Coverage Rate at Completion of Deployment
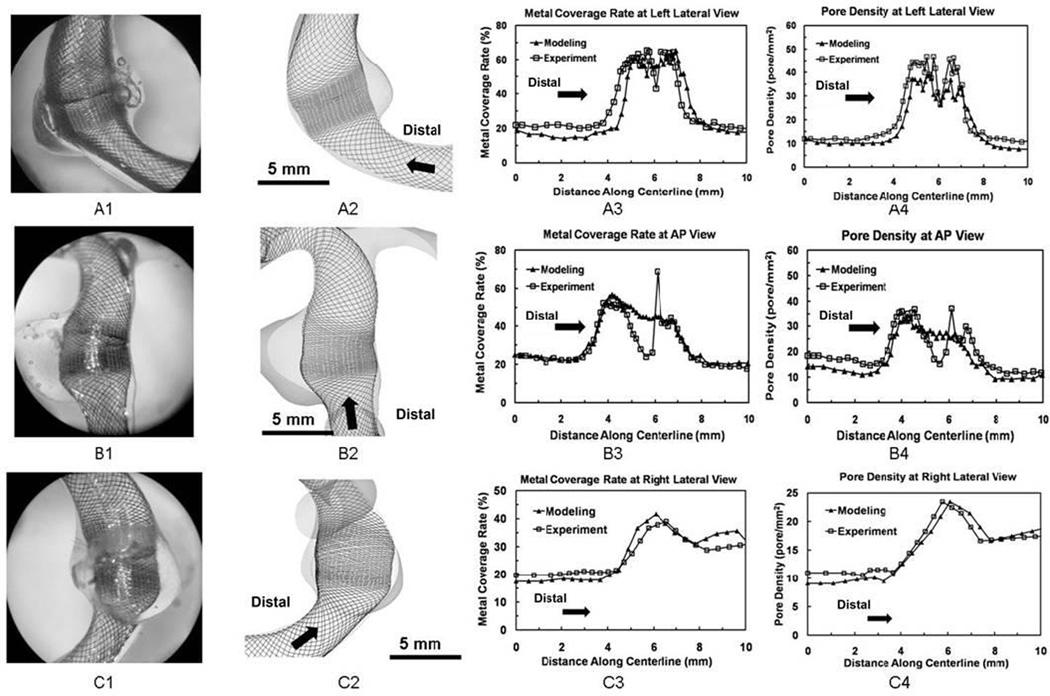
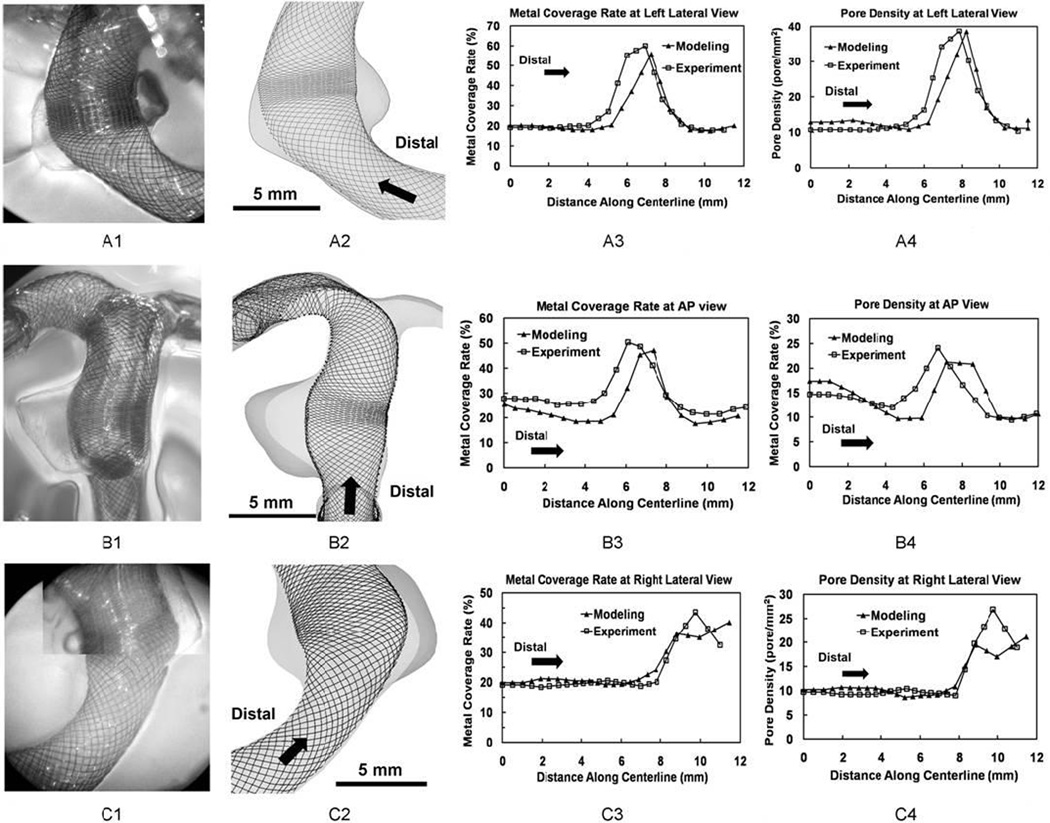
In the dense packing scenario (Figure 7A3, B3 and C3), the metal coverage rate was relatively constant (20% – 30%) inside the parent vessel proximally and distally. It experienced an abrupt jump near the orifice region. The peak value region spanned about 4 mm across the aneurysm orifice with average values of 49% and 48% for simulation and experiment results respectively shape. The experiment results of dense packing (Figure 7A1 and B1) revealed that a number of FD strands were entangled together, causing spikes and valleys in metal coverage rate at nearby regions (Figure 7A3 and B3). This abnormal mesh profile was caused by over-packing during the in vitro deployment. Simulation results did not capture this phenomenon.
Figure 7.
Completely expanded FDs in experiment and simulation and quantitative comparison of their mesh density distributions for the dense packing scenario. From upper row to bottom row: (A) Left lateral view; (B) AP view; (C) Right lateral view. From left column to right column: 1. experimentally created FD mesh (with the same length scale as column 2); 2. Simulated FD mesh; 3. Plots of metal coverage rate distribution along centerline; 4. Plots of pore density distribution.
In the loose packing scenario (Figure 8A3, B3, and C3), the metal coverage rate in the parent vessel was similar to observations from the dense packing scenario (20% – 30%). The average peak values of the metal coverage rate were 40% for the simulation and 42% for the experiment. The longitudinal length of the dense mesh region was about 2 mm over the orifice.
Figure 8.
Same as Figure 7 but for the loose packing scenario.
5.4. Pore Density at Completion of Deployment
In the dense packing scenario (Figure 7A4, B4, and C4), the final pore density was almost constant along the parent vessel (about 15 pores mm−2). Pore density curve experienced a plateau area near the orifice with an average value about 30 pores mm−2 for both simulation and experiment. The plateau width was about 4 mm along the lumen. The abnormal mesh profile in the orifice region resulted in a sudden change of pore density values at the AP view (Figure 7B4).
In the loose packing scenario (Figure 8A4, B4, and C4), a similar trend of pore density distribution was observed. The value inside both parent vessels was about 10–15 pores mm−2. Pore density experienced a quick rise across the orifice, but barely formed a plateau as observed in dense packing scenario. The average peak values were 20 and 22 pores mm−2 for the simulation and experiment results respectively. The width of peak value region was about 2 mm along FD lumen.
5.5. Pore Density versus Metal Coverage Rate
Both in vitro experiment and modeling results demonstrated a similar linear relationship between the pore density and metal coverage rate (Figure 9). However, in the dense packing scenario, the pore density values from both experiment and modeling deviated from the theoretical prediction and increased at a higher slope as metal coverage rate increased.
Figure 9.
Scatter plots for pore density vs. metal coverage rate from (A) dense packing scenario; (B) loose packing scenario. Straight lines represented the theoretical relationship. Modeling and experimental results followed the same trend.
6. Discussion
Neurovascular FDs have shown huge advantages in occluding difficult-to-treat aneurysms such as wide-necked, fusiform or giant aneurysms, as well as recurrent and ruptured aneurysms.29 However, complications have been reported including delayed aneurysm rupture, parent vessel occlusion, and post-treatment ischemic stroke.6,25,26 To counter these problems, different flow-diverting strategies have been applied/proposed for individual cases: single FD versus multiple overlapping FDs, various deployment schemes to generate varying mesh density, combination of FD with one or many coils.26
Meanwhile, very little is known about causes of the adverse effects in FD applications, or which strategies are the most effective for a given situation. Furthermore, FD treatment does not afford immediate aneurysm occlusion even in successfully treated cases,12 making it difficult for clinicians to accurately judge the treatment outcome in a timely manner. Further understanding of the interplay between FD-modified hemodynamics, aneurysmal thrombogenesis, and aneurysm wall degradation is needed to better facilitate clinical decision-making. To this end, numerical modeling serves as a promising tool because it can provide detailed 3D hemodynamics after FD implantation, flexibility in studying different variables, and even methods for predicting thrombus formation.31
Because FD deployment results are operation-dependent due to the high flexibility of the FD mesh and its densely braided construct, candidate modeling methods should be evaluated for their relevance to FD behaviors observed in patient-specific cases. In previously reported simulation studies on FD-treated aneurysm cases,4,7,16,32 little attention has been given to accurately reproducing the 3D geometry of the deployed FD in patient-specific cases. Inaccuracy in the deployed FD geometry could compromise the reliability of flow prediction. To this end, Larrabide et al17 compared the virtual stenting result (by fast virtual stenting method) to the 2D angiography of an in vitro FD deployment with noticeable discrepancies in the FD’s positioning. Due to the limited resolution of the angiographic image, their comparison did not evaluate the detailed mesh density of the FD. Janigar et al9 reconstructed the 3D geometry of an FD in a patient-specific aneurysm phantom by using high-resolution computed tomography (CT). The reconstructed FD geometry was well matched by the virtual stenting result (via the free-form deformation technique). However, the above validations only investigated FDs deployed with uniform mesh profile, while recent in vitro and in vivo experiments have found drastic variability of FD mesh along a single FD when under different deployment strategies.21 To date, there are no reports on the feasibility of achieving such varying FD mesh densities inside patient-specific aneurysm geometry. The current study for the first time demonstrated using the push-pull technique to deploy FD in phantom-based in vitro experiments, and furthermore simulated this process in silico with detailed FD mesh distributions being captured.
The HiFiVS technique overcomes limitations of previous methods by simulating the mechanics of the entire FD deployment process. For instance, previous virtual stenting methods1,17 did not take into account the mechanical interactions among FD strands and thus cannot reproduce the dynamic deployment process that generates varying mesh profiles along the FD. Previous solid-mechanics methods are more apt at modeling the implantation of laser-cut stents.30 A braided FD elongates about 2.5–3 times of its nominal/labeled length when crimped,19 making it difficult to be implanted into tortuous lumen. To accurately predict the deployed FD configuration, numerical modeling has to account for the influences from the delivery system and the clinical deployment procedure. The current method addressed these influences in silico and demonstrated its prospects for further application.
Through both in vitro experiment and simulation, we have demonstrated that for wide-necked, nearly fusiform aneurysms, different deployment strategies based on delivery wire advancement can achieve different mesh profiles inside the orifice. Quantitatively, in the current study, 6 mm of extra advancement of delivery wire during FD expansion (represented by the pusher advancement) resulted in a higher metal coverage rate at the orifice (peak value: 49% vs. 40%) and greater area along the lumen with the dense mesh profile (peak region width: 4 mm vs. 2 mm). The potential benefits of a denser FD mesh (high metal coverage with high pore density) across the aneurysm orifice include increased aneurysm inflow reduction and improved re-endothelialization on the FD surface.18
Our in vitro deployed FD in the dense packing scenario showed abrupt spatial increase and decrease of mesh density near the aneurysm orifice (Figure 7A1, B1, and spikes on the experimental curves in A3 and B3). This was caused by unintended over-packing of the FD during the Release/Expansion stage. The strands were inadvertently pushed too close to each other and entangled. This technical issue should serve as precaution on the advancement value of wire/pusher when implementing the push-pull technique. Our simulation did not capture this error, probably due to inadequate wire/pusher advancement prescribed to make the strands entangle. On the other hand, it is highly challenging to capture the entanglement numerically because the large deformation of FD strands could cause simulation failure with excessive distortion of individual beam elements. To simulate the entanglement process, we would have to refine the local mesh resolution, increase wire/pusher axial compaction, and increase the virtual time to stabilize the computation. Such simulation could significantly increase the overall computational cost to the point of becoming unfeasible. This phenomenon might be more suitable for in vitro experiments.
Despite overall excellent agreement between our experiment and simulation, some discrepancies have been observed. The metal coverage distributions in Figure 8B3, B4 between experiment and simulation are slightly shifted along the centerline. This discrepancy is likely caused by the simplified microcatheter and delivery wire models in our simulations. The real microcatheter and delivery wire are flexible and resilient, allowing the clinician to perform micro-operations from the proximal side (such as combined push-pull and twisting) to adjust the FD positioning and mesh configuration. The virtual models of these components, limited by their simplified structures, require displacement boundary conditions to be specified at their distal ends to enable their motion. Such difference in implementing the positioning and mesh control may have caused the FD model to behave differently from the reality, thereby leading to mismatches in final deployed results.
In addition, we have noted that the pore density and metal coverage rate exhibited a linear relationship that deviates from theoretical prediction at increasing packing density, although good agreement is achieved between simulation and experiments (Figure 9A vs. 9B). More specifically, the theoretical calculation underestimated the pore density at a given metal coverage rate. This is probably because the total length of the helical strand might be slightly shortened when the FD was packed for denser mesh, resulting in shorter cell edges (smaller l) and thus a higher slope (2lt)−1 than the theoretical line.
We originally performed blinded deployment simulations ahead of the in vitro implantation. However, without knowing the modeled case, the clinician elected to place the FD distal landing zone in the right posterior cerebral artery instead of the basilar artery as simulated. Thus, we decided to re-run the simulation as reverse validation to test if the simulation can reproduce the physical FD deployment results. From our study, we have found that as long as the key clinical information (the vascular geometry, the planned FD positioning, the size of FD and the maneuver strategy) is properly obtained before the simulation, virtual FD deployment using HiFiVS can reliably predict physical FD deployment. This experience highlights the importance of communication between the modelers and the clinicians regarding the setup of the models to reflect the intended treatment strategies for particular patient cases.
In the future, HiFiVS can be combined with CFD analysis to: (1) provide high-fidelity prospective evaluation of FD treatment strategies and (2) retrospectively recapitulate FD-treated cases in detail to help understand the correlation between treatment outcomes and hemodynamic modifications by FDs.
Limitations of this study include the following. First, the vascular wall was treated as rigid in both experiment and simulation, thus the influence of FD implantation on the vascular geometry was not evaluated. Second, the virtual FD deployment did not model the presence of flow as in experiment. However, the effect of flow (mainly in friction coefficient and drag force) should have minimal influence on the deployment result due to two main reasons: (1) the FD strand-strand friction coefficient is already low (estimated to be < 0.2 based on our tests of surface properties of the Pipeline Embolization Device strand at the “Industry/University Center for Biosurfaces” at the University of Buffalo). While the presence of flow would further reduce the friction coefficient, our previous study20 have found that FD deployment results are insensitive to low values (0.01~0.2) of friction coefficients; (2) Given the helical shape of FD strands, it is the geometrical constraints that enforce the deployed FD shape. The displacement boundary condition determines the deformation results regardless of the additional drag force. Therefore drag effect on the deployed FD geometry is negligible.
7. Conclusion
We have validated the HiFiVS technique by recapitulating a challenging push-pull clinical FD deployment technique, which generates variable pore density along the axial direction of the FD. Stepwise comparison between simulation and in vitro experiment at key deployment procedural points shows that the simulations accurately matched the experiments. Quantitative distributions of metal coverage rate and pore density at the final deployed geometry in three view directions further validate the simulation results and demonstrate the feasibility of accurate simulation of clinical FD deployment in silico using the HiFiVS technique. The excellent agreement between the simulations and in vitro experiments provides convincing evidence that our modeling method can capture complex clinical interventions involving braided stents. This study shows for the first time—both in vitro and in silico—that for wide-neck, fusiform, or segmental aneurysms, a FD can achieve higher mesh density at the aneurysm orifice and greater area of dense mesh by judicially increasing the delivery wire advancement during FD expansion. In the future, CFD simulations will be performed in combination with HiFiVS to evaluate the flow modification effect of patient-specific, device-specific and deployment-specific FD configuration on aneurysm treatment outcome.
Acknowledgements
This study was partially supported by NIH/NINDS (Grant No. R01NS064592), Toshiba Medical Systems, Covidien (Grant No. VTGCC053012-009), and National Science Foundation of China (Grant No. 81220108007 and 81171079). We thank Jianping Xiang for assistance in phantom fabrication, Lisa Pope and Michael Rejewski for assistance in experiment, and Nicholas Liaw for editorial assistance.
Siddiqui: research grants–NIH (co-investigator: NINDS 1R01NS064592-01A1), University at Buffalo (Research Development Award); financial interests–Hotspur, Intratech Medical, StimSox, Valor Medical; consultant to Codman & Shurtleff, Concentric Medical, ev3/Covidien Vascular Therapies, GuidePoint Global Consulting, Penumbra; speakers’ bureaus—Codman & Shurtleff, Genentech; advisory board–Codman & Shurtleff; honoraria–Abbott Vascular, Codman & Shurtleff, Genentech, Neocure Group LLC.
Abbreviations
- FD
flow diverter
- FEA
finite element analysis
- CFD
computational fluid dynamics
- HiFiVS
High fidelity virtual stenting
Footnotes
Potential Conflicts of Interest / Financial Relationships
Ma: None.
Dumont: None.
Meng: Principal investigator of NIH/NINDS grant R01NS064592.
Kosukegawa: None.
Ohta: None.
Yang: None.
References
- 1.Appanaboyina S, Mut F, Lohner R, Putman C, Cebral J. Simulation of intracranial aneurysm stenting: Techniques and challenges. Computer Methods in Applied Mechanics and Engineering. 2009;198:3567–3582. [Google Scholar]
- 2.Bernardini A, Larrabide I, Morales HG, Pennati G, Petrini L, Cito S, Frangi AF. Influence of different computational approaches for stent deployment on cerebral aneurysm haemodynamics. Interface focus. 2011;1:338–348. doi: 10.1098/rsfs.2011.0004. [DOI] [PMC free article] [PubMed] [Google Scholar]
- 3.Bernardini A, Larrabide I, Petrini L, Pennati G, Flore E, Kim M, Frangi AF. Deployment of self-expandable stents in aneurysmatic cerebral vessels: comparison of different computational approaches for interventional planning. Comput. Methods Biomech. Biomed. Eng. 2012;15:303–311. doi: 10.1080/10255842.2010.527838. [DOI] [PubMed] [Google Scholar]
- 4.Cebral JR, Mut F, Raschi M, Scrivano E, Ceratto R, Lylyk P, Putman CM. Aneurysm rupture following treatment with flow-diverting stents: computational hemodynamics analysis of treatment. Am. J. Neuroradiol. 2011;32:27–33. doi: 10.3174/ajnr.A2398. [DOI] [PMC free article] [PubMed] [Google Scholar]
- 5.De Beule M, Van Cauter S, Mortier P, Van Loo D, Impe RVan, Verdonck P, Verhegghe B. Virtual optimization of self-expandable braided wire stents. Med. Eng. Phys. 2009;31:448–453. doi: 10.1016/j.medengphy.2008.11.008. [DOI] [PubMed] [Google Scholar]
- 6.Fischer S, Vajda Z, Perez MAguilar, Schmid E, Hopf N, Bazner H, Henkes H. Pipeline Embolization Device (PED) for neurovascular reconstruction: initial experience in the treatment of 101 intracranial aneurysms and dissections. Neuroradiology. 2012;54:369–382. doi: 10.1007/s00234-011-0948-x. [DOI] [PMC free article] [PubMed] [Google Scholar]
- 7.Fu W, Gu Z, Meng X, Chu B, Qiao A. Numerical simulation of hemodynamics in stented internal carotid aneurysm based on patient-specific model. J. Biomech. 2010;43:1337–1342. doi: 10.1016/j.jbiomech.2010.01.009. [DOI] [PubMed] [Google Scholar]
- 8.Hoi Y, Woodward SH, Kim M, Taulbee DB, Meng H. Validation of CFD simulations of cerebral aneurysms with implication of geometric variations. J. Biomech. Eng. Trans. ASME. 2006;128:844–851. doi: 10.1115/1.2354209. [DOI] [PMC free article] [PubMed] [Google Scholar]
- 9.Janiga G, Rossl C, Skalej M, Thevenin D. Realistic virtual intracranial stenting and computational fluid dynamics for treatment analysis. J. Biomech. 2013;46:7–12. doi: 10.1016/j.jbiomech.2012.08.047. [DOI] [PubMed] [Google Scholar]
- 10.Jedwab MR, Clerc CO. A study of the geometrical and mechanical properties of a self-expanding metallic stent - theory and experiment. J. Appl. Biomater. 1993;4:77–85. doi: 10.1002/jab.770040111. [DOI] [PubMed] [Google Scholar]
- 11.Kallmes DF, Ding YH, Dai D, Kadirvel R, Lewis DA, Cloft HJ. A new endoluminal, flow-disrupting device for treatment of saccular aneurysms. Stroke. 2007;38:2346–2352. doi: 10.1161/STROKEAHA.106.479576. [DOI] [PubMed] [Google Scholar]
- 12.Kan P, Siddiqui AH, Veznedaroglu E, Liebman KM, Binning MJ, Dumont TM, Ogilvy CS, Gaughen JR, Jr., Mocco J, Velat GJ, Ringer AJ, Welch BG, Horowitz MB, Snyder KV, Hopkins LN, Levy EI. Early postmarket results after treatment of intracranial aneurysms with the Pipeline Embolization Device: a U.S. multicenter experience. Neurosurgery. 2012;71:1080–1087. doi: 10.1227/NEU.0b013e31827060d9. discussion 1087–1088. [DOI] [PubMed] [Google Scholar]
- 13.Kim JH, Kang TJ, Yu WR. Mechanical modeling of self-expandable stent fabricated using braiding technology. J. Biomech. 2008;41:3202–3212. doi: 10.1016/j.jbiomech.2008.08.005. [DOI] [PubMed] [Google Scholar]
- 14.Kosukegawa H, Mamada K, Liu L, Inoue K, Kuroki K, Havase T, Ohta M. Measurements of Dynamic Viscoelasticity of Poly (vinyl alcohol) Hydrogel for the Development of Blood Vessel Biomodeling. Journal of Fluid Science and Technology. 2008;3:533–543. [Google Scholar]
- 15.Kosukegawa H, Shida S, Hashida Y, Ohta M. Mechanical Properties of Tube-shaped Poly (vinyl alcohol) Hydrogel Blood Vessel Biomodel. ASME 2010 3rd Joint US-European Fluids Engineering Summer Meeting and 8th International Conference on Nanochannels, Microchannels, and Minichannels. 2010 [Google Scholar]
- 16.Kulcsár Z, Augsburger L, Reymond P, Pereira VM, Hirsch S, Mallik AS, Millar J, Wetzel SG, Wanke I, Rüfenacht DA. Flow diversion treatment: intra-aneurismal blood flow velocity and WSS reduction are parameters to predict aneurysm thrombosis. Acta Neurochir. 2012;154:1827–1834. doi: 10.1007/s00701-012-1482-2. [DOI] [PubMed] [Google Scholar]
- 17.Larrabide I, Kim M, Augsburger L, Villa-Uriol MC, Rüfenacht D, Frangi AF. Fast virtual deployment of self-expandable stents: method and in vitro evaluation for intracranial aneurysmal stenting. Med. Image Anal. 2012;16:721–730. doi: 10.1016/j.media.2010.04.009. [DOI] [PubMed] [Google Scholar]
- 18.Lieber BB, Sadasivan C. Endoluminal scaffolds for vascular reconstruction and exclusion of aneurysms from the cerebral circulation. Stroke. 2010;41:S21–S25. doi: 10.1161/STROKEAHA.110.595066. [DOI] [PMC free article] [PubMed] [Google Scholar]
- 19.Lylyk P, Miranda C, Ceratto R, Ferrario A, Scrivano E, Luna HR, Berez AL, Tran Q, Nelson PK, Fiorella D. Curative endovascular reconstruction of cerebral aneurysms with the Pipeline Embolization Device: the Buenos Aires experience. Neurosurgery. 2009;64:632–642. doi: 10.1227/01.NEU.0000339109.98070.65. [DOI] [PubMed] [Google Scholar]
- 20.Ma D, Dargush GF, Natarajan SK, Levy EI, Siddiqui AH, Meng H. Computer modeling of deployment and mechanical expansion of neurovascular flow diverter in patient-specific intracranial aneurysms. J. Biomech. 2012;45:2256–2263. doi: 10.1016/j.jbiomech.2012.06.013. [DOI] [PubMed] [Google Scholar]
- 21.Makoyeva A, Bing F, Darsaut TE, Salazkin I, Raymond J. The varying porosity of braided self-expanding stents and flow diverters: an experimental study. Am. J. Neuroradiol. 2013 doi: 10.3174/ajnr.A3234. In press. [DOI] [PMC free article] [PubMed] [Google Scholar]
- 22.Nelson PK, Lylyk P, Szikora I, Wetzel SG, Wanke I, Fiorella D. The Pipeline Embolization Device for the intracranial treatment of aneurysms trial. Am. J. Neuroradiol. 2011;32:34–40. doi: 10.3174/ajnr.A2421. [DOI] [PMC free article] [PubMed] [Google Scholar]
- 23.Ohta M, Handa A, Iwata H. Poly-vinyl alcohol hydrogel vascular models for in vitro aneurysm simulations: the key to low friction surfaces. Technol. Health Care. 2004;12:225–233. [PubMed] [Google Scholar]
- 24.Shirasu K, Wakabayashi N, Yoneyama T, Igarashi Y. Non-linear finite element stress analysis of plastic deformation in Co-Cr wrought-wire clasps. Dent Mater. 2008;24:1518–1524. doi: 10.1016/j.dental.2008.03.026. [DOI] [PubMed] [Google Scholar]
- 25.Siddiqui AH, Abla AA, Kan P, Dumont TM, Jahshan S, Britz GW, Hopkins LN, Levy EI. Panacea or problem: flow diverters in the treatment of symptomatic large or giant fusiform vertebrobasilar aneurysms. J. Neurosurg. 2012;116:1258–1266. doi: 10.3171/2012.2.JNS111942. [DOI] [PubMed] [Google Scholar]
- 26.Siddiqui AH, Kan P, Abla AA, Hopkins LN, Levy EI. Complications after treatment with Pipeline embolization for giant distal intracranial aneurysms with or without coil embolization. Neurosurgery. 2012;71:E509–E513. doi: 10.1227/NEU.0b013e318258e1f8. discussion E513. [DOI] [PubMed] [Google Scholar]
- 27.Szikora I, Berentei Z, Kulcsar Z, Marosfoi M, Vajda ZS, Lee W, Berez A, Nelson PK. Treatment of intracranial aneurysms by functional reconstruction of the parent artery: The Budapest experience with the Pipeline Embolization Device. Am. J. Neuroradiol. 2010;31:1139–1147. doi: 10.3174/ajnr.A2023. [DOI] [PMC free article] [PubMed] [Google Scholar]
- 28.Tremmel M, Xiang J, Natarajan SK, Hopkins LN, Siddiqui AH, Levy EI, Meng H. Alteration of intra-aneurysmal hemodynamics for flow diversion using enterprise and vision stents. World Neurosurg. 2010;74:306–315. doi: 10.1016/j.wneu.2010.05.008. [DOI] [PMC free article] [PubMed] [Google Scholar]
- 29.Tse MM, Yan B, Dowling RJ, Mitchell PJ. Current status of Pipeline Embolization Device in the treatment of intracranial aneurysms: A review. World Neurosurg. 2013 doi: 10.1016/j.wneu.2012.09.023. In press. [DOI] [PubMed] [Google Scholar]
- 30.Wu W, Qi M, Liu XP, Yang DZ, Wang WQ. Delivery and release of nitinol stent in carotid artery and their interactions: A finite element analysis. J. Biomech. 2007;40:3034–3040. doi: 10.1016/j.jbiomech.2007.02.024. [DOI] [PubMed] [Google Scholar]
- 31.Xu Z, Chen N, Shadden SC, Marsden JE, Kamocka MM, Rosen ED, Alber M. Study of blood flow impact on growth of thrombi using a multiscale model. Soft Matter. 2009;5:769–779. [Google Scholar]
- 32.Zhang Y, Yang X, Wang S, Qiao A, Chen J, Zhang K, Liu Z, Zhao Y, Zhang Y, Luo B, Li C. Hemodynamic effects of stenting on wide-necked intracranial aneurysms. Chin Med J (Engl) 2010;123:1999–2003. [PubMed] [Google Scholar]


