Abstract
Toll like receptors 7 (TLR7) and 9 (TLR9) are important mediators of innate immune responses. Both receptors are located in endosomal compartments, recognize nucleic acids and signal via Myeloid differentiation factor 88 (MyD88). In the current study, we analyzed TLR7 and TLR9 induced activation of astrocytes and microglia, two cell types that contribute to innate immune responses in the CNS. TLR7 and TLR9 agonists induced similar cytokine profiles in each cell types. However, there were notable differences in the cytokine profile between astrocytes and microglia, including the production of the anti-inflammatory cytokine IL-10 and anti-apoptotic cytokines G-CSF and IL-9 by microglia but not astrocytes. Costimulation studies demonstrated that the TLR7 agonist, imiquimod, could inhibit TLR9 agonist-induced innate immune responses, in both cell types, in a concentration dependent manner. Surprisingly, this inhibition was not mediated by TLR7, as deficiency in TLR7 did not alter suppression of the TLR9 agonist-induced responses. The suppression of innate immune responses was also not due to an inhibition of TLR9 agonist uptake. This suggested that imiquimod suppression may be a direct effect, possibly by blocking CpG-ODN binding and/or signaling with TLR9, thus limiting cell activation. An antagonistic relationship was also observed between the two receptors in microglia, with TLR7 deficiency resulting in enhanced cytokine responses to CpG-ODN stimulation. Thus, both TLR7 and its agonist can have inhibitory effects on TLR9-induced cytokine responses in glial cells.
Keywords: brain, cytokines, costimulation, imiquimod, CpG-ODN
Introduction
Astrocytes and microglia are important cell types in the central nervous system (CNS), their activation is associated with multiple neurological diseases and they play an important role in the innate immune responses to virus infection in the CNS (Asensio and Campbell, 1997; Cheeran et al., 2001; Dickson et al., 1993; Griffin, 2003; Peterson et al., 2004; Sauder et al., 2000). Since microglia are bone-marrow derived, while astrocytes differentiate from neuroprogenitor cells, the response of these two cell types to similar stimulation may vary significantly. The types of cytokines and chemokines produced by these cell types in the CNS may affect the response of other cell types in the CNS, as well as influence neuronal damage or the recruitment of inflammatory cells in the CNS.
Recent studies demonstrated that toll-like receptor (TLR) 7, which recognizes viral single-stranded RNA, and TLR9, which recognizes unmethylated DNA with CpG motifs, can play an important role in both the activation of innate immune responses and in viral pathogenesis (Lewis et al., 2008; Sorensen et al., 2008; Town et al., 2009). Agonists of both TLR7 and TLR9 are also being investigated for the potential use in treating CNS-related diseases (Butchi et al., 2008; El Andaloussi A. et al., 2006; Pedras-Vasconcelos et al., 2006; Pedras-Vasconcelos et al., 2008; Prins et al., 2006). However, there appears to be some differences in the CNS response to activation of these receptors. For example, peripheral administration of TLR9 agonists, but not TLR7 agonists, were protective against arenavirus-induced neurological disease (Pedras-Vasconcelos et al., 2006). Different responses were observed with intracerebroventricular inoculation of agonists, as TLR9 agonist inoculation was lethal in newborn mice, while TLR7 agonist was not (Butchi et al., 2008; Pedras-Vasconcelos et al., 2006). Understanding the similarities and differences of TLR7 and TLR9-induced cell activation in brain cells, is important for understanding viral pathogenesis as well as potential use of TLR agonists in the treatment of neurological diseases. Both murine astrocytes and microglia express Tlr7 and Tlr9 mRNA (Carpentier et al., 2005; McKimmie and Fazakerley, 2005). Furthermore, both astrocytes and microglia can respond to TLR7 or TLR9 agonist stimulation in vitro (Bowman et al., 2003; Dalpke et al., 2002; Gurley et al., 2008; Hosoi et al., 2004; Iliev et al., 2004; Zhang et al., 2005). However, an in depth comparison of the innate immune responses elicited by these cell types in response to TLR7 or TLR9 stimulation has not been completed.
TLR7 and TLR9 agonists and/or receptors may also interact with each other and influence the cellular response to pathogen stimulation. Natural and synthetic TLR7 agonists were reported to inhibit CpG-ODN induced IFNα production from plasmacytoid dendritic cells and B cells following TLR7/TLR9 costimulation (Berghofer et al., 2007; Marshall et al., 2007). Since certain virus infections, such as cytomegalovirus and HIV, may activate both TLR7 and TLR9 pathways (Beignon et al., 2005; Mandl et al., 2008; Zucchini et al., 2008), the interaction of these receptors in glial cells may also play an important role in modulating the immune response.
In the present study, we analyzed the response of astrocytes and microglia following TLR7 and/or TLR9 agonist stimulation. Primary astrocytes and microglia from neonatal mice were cultured in vitro and stimulated with TLR7 agonist, imiquimod and/or TLR9 agonist, CpG-ODN 1826. The expression of genes involved in TLR7/TLR9 signaling and production of proinflammatory cytokines and chemokines by astrocytes and microglia were compared. The interaction between TLR7, TLR9 and their agonists in inducing cytokines and chemokines was also analyzed.
Materials and Methods
TLR agonists
The TLR7 agonist imiquimod (R837), TLR9 agonist type B CpG-ODN 1826 [5’- tcc atg acg ttc ctg acg tt −3’ 20 mer] and FITC-labeled CpG-ODN 1826 were purchased from InvivoGen. All of the agonists were suspended in endotoxin-free water, aliquoted, and stored at −20°C. Just before use, agonists were diluted in media specific for either astrocytes or microglia or neurons.
Mice
TLR7-deficient C57BL/6 mice (Hemmi et al., 2002) were kindly provided by S. Akira (Osaka University, Osaka, Japan) and were backcrossed with Inbred Rocky Mountain White (IRW) mice for at least 10 generations (Butchi et al., 2008). IRW mice and TLR7-deficient IRW mice were used for the present study. All of the animal procedures were conducted in accord with the Louisiana State University Animal Care and Use Committee guidelines or the Rocky Mountain Laboratories Animal Care and Use Committee guidelines.
Media
Astrocyte cultures were maintained in Dulbecco’s modified Eagle’s medium (Sigma-Aldrich) containing 4,500 mg glucose/L, 110 mg sodium pyruvate/L, 0.584 g L-glutamine/L, supplemented with 10% inactivated fetal bovine serum (Hyclone) and 1% penicillin-streptomycin (Gibco). Microglia-specific media contained 20 % LADMAC culture supernatant (mouse bone marrow cells producing macrophage colony stimulating factor/M-CSF) in addition to the media used for astrocyte cultures. Analysis of undiluted (100%) LADMAC supernatant by multiplex demonstrated that, in addition to high levels of M-CSF, the LADMAC supernatant also contained high levels of vascular endothelial growth factor (VEGF, ~20,000 pg/ml), moderate concentrations of CCL2 (~2,500 pg/ml) and CXCL1 (~3,000 pg/ml), as well as undetectable to trace levels of fibroblast growth factor (FGF), IL-1β, IL-2, IL-4, IL-5, and IL-10. The levels of these cytokines in the media containing 20% LADMAC supernatant were substantially lower than the levels of these cytokines in supernatants from unstimulated microglia, with the exception of VEGF. Other cytokines including TNF, IFNγ, IL-1α, IL-6, IL-13 and IL-17 were not detected in the LADMAC supernatant.
Neurons were cultured in neuron plating media composed of Opti-MEM with L-glutamine (Gibco), 0.6% wt/vol D-glucose (Sigma-Aldrich) and 5% inactivated fetal bovine serum (Hyclone). Neurons were then cultured in neuronal maintenance media composed of neurobasal media (Gibco) containing 2% B-27 supplement (Gibco) and 0.5 mM glutamax-I (Gibco).
Isolation and culturing of cortical astrocytes and microglia by percoll gradient method
Astrocyte and microglia cultures were prepared from the brain cortex of 1–2 day old IRW or TLR7−/− IRW mice. Mice were anesthetized, brain tissue removed, and placed in ice cold phosphate buffered saline (PBS). Hind brains, mid brains and meninges were dissected out. Cerebral cortices were transferred to a 15 ml conical tube containing 2% glucose in PBS and made into single cell suspension. Cells were pelleted by centrifugation at 500g for 5 min. Cells from two brain cortices were suspended in 2 ml of 70% percoll and transferred to the bottom of 30% and 0% percoll gradient. The gradients were centrifuged at 500g for 20 min. Cells between 0% and 30% percoll layers were rich in astrocytes and were seeded at 2×10⁵ cells in Primaria T-25 flasks (BD Bioscience) containing astrocyte specific media. The microglia cell populations collected between 30% and 70% percoll layers were seeded at 5×10⁵ in T-25 flasks containing microglia-specific media. When cells became confluent, after 7–10 days of culture, flasks containing astrocyte rich cells (0/30 fraction) were orbitally shaken overnight at 250 RPM to remove contaminating microglia and oligodendrocytes. Astrocytes were then treated with 0.25% Trypsin-EDTA (Gibco), reseeded in Corning 12 well cell bind plates (ISC BioExpress). Microglia were removed from confluent T-25 flasks using a cell scrapper and reseeded in 12 well cell bind plates.
Stimulation of astrocyte and microglia cultures with imiquimod or CpG-ODN
To determine the optimal concentration for activation of astrocytes and microglia, imiquimod was used at 5 nM to 50 µM, and CpG-ODN 1826 was used at 0.5 nM to 500 nM. For all further studies, multiplex analysis of cytokines and super array analysis, imiquimod and CpG-ODN 1826 were used at 5µM (1.25 µg/ml) and 80nM (0.5 µg/ml) respectively, unless otherwise stated. All the experiments were conducted in triplicate wells for each time point and concentration with the appropriate media used for the controls.
Mouse primary cortical neuron cultures
For culturing neurons, tissue culture plates were coated with 20 µg/ml Poly-L Ornithine hydro-bromide (Sigma-Aldrich) and 2.5 µg/ml of Laminin (Sigma-Aldrich-Aldrich). Cortical neurons were isolated from embryonic 16–18 day gestation mice. Fore brains from the E16-E18 mice were dissected out, meninges were peeled off and cortices were collected in cold Ca, Mg free HBSS (Invitrogen), containing 10mM HEPES, pH 7.3 (Invitrogen). Neurons were dissociated in 0.25% Trypsin (Invitrogen) for 15 min at 37°C and made into single cell suspension by gentle trituration. Cells were seeded at 4×10⁵ cells per well of 24-well plates or 8-chamber slides in neural plating media. Following initial attachment of the cells to the plates (4h), neuronal plating media was replaced with neuronal maintenance media along with the appropriate agonist or culture supernatant and incubated at 37°C and 5% CO2.
After 4h of culture, apoptosis was induced in some wells by adding 300 µM NMDA + 5µM glycine for 15 min in HBSS (Ca, Mg free) and rinsed with HBSS at the end of incubation. Supernatants from TLR7 or TLR9 stimulated astrocytes and microglia were added to all the wells at a 1:1 ratio of Neurobasal media and stimulated supernatants and incubated for 72h at 37°C and 5% CO2. For agonist stimulation, cells were cultured with either 5 µM imiquimod and/or 80 nM CpG-ODN 1826. Cells were also exposed to NMDA as described above for comparison. Neuronal survival or death was measured by MTT assay or staining neurons for beta tubulin.
MTT assay
MTT [1-(4,5-Dimethylthiazol-2-yl)-3,5-diphenylformazan)] (Invitrogen) was added into all the wells directly into the medium at final concentration of 0.5 mg/ml and incubated at 37°C for 3–4 h. All the wells were rinsed twice with PBS and the insoluble formazen produced from MTT by mitochondrial reductases was solubilized in DMSO to get homogenous color. The absorbance was measured at 540 nm on a Spectramax 190 plate reader with Softmax pro 5 software, with DMSO as reagent blank. The percent viability of the cells was calculated from the mean absorbance of mock controls.
Immunofluorescence assay
Neuronal cultures in 8-chamber slides (BD Biocoat) were fixed in 4% paraformaldehyde (Electron Microscopy Sciences) and permeabilized with 0.1% Triton X-100 (Sigma-Aldrich) and 0.1% sodium citrate (Sigma-Aldrich) in 1X PBS for 30 min. Cells were then treated with 0.1M glycine for 30 min and incubated with blocking solution containing 2% donkey serum (Millipore), 1% BSA (Sigma-Aldrich), 0.1% cold fish skin gelatin (Sigma-Aldrich), 0.1% tritin-X 100, 0.05% tween 20 (Sigma-Aldrich) in PBS for 30 min. Cells were incubated with primary antibodies, monoclonal anti tubulin beta III isoform (Millipore) or polyclonal rabbit anti-bovine GFAP (Dako) for 30 min at room temperature. Cells were then incubated with goat anti-mouse Alexa Fluor 488 (Invitrogen) or goat anti-rabbit Alexa Fluor 555 (Invitrogen) for 30 min at room temperature. Finally, slides were mounted in Fluorogel II with DAPI (Electron Microscopy Sciences). All images were taken using a Nikon Eclipse 55i fluorescent microscope. GFAP detection was minimal in neuronal cultures with less than one GFAP positive cell detected per every 2 fields using a 10X objective.
Flow cytometry
Semi-confluent cultures of primary astrocytes and microglia were analyzed by intracellular staining for GFAP or F4/80 to confirm purity and for expression of TLR7 and TLR9 proteins. Briefly, cells were trypsinized or scraped, fixed for 20 min in 2% paraformaldehyde (Electron Microscopy Sciences), permeabilized with 0.1% saponin in PBS (pH 7.0) and then incubated with polyclonal rabbit anti-bovine GFAP (Dako), monoclonal anti-mouse F4/80 (eBioscience), polyclonal rabbit anti-TLR7 (Zymed) or monoclonal mouse anti-TLR9 (Imgenex) for 30 min. Cells were washed twice with 0.1% saponin in PBS and incubated with Alexa Fluor 488 conjugated goat anti-rabbit IgG or FITC-conjugated goat anti-mouse IgG (BD Biosciences) for 30 min. Cells were washed twice with 0.1% saponin in PBS, re-suspended in PBS and analyzed on a FACSAria flow cytometer (BD Bioscience) using FACSDiva software (BD Bioscience). Data analysis was performed using FCS express V3 software (De Novo). Specificity of the TLR7 antibody was verified by immunocytochemical staining of TLR7-transfected HEK cells and non-transfected HEK cells. A rabbit anti-green flourescent protein (GFP) polyclonal antibody was utilized as an additional negative control and demonstrated no increase in staining compared to the no-primary antibody control (data not shown).
RNA isolation and Quantitative Real-time RT-PCR
Astrocyte or microglia cells were lysed and processed for RNA extraction using a mini RNA isolation kit (Zymo Research) following manufacturer’s instructions. RNA was treated with DNAse I (Ambion) for 30 min at 37°C to remove any genomic DNA contamination and purified using RNA cleanup columns (Zymo Research). cDNA was generated using an iScript reverse transcription kit (Bio-Rad) following manufacturer’s instructions. cDNA samples were diluted 5 fold after reverse transcription, prior to use in quantitative real-time PCR reaction. All the real-time PCR reactions were performed using a 7900 Applied Biosystems PRISM instrument. All samples were run in triplicate in a 384-well plate. Each reaction contained iTaq SYBR green supermix with Rox (Bio-Rad), 0.5 µM forward and reverse primers, approximately 10 ng of cDNA template and nuclease-free water. Primers (Table I) (Butchi et al., 2008) were confirmed to be specific for the gene of interest. No homology to other genes was detected by blast analysis of primers against the National Center for Biotechnology Information (NCBI) database. RNA that did not undergo reverse transcription and water were used as negative controls. Dissociation curves were used to confirm amplification of a single product for each primer pair per sample. Expression levels for each gene were calculated as percent difference in CT value (ΔCT = CT Gapdh - CT gene of interest). The mean percent Gapdh values of mock samples for each time point were calculated and used to generate fold changes relative to mock expression for each group.
Table I.
Primers used for Real-time RT-PCR analysis
| Common name | NCBIa Gene Symbol & ID# |
Forward primer | Reverse primer |
|---|---|---|---|
| Amyloid beta (A4) precursor protein | App: 11820 | ACCGTTGCCTAGTTGGTGAG | CATGCCATAGTCGTGCAAGT |
| Brain derived neurotrophic factor | Bdnf: 12064 | ATTAGCGAGTGGGTCACAGC | ACTGCTTCAGTTGGCCTTTG |
| Chemokine ligand 2, MCP-1 | Ccl2: 20296 | TCCCAATGAGTAGGCTGGAG | CCTCTCTCTTGAGCTTGGTGA |
| Cd14 antigen | Cd14:12475 | AACCTGGAAGCCAGAGAACA | CCAGAAGCAACAGCAACAAG |
| Chemokine ligand 10, IP-10 | Cxcl10: 15945 | CAGTGAGAATGAGGGCCATAGG | CTCAACACGTGGGCAGGAT |
| Glyceraldehyde-3-phosphate dehydrogenase | Gapdh: 14433 | TGCACCACCAACTGCTTAGC | TGGATGCAGGGATGATGTTC |
| Intercellular adhesion molecule-1, CD54 | Icam1: 15894 | AGGGCTGGCATTGTTCTCTA | CTTCAGAGGCAGGAAACAGG |
| Interferon beta | Ifnb1: 15977 | AGCACTGGGTGGAATGAGAC | TCCCACGTCAATCTTTCCTC |
| Prion protein | Prnp: 19122 | GGACCGCTACTACCGTGAAA | TCATCTTCACATCGGTCTCG |
| S100 protein, beta polypeptide, neural | S100b: 20203 | GGTGACAAGCACAAGCTGAA | ACGAAGGCCATGAACTCCT |
| Solute carrier family 1 (glial high affinity glutamate transporter), member 2, GLT1, Eaat2 | Slc1a2: 20511 | TCTGAGGAGGCCAATACCAC | TTCATCCCGTCCTTGAACTC |
| Solute carrier family 1 (glial high affinity glutamate transporter), member 3, GLAST, Eaat1 | Slc1a3: 20512 | GCCTATCCAGTCCAACGAAA | CGAAGCACATGGAGAAGACA |
| Tumor necrosis factor | Tnf: 21926 | CCACCACGCTCTTCTGTCTAC | GAGGGTCTGGGCCATAGAA |
NCBI, National Center for Biotechnology Information.
Mouse toll-like receptor signaling pathway PCR Array
Astrocytes and microglia were treated with either 5 µM imiquimod or 80 nM of CpG-ODN 1826 or both. At 6 hours post stimulation (hps), RNA was isolated and treated with DNAse I as described earlier. First strand cDNA was synthesized using 100 ng of cleaned up RNA and analyzed for a mouse-TLR pathway-specific gene expression profile as per the manufacturer’s instructions (SABiosciences) on a 7900 Applied Biosystems PRISM instrument. A total of 84 genes related to mouse TLR-mediated signal transduction were analyzed in a 384 well format. The CT (cycle threshold) values from both control and treatment groups were obtained from real-time 384-well PCR Array results and analyzed using RT2 profiler PCR array data analysis template (SA Biosciences). The samples were analyzed only if the test passed all the quality controls including RT efficiency and lack of DNA contamination. Data were calculated as fold difference for the treatment groups compared to mock groups.
Multiplex analysis of cytokine and chemokine proteins
Supernatants from stimulated and unstimulated astrocyte and microglia cultures were collected at 12 hps and were stored in triplicate aliquots at −80°C until use. Just before use, supernatants were thawed and centrifuged at 4,500g for 15 min at 4°C to remove any cellular debris. Culture supernatants were analyzed for cytokine and chemokine protein production using Linco’s 22 plex kit (Millipore) on a Luminex 100 instrument (Bio-Rad) following manufacturer’s instructions. All the samples were run in duplicate. Samples were calculated as pg/ml of supernatant using standard curve generated from in-plate standards. For the majority of the positive samples, values were within the linear part of the standard curve.
Cell entry assay for CpG-ODN 1826
Glial cells were grown in 96 well plates to near confluency and were stimulated with mock or imiquimod 5 µM or 50 µM ± 80 nM FITC labeled CpG-ODN 1826. Cells were incubated for 30 min at 37°C and 5% CO2, washed three times in PBS and then analyzed for FITC uptake. All images were taken using an Olympus IX71 inverted fluorescent microscope. Further, cells were lysed in cell lysis buffer (0.5% Triton X-100, 0,5% sodium deoxycholate, 150 mM NaCl, 50 mM Tris HCl, pH 7.4 and 8 mM EDTA) to release FITC into solution, and the fluorescence intensity was quantitated using a microplate reader (Polar star Omega, BMG labtech).
Results
TLR7 and TLR9 expression in primary astrocytes and microglia
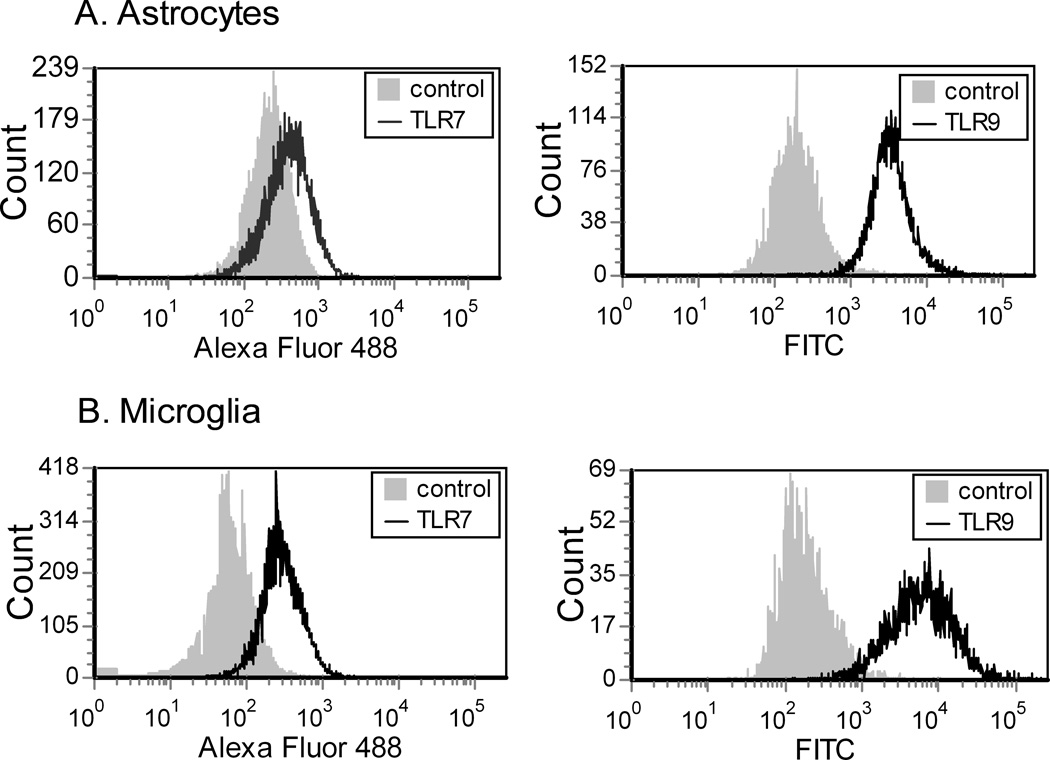
Astrocyte and microglia cultures were analyzed by intracellular flow cytometry, and were consistently greater than 93% GFAP positive or 95% F4/80 positive, respectively (data not shown). Analysis of TLR7 and TLR9 expression demonstrated that both cell types expressed TLR7 and TLR9 protein with higher expression levels of both proteins on microglia as compared to astrocytes (Fig. 1).
Fig. 1. Expression of TLR7 and TLR9 on primary astrocytes and microglia.
(A) astrocyte and (B) microglia cultures were analyzed for expression of TLR7 and TLR9 by flow cytometry. Data are shown as a histogram with fluorescence intensity on X-axis and counts/cell numbers on Y-axis. For detection of TLR7, cells were incubated with Alexa Flour 488 conjugated goat anti-rabbit, either with rabbit anti-TLR7 (TLR7) or with no primary antibody (control). The mean fluoresce intensity (MFI) was substantially higher for TLR7-stained astrocytes (470, 349) than for the no primary antibody controls (269, 211) demonstrating that astrocytes expressed TLR7 protein, albeit at low levels. For detection of TLR9, cells were stained with a FITC- conjugated mouse-IgG (control) or with mouse anti-TLR9 and FITC-conjugated anti-mouse IgG (TLR9). Data are representative of two replicate experiments.
mRNA expression of signal transduction and inflammatory genes following TLR7/9 stimulation
To examine the response of astrocytes and microglia to TLR7 and/or TLR9 activation, we first identified the optimal stimulatory concentration of TLR7 and TLR9 agonists using a range of 5 nM to 50 µM of imiquimod or 0.5 nM to 500 nM of CpG-ODN 1826. Optimal cytokine production in both cell types was induced with 5 µM of imiquimod or 80 nM of CpG-ODN 1826 (data not shown). Concentrations greater than 500 nM of ODN 1826 were toxic to both astrocytes and microglia. Kinetic analysis of gene expression indicated peak expression of proinflammatory cytokines and chemokines at 6–12 hours post stimulation (hps), with most cytokine mRNA expression diminishing by 48 hps (data not shown). For all further studies, 5 µM imiquimod and/or 80 nM CpG-ODN 1826 were used, except where noted, and the gene expression was analyzed at 6 hps.
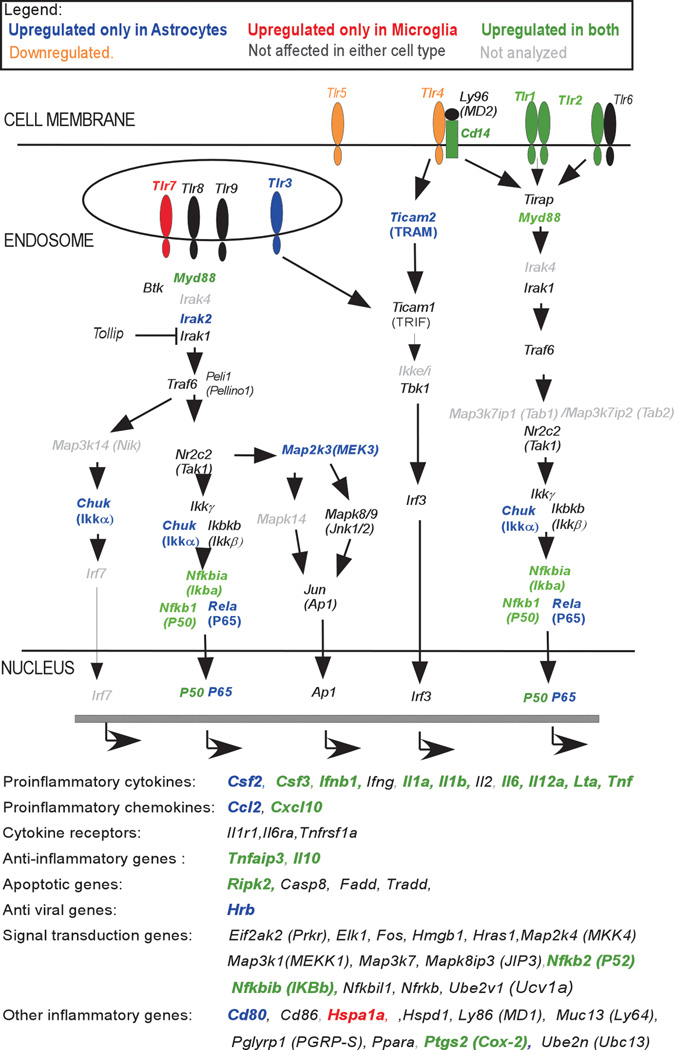
We then analyzed the influence of TLR7 and TLR9 stimulation on mRNA expression of 84 genes associated with TLR pathway, using a TLR pathway focused cDNA real-time PCR array. Although the level of gene upregulation did vary between imiquimod and CpG-ODN stimulated samples, the same genes were upregulated by both stimuli (Table II). There was some variation in mRNA upregulation between astrocytes and microglia following TLR activation, with astrocytes increasing mRNA expression of more signal transduction related genes than microglia (Table II, Fig. 2). Despite, the substantial upregulation of mRNA of TLR-related genes in astrocytes, the overall amount of mRNA of these genes in astrocytes was, in many instances, below the mRNA levels in microglia. For example, Cd14 mRNA expression was substantially upregulated on astrocytes, compared to microglia, following TLR agonist stimulation (Table II). However, the amount of Cd14 mRNA expressed by activated astrocytes was still lower than the basal level of Cd14 mRNA expression by microglia cells (data not shown).
Table II.
TLR7 and TLR9 stimulation in astrocytes and microglia induces the expression of multiple mRNAs
| Astrocytes |
Microglia |
|||||||||||
|---|---|---|---|---|---|---|---|---|---|---|---|---|
| Imiquimod a | CpG b | imiquimod+CpG c | imiquimod | CpG | imiquimod+CpG | |||||||
| Mean d | SD e | Mean | SD | Mean | SD | Mean | SD | Mean | SD | Mean | SD | |
| Toll Like Receptors | ||||||||||||
| Tlr1 | 12.6 | 3.7 | 12.4 | 2.3 | 10.4 | 5.8 | 6.6 | 0.7 | 4.8 | 1.1 | 7.2 | 1.7 |
| Tlr2 | 15.2 | 0.3 | 15.3 | 2.3 | 14.3 | 1.3 | 9.5 | 0.4 | 10.8 | 0.4 | 8.0 | 0.7 |
| Tlr3 | 3.2 | 1.3 | 2.2 | 0.6 | 2.3 | 1.1 | −1.4 | 0.1 | 1.7 | 0.4 | −0.9 | 1.6 |
| Tlr4 | 0.6 | 1.5 | 0.5 | 1.5 | −0.5 | 1.6 | −5.0 | 1.5 | −2.7 | 1.2 | −5.1 | 2.5 |
| Tlr5 | −3.1 | 1.9 | −2.7 | 1.6 | −1.8 | 0.5 | −226.3 | 157.8 | −12.1 | 8.3 | −31.4 | 14.0 |
| Tlr7 | −0.3 | 1.3 | 1.4 | 0.4 | 0.1 | 2.2 | 9.0 | 1.1 | 14.1 | 6.6 | 10.8 | 3.1 |
| Adaptors, Effectors and TLR Interacting Proteins | ||||||||||||
| Cd14 | 202.3 | 9.0 | 181.8 | 6.3 | 166.7 | 19.7 | 5.1 | 0.3 | 2.8 | 0.1 | 4.4 | 0.4 |
| Hspa1a | −1.2 | 0.1 | −1.2 | 0.0 | −1.4 | 0.1 | 2.9 | 0.4 | 4.4 | 0.6 | 2.6 | 0.3 |
| Myd88 | 5.0 | 0.7 | 4.5 | 0.1 | 4.6 | 0.1 | 1.9 | 0.2 | 2.2 | 0.1 | 2.2 | 0.3 |
| Ripk2 | 10.4 | 1.6 | 10.2 | 2.5 | 8.8 | 2.5 | 2.7 | 0.4 | 3.1 | 0.5 | 2.3 | 0.5 |
| Ticam2 | 3.8 | 0.1 | 2.9 | 1.0 | 3.3 | 0.4 | 1.3 | 0.2 | 0.5 | 1.3 | 1.5 | 0.3 |
| Irak2 | 3.2 | 0.4 | 3.5 | 0.1 | 2.7 | 0.1 | 1.3 | 0.2 | 1.9 | 0.1 | 1.1 | 0.1 |
| Downstream Signaling Molecules | ||||||||||||
| Chuk | 2.7 | 0.4 | 3.0 | 0.3 | 2.6 | 0.8 | −0.4 | 1.3 | 1.2 | 0.3 | −0.1 | 1.8 |
| Cebpb | 2.9 | 0.2 | 2.7 | 0.4 | 2.6 | 0.4 | 3.9 | 0.2 | 2.7 | 0.2 | 3.8 | 0.2 |
| Clec4e | 52.8 | 8.1 | 36.9 | 24.1 | 33.0 | 11.1 | 31.7 | 6.8 | 23.4 | 4.8 | 34.4 | 8.6 |
| Hrb | 12.9 | 1.4 | 11.8 | 2.3 | 11.4 | 1.2 | −1.2 | 0.1 | −0.4 | 1.3 | −1.1 | 0.0 |
| Irf1 | 12.3 | 1.0 | 11.5 | 2.3 | 12.9 | 1.1 | 4.9 | 0.4 | 11.9 | 1.2 | 4.8 | 0.4 |
| Map2k3 | 18.5 | 0.8 | 15.8 | 4.4 | 16.7 | 0.6 | 0.3 | 1.4 | −0.5 | 1.3 | −0.4 | 1.4 |
| Nfkb1 | 5.6 | 0.3 | 5.8 | 0.7 | 5.7 | 0.3 | 5.2 | 0.5 | 4.2 | 0.5 | 4.4 | 0.8 |
| Nfkb2 | 6.8 | 0.8 | 7.5 | 1.0 | 7.6 | 0.9 | 16.3 | 3.4 | 5.6 | 0.6 | 12.8 | 1.2 |
| Nfkbia | 12.5 | 1.0 | 13.5 | 4.0 | 12.2 | 4.1 | 10.1 | 0.6 | 7.4 | 1.1 | 11.0 | 2.1 |
| Nfkbib | 2.7 | 0.4 | 3.1 | 0.6 | 2.7 | 0.6 | 2.0 | 0.3 | −1.1 | 0.0 | 1.5 | 0.1 |
| Ptgs2 | 11.3 | 2.3 | 10.4 | 3.6 | 8.7 | 2.6 | 40.5 | 2.3 | 15.6 | 2.0 | 28.3 | 3.6 |
| Rel | 4.0 | 0.7 | 3.7 | 0.5 | 3.2 | 0.9 | 2.1 | 0.2 | 2.2 | 0.2 | 1.9 | 0.2 |
| Rela | 2.3 | 0.3 | 2.7 | 0.1 | 2.3 | 0.3 | 1.4 | 0.1 | 1.2 | 0.1 | 1.3 | 0.0 |
| Tnfaip3 | 19.4 | 1.7 | 18.1 | 8.7 | 14.9 | 5.2 | 7.0 | 1.3 | 5.9 | 0.4 | 7.5 | 1.3 |
| Cytokines and Chemokines | ||||||||||||
| Ccl2 | 82.5 | 2.8 | 81.9 | 25.2 | 76.6 | 28.3 | 0.7 | 1.6 | 2.8 | 1.2 | 0.7 | 1.7 |
| Csf2 | 178.0 | 11.0 | 221.9 | 48.8 | 131.7 | 17.5 | 8.1 | 3.1 | 25.2 | 8.8 | 7.7 | 2.6 |
| Csf3 | 33.3 | 3.7 | 20.9 | 2.5 | 24.4 | 3.5 | 252.7 | 52.2 | 70.9 | 13.7 | 175.7 | 49.1 |
| Cxcl10 | 159.2 | 44.3 | 124.9 | 17.5 | 130.8 | 42.7 | 69.8 | 45.6 | 343.2 | 216.6 | 49.3 | 33.9 |
| Ifnb1 | 29.8 | 9.2 | 13.4 | 2.1 | 17.5 | 4.3 | 53.2 | 9.7 | 35.5 | 7.0 | 30.2 | 12.4 |
| Il1a | 580.0 | 88.9 | 464.8 | 168.9 | 354.9 | 155.8 | 267.5 | 22.0 | 47.7 | 8.7 | 187.8 | 26.1 |
| Il1b | 2,005.8 | 196.3 | 1,904.8 | 602.9 | 1,503.7 | 711.1 | 3,629.1 | 322.6 | 712.3 | 147.2 | 2,644.7 | 218.7 |
| Il6 | 54.2 | 5.6 | 66.2 | 30.0 | 43.1 | 17.5 | 47.9 | 5.5 | 84.4 | 30.0 | 42.2 | 3.6 |
| Il10 | 54.5 | 4.0 | 83.2 | 42.6 | 119.4 | 61.2 | 115.4 | 34.9 | 19.5 | 3.0 | 59.6 | 15.3 |
| Il12a | 6.1 | 1.5 | 3.7 | 1.7 | 5.5 | 0.8 | 2.8 | 4.1 | 3.9 | 1.8 | 5.2 | 2.7 |
| Lta (Tnfb) | 2.5 | 3.9 | 3.7 | 0.9 | 4.5 | 3.5 | 10.1 | 4.2 | 7.2 | 1.1 | 8.4 | 3.1 |
| Tnf | 323.1 | 8.0 | 485.0 | 39.7 | 390.4 | 65.6 | 19.8 | 4.5 | 34.0 | 13.0 | 21.8 | 8.3 |
| Costimulatory Molecules | ||||||||||||
| Cd80 | 2.4 | 0.2 | 2.4 | 0.2 | 2.3 | 0.1 | −2.2 | 0.2 | 0.4 | 1.3 | −1.7 | 0.0 |
imiquimod at 5 uM
CpG0ODN at 80 pM
imiquimod at 5 uM and CpG-ODN at 80 pM
fold change: 2−ΔCt of 3 treatment samples / 2−ΔCt of 3 mock samples, ΔCt = Ct Gene of interest – Average Ct House keeping genes
standard deviation of 3 samples per group
Fig. 2. Changes in mRNA expression following TLR7 and/or TLR9 agonist stimulation in astrocytes and microglia.
Cultured astrocytes and microglia were stimulated with 5 µM imiquimod or 80 nM CpG-ODN 1826 or both. RNA was isolated at 6 hps, reverse transcribed and cDNA was analyzed for mRNA expression by quantitative real-time PCR analysis using TLR signaling pathway array. Genes are presented as a schematic of their protein’s involvement in the TLR signaling cascade or as genes transcribed following the signaling cascade. Increased mRNA expression of these genes in both microglia and astrocytes is indicated by green lettering, in astrocytes only by bold blue lettering and in microglia only by bold red lettering. Tlr4 mRNA was downregulated in microglia, while Tlr5 mRNA was downregulated in both microglia and astrocytes. Genes indicated in black lettering were not altered in either cell type and in grey lettering were not analyzed for mRNA expression.
Both cell types upregulated expression of a number of proinflammatory cytokine and chemokine genes as well as a few TLRs. Surprisingly, Tlr9 mRNA expression was not upregulated by either imiquimod or CpG stimulation, while Tlr7 mRNA expression was only upregulated in microglia. Instead, mRNAs for other TLRs, including Tlr1 and Tlr2 were upregulated by stimulation, while Tlr4 and Tlr5 mRNAs were downregulated (Fig. 2, Table II). Thus, TLR stimulation does not appear to automatically induce self upregulation of mRNA expression, suggesting a more complex regulation of TLR gene expression.
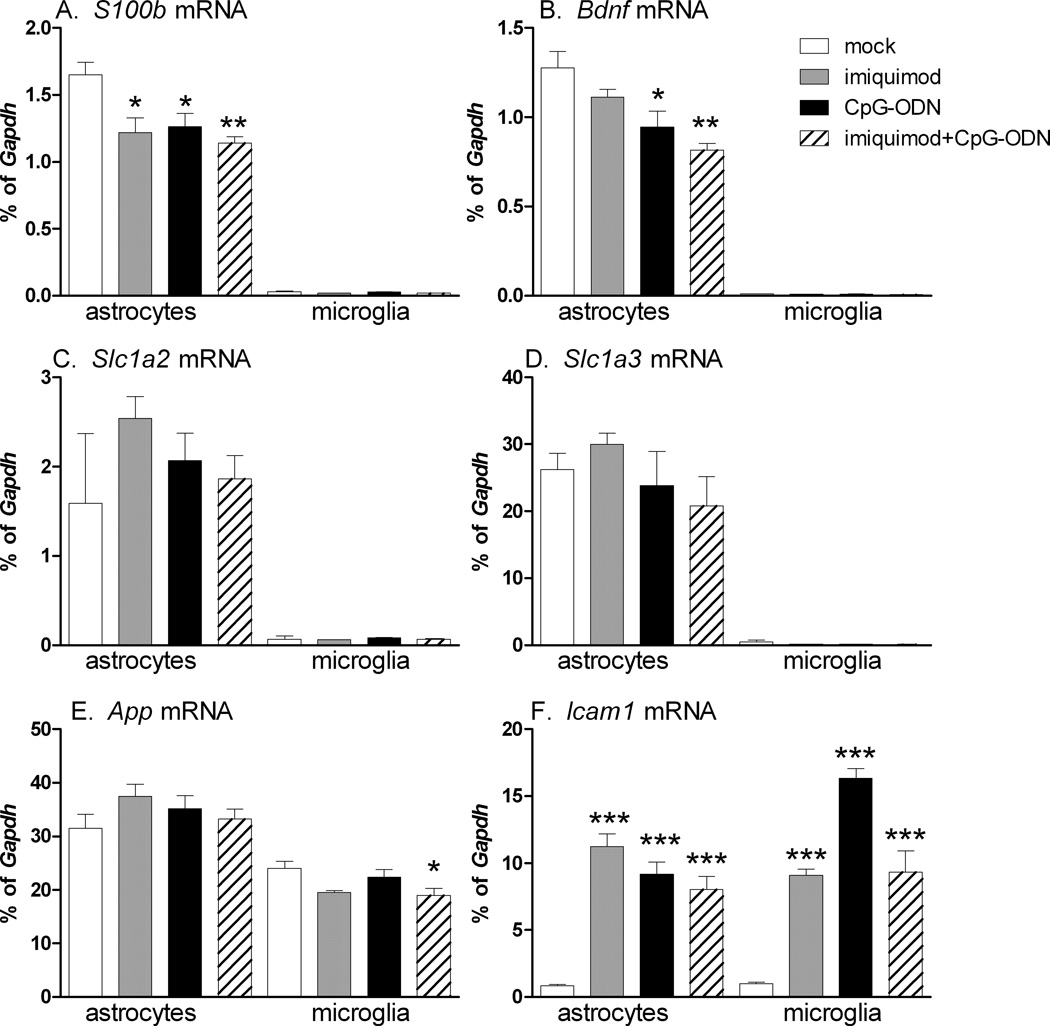
Since astrocytes function as support cells for neurons, we examined whether TLR7 agonist or TLR9 agonist stimulation altered the mRNA expression of non-immune genes that can affect neuropathogenesis. A significant difference was noted in the expression of S100b and/or brain derived neurotrophic factor (Bdnf) mRNA expression following TLR7 and/or TLR9 agonist stimulation of astrocytes (Fig. 3), however, the level of downregulation was less than two fold. The expression of other genes including the glutamate scavenging receptors, Slc1a2 and Slc1a3, were not altered by TLR agonist stimulation. Expression of genes whose products are involved in protein-aggregation-related diseases such as the amyloid beta precursor protein or prion protein were also not altered by TLR agonist stimulation (Fig. 3E, data not shown). Thus, TLR7 and TLR9 agonist stimulation did not appear to substantially alter the mRNA expression of neuronal support-related genes in astrocytes. In contrast, mRNA for Icam1, an adhesion molecule, was upregulated by both TLR agonists (Fig. 3F).
Fig. 3. Influence of imiquimod or CpG-ODN or costimulation in astrocytes and microglia on the mRNA expression of (A) S100b, (B) Brain-derived neurotrophic factor (Bdnf), glutamate transporters (C) Slc1a2, (D) Slc1a3, (E) amyloid precursor protein (App) and (F) adhesion molecule (Icam1).
Cultured astrocytes and microglia were stimulated with 5 µM imiquimod or 80 nM CpG-ODN 1826 or both. At 6 hps, RNA was isolated, processed and analyzed by realtime RT PCR. Gene expression values were calculated as a percentage of Gapdh mRNA expression per sample. Data are the mean +/− SEM of three samples per group. Statistical analysis was completed by one-way ANOVA with Bonferroni post test. * P<0.05, ** p<0.01 and *** p< 0.001. Asterisks above bars indicated a significant upregulation compared to mock-treated controls. Data are representative of two replicate experiments.
Cytokine and chemokine production by astrocytes and microglia following TLR7/9 stimulation
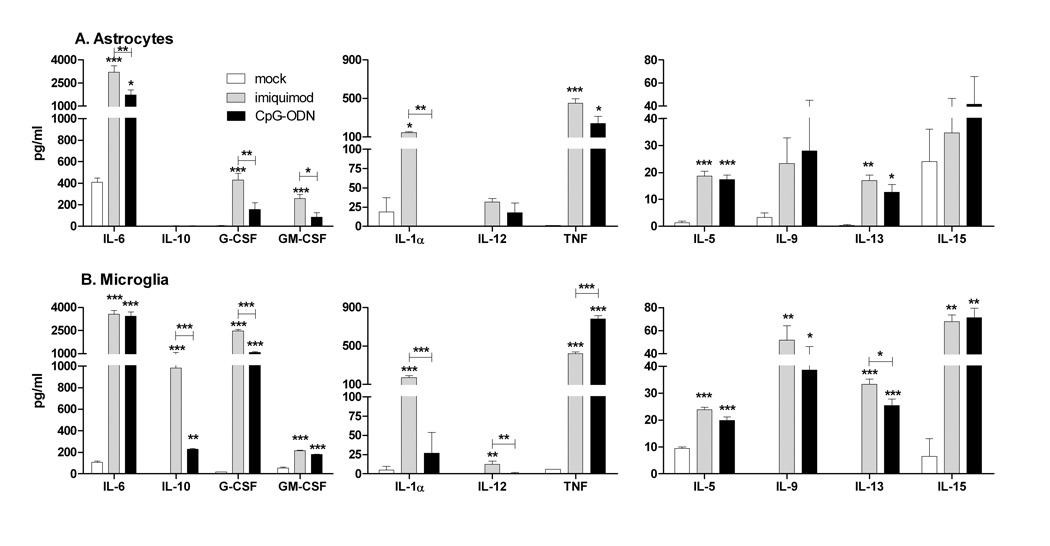
Astrocytes and microglia often produce different cytokines during virus infections. However, it is unclear whether this difference is due to the infection/stimuli or different responses of the cells to the same stimuli. Analysis of supernatants from astrocytes and microglia stimulated with either imiquimod or CpG-ODN demonstrated that TLR7 or TLR9 activation of glial cells induced a pronounced upregulation of proinflammatory cytokines including cytokines normally associated with virus infections in the CNS such as IL-6 and TNF (Fig. 4). Interestingly, microglia also produced high levels of granulocyte colony stimulating factor (G-CSF) and IL-9, two cytokines that have anti-apoptotic, neuroprotective properties (Fontaine et al., 2008; Pitzer et al., 2008), as well as IL-15, which induces glial activation (Gomez-Nicola et al., 2008), and IL-10, an anti-inflammatory cytokine. This demonstrates a difference in the cytokine response of microglia and astrocytes to the same stimuli, with microglia producing high levels of both proinflammatory and antiinflammatory/neuroprotective cytokines, while astrocytes produced primarily proinflammatory cytokines.
Fig. 4. Comparison of cytokine protein production by (A) astrocytes and (B) microglia stimulated with imiquimod or CpG-ODN.
Cultured astrocytes and microglia were stimulated with mock or 5 µM imiquimod or 80 nM CpG-ODN 1826 for 12 hours. Supernatants were analyzed for cytokine protein production by multiplex bead array or by ELISA assay. Samples were calculated as pg/ml using a standard curve from in-plate standards. Data are the mean +/− SEM of 3 samples per group. Statistical analysis was completed by one-way ANOVA with Bonferroni post test. * P<0.05, ** p<0.01 and *** p< 0.001. Asterisks above bars indicated a significant upregulation compared to mock-treated controls. Lines with asterisks above the lines indicate the difference between the indicated groups. Data are representative of two replicate experiments.
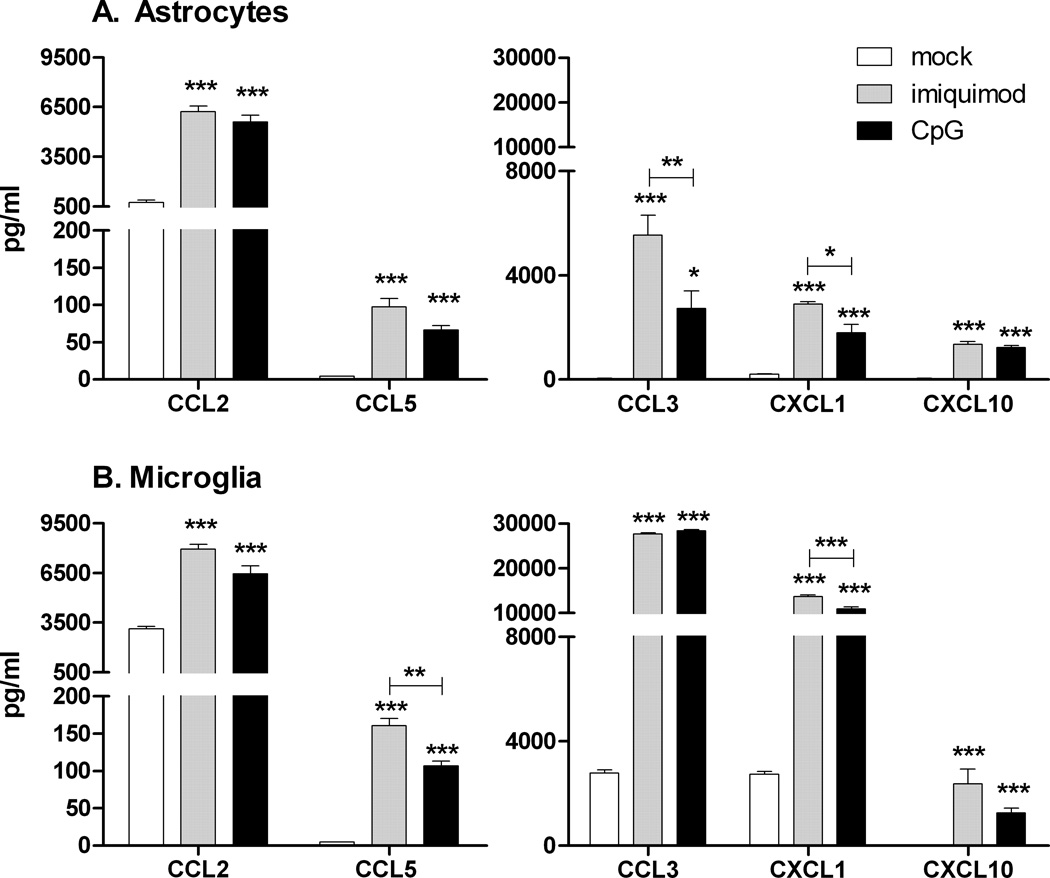
Chemokine production by astrocytes and microglia plays an important role in regulating the recruitment of inflammatory cells to the CNS following infection or injury. Both astrocytes and microglia produced a number of chemokines following stimulation with either imiquimod or CpG-ODN (Fig. 5). Microglia, which had higher basal level production of most chemokines, were induced to produce higher levels of chemokine production than astrocytes. For cytokine and chemokine production, stimulation of either cell type with the TLR7 agonist appeared to induce a slightly higher level of protein production than stimulation with the TLR9 agonist (Fig. 4, 5).
Fig. 5. Comparison of chemokine protein production by (A) astrocytes and (B) microglia stimulated with imiquimod or CpG-ODN.
Cultured astrocytes and microglia were stimulated with 5 µM imiquimod or 80 nM CpG-ODN 1826 for 12 hours and supernatants were analyzed as described in Fig 4. Data are the mean +/− SEM of 3 samples per group. Statistical analysis was completed as described in Fig. 4. Data are representative of two replicate experiments.
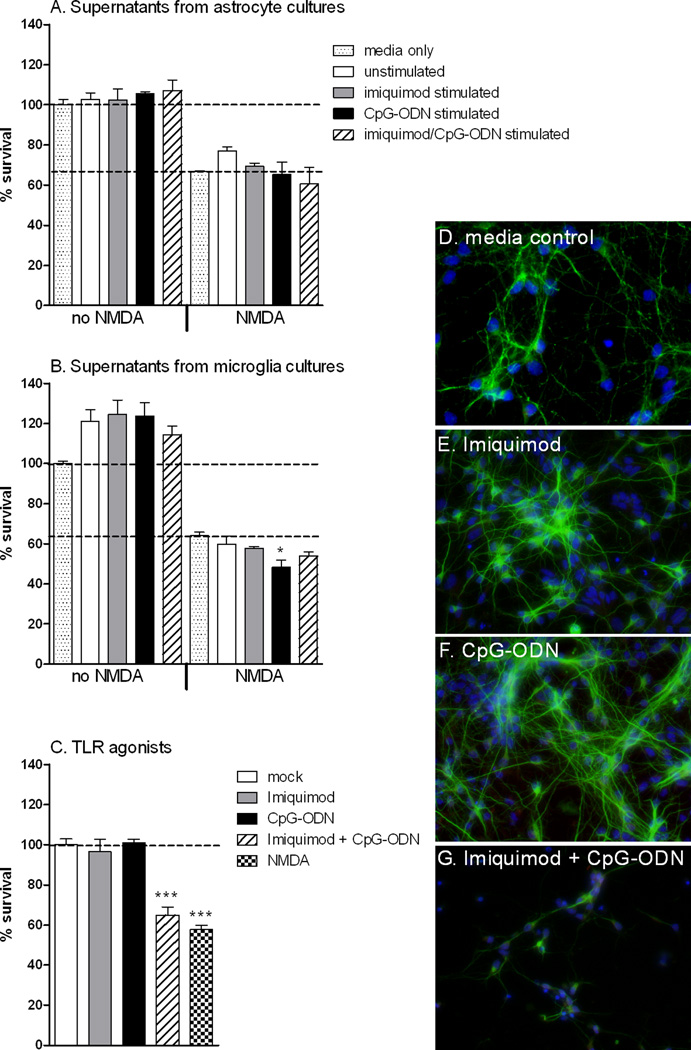
To examine whether the secreted proteins produced by microglia or astrocytes had any effect on neuronal survival, supernatants from TLR7 and TLR9 stimulated astrocytes and microglia were overlaid on primary cortical neurons either in the presence or absence of NMDA and neuronal survival measured by MTT assay at 72 hours post stimulation. Neurons cultured with the media used for either microglia or astrocyte cultures were used as controls. Supernatants from TLR7 or TLR9 stimulated astrocytes and microglia had no substantial effect compared to supernatants from unstimulated cells (Fig. 6A,B), although there was a slight decrease in neuronal survival with neurons cultured with NMDA and supernatant from TLR9 stimulated neurons (Fib. 6B). Supernatants from cells stimulated with both TLR7 and TLR9 agonists also had no substantial effect on neuronal survival.
Fig. 6. Effect of TLR7 and TLR9 stimulated supernatants from astrocyte and microglia cultures, and the ligands on primary cortical neuron cultures.
Cortical neurons were cultured for 4 hours following isolation and then cultured with media containing a 1:1 ratio of neurobasal media, containing all neuron growth factors, and supernatants from either (A) astrocyte or (B) microglia cultures in the presence or absence of NMDA. (C–H) Neurons were stimulated with 5 µM imiquimod or 80 nM CpG-ODN 1826 and/or NMDA as described in methods. Neuron cultures were incubated for 72 h and cell survival was measured by (A–C) MTT assay or (D–G) immunofluorescence staining for β-tubulin. Data are the mean +/− SEM of three to four samples per group. Statistical analysis was completed by one-way ANOVA with Dunnett’s multiple comparison test with mock controls. * P<0.05, *** p< 0.001. Asterisks above bars indicated a significant upregulation compared to mock-treated controls. Data are representative of two replicate experiments.
To rule out any possible affect of the agonists present in the cultured supernatant from stimulated microglia and astrocytes, we also stimulated neuronal cultures directly with 5 µM of Imiquimod and/or 80 nM of CpG-ODN (Fig. 6C). Interestingly, direct co-stimulation of neurons with imiquimod and CpG-ODN induced neuronal cell death similar to NMDA-induced death. This suggests a synergistic affect of TLR7 and TLR9 agonist stimulation on neurons (Fig. 6C, G). This was surprising as costimulation with TLR7 and TLR9 agonists did not induce cell death in either astrocytes or microglia cultures (data not shown).
TLR7 agonist can inhibit TLR9 agonist stimulation in a concentration dependent manner
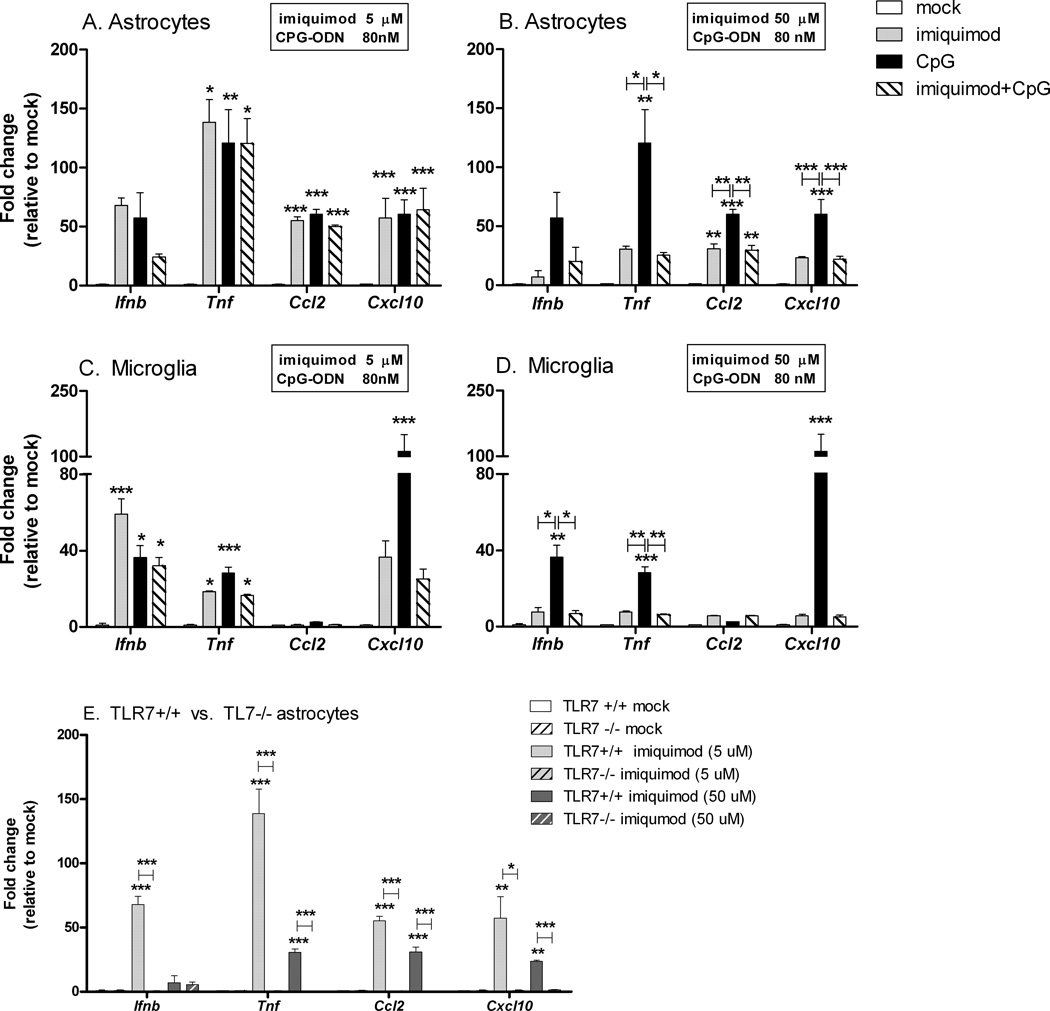
Natural and synthetic TLR7 ligands were reported to inhibit CpG-ODN induced IFNα production from plasmacytoid dendritic cells and B cells following TLR7/TLR9 co-stimulation (Berghofer et al., 2007; Marshall et al., 2007). Comparison of the fold increase in mRNA expression of innate immune response genes in astrocytes and microglia demonstrated only minimal suppression by imiquimod on CpG-ODN-induced responses when both agonists were added together (Table II, Fig. 7A,C). To examine if a higher concentration of imiquimod was inhibitory to CpG-ODN induced responses, a higher concentration of 50 µM was used in costimulation experiment. The high dose of 50 µM was inhibitory to CpG-ODN induced cytokine and chemokine production (Fig. 7B,D). This inhibition was not due to cell death as all cultures had comparable numbers of live cells as determined by an MTT cell viability assay (data not shown).
Fig. 7. Costimulation with TLR7/TLR9 agonists inhibits TLR9 induced cytokine and chemokine mRNA expression in astrocytes and microglia.
Cultured (A,B,E) astrocytes and (C,D) microglia were stimulated with either (A,C, E) 5 µM imiquimod or (B,D,E) 50 µM imiquimod and/or (A–D) 80 nM CpG-ODN 1826. (E) Stimulation of astrocytes generated from wildtype (TLR7+/+) and TLR7 deficient (TLR7−/−) mice to verify specificity of both concentrations of imiquimod. At 6 hps, RNA was isolated from all samples and processed for quantitative realtime RT-PCR. Samples were analyzed as described in Fig. 2. Data are the mean +/− SEM of 3–6 samples per group and present the combined data from two independent experiments. Statistical analysis was completed as described in Fig. 4.
The stimulatory capability of certain TLR agonists can decline when used at high concentrations (Gorden et al., 2005; Marshall et al., 2007). Since the 50 µM concentration of imiquimod induced lower cytokine and chemokine responses than the 5 µM concentration of imiquimod (Fig.7), we verified that both concentrations induced cytokine production through a TLR7-dependent mechanism. TLR7 was necessary for cytokine and chemokine responses at both 5 µM and 50 µM concentrations in astrocyte cultures (Fig. 7E). Specificity of the response in microglia was not analyzed since the 50 µM concentration of imiquimod did not induce a significant response in these cells.
TLR7 agonist inhibition of TLR9 agonist-induced responses is not TLR7 dependent
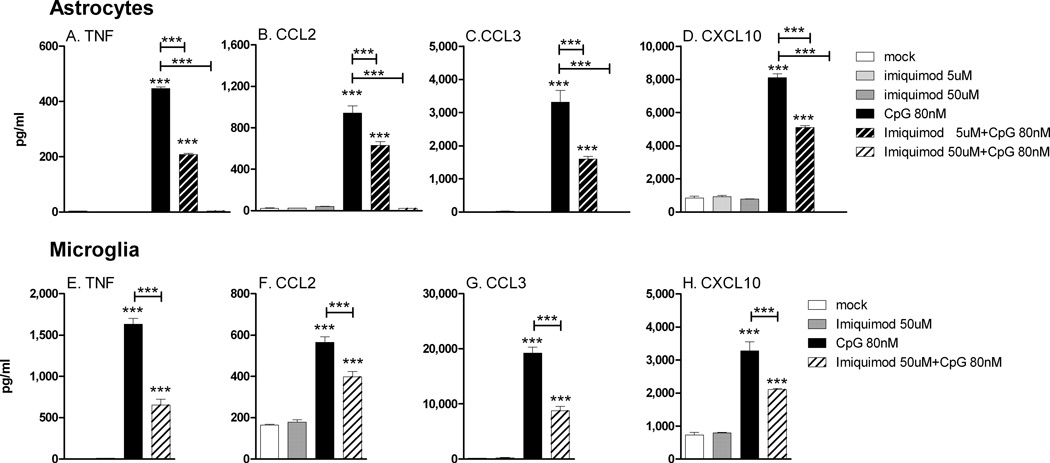
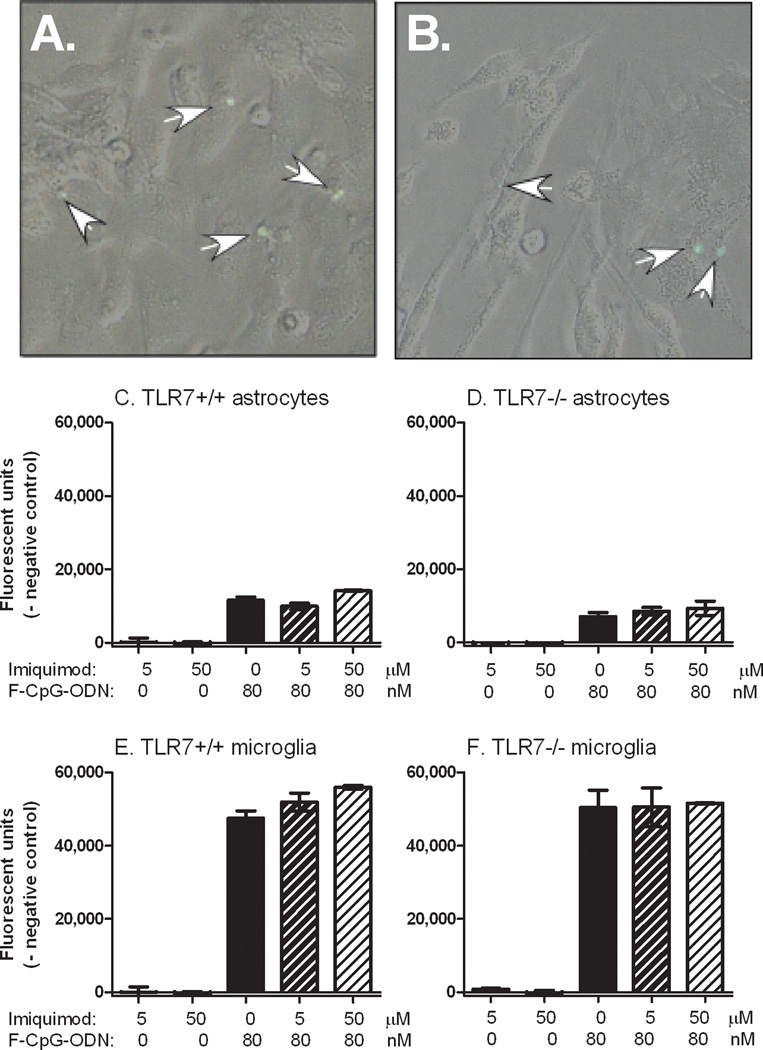
To examine the mechanism by which high concentrations of imiquimod suppressed CpG-ODN responses, we first analyzed whether TLR7 signaling was required for this inhibition. Interestingly, imiquimod suppressed CpG-ODN induced cytokine and chemokine production in glial cells from TLR7 deficient mice (Fig. 8). Thus, imiquimod suppression of CpG-ODN was not mediated by signaling of TLR7. We next examined whether imiquimod could be inhibiting the uptake of CpG-ODN by astrocytes or microglia. Cell entry analysis using FITC-labeled CpG-ODN demonstrated that CpG-ODN was taken up by both astrocytes and microglia at similar levels in the presence or absence of imiquimod (Fig. 9A–F). Thus, imiquimod inhibits CpG-ODN by a mechanism independent of either TLR7 signaling or cell entry. Instead, this suppression could be mediated by other mechanisms, including the possibility that high concentrations of imiquimod may interfere with CpG-ODN binding to TLR9.
Fig. 8. TLR7 is not necessary for TLR7 agonist inhibition of TLR9-induced cytokine responses in (A–D) astrocytes or (E–H) microglia cultures.
Astrocyte and microglia cultures from TLR7 deficient mice were stimulated with TLR7 and/or TLR9 agonists for 12h as shown in the figure and the supernatants were analyzed as described in Fig 4. Data are the mean +/− SEM of 3 samples per group. Statistical analysis was completed as described in Fig. 4. Data are representative of two replicate experiments.
Fig. 9. TLR7 agonists do not inhibit the endocytosis of FITC labeled CpG-ODN into astrocytes or microglia.
Astrocyte and microglia cultures at near confluency were incubated with 80 nM of FITC-labeled CpG-ODN and/or 5 to 50 µM of imiquimod for 30 min, and then washed extensively with PBS to remove unbound or non-internalized FITC-CpG ODN. FITC was detected in the cells of both (A) astrocytes and (B) microglia cultures (indicated by white arrows). Cells were then lysed and the level of fluorescence was measured using a microplate reader. Fluorescence levels in unstimulated astrocytes and microglia were used as a baseline for each culture. Data are the average of 3 wells per group for (C–D) astrocytes or (E–F) microglia cultures generated from (A–C,E) wildtype or (D,F) TLR7 deficient mice.
Negative influence of TLR7 on CpG-ODN induced responses in microglia
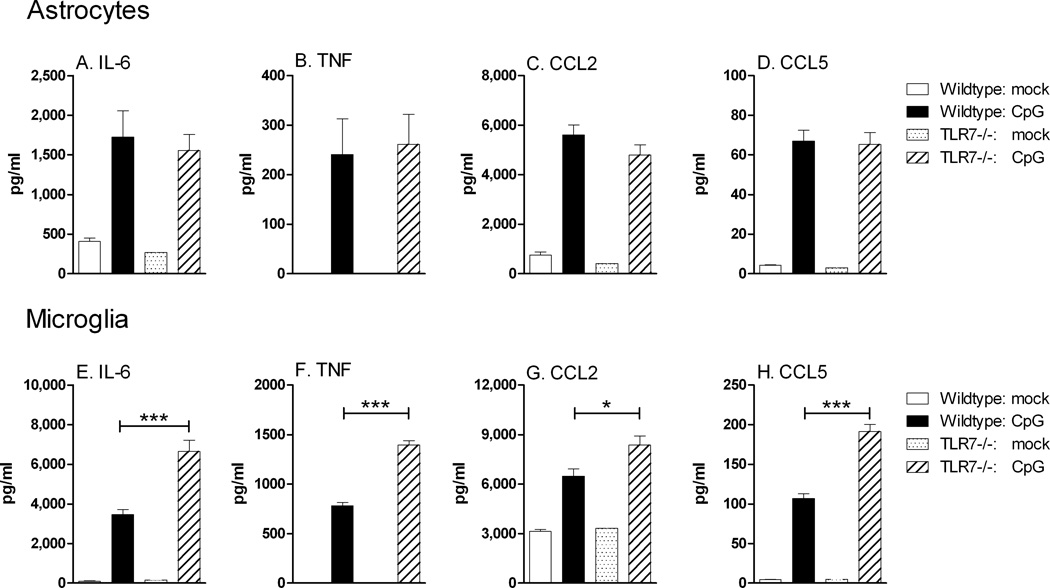
To examine whether TLR7 also impacted CpG-ODN stimulation, we examined the influence of TLR7 deficiency on CpG-ODN stimulation of glial cells. TLR7 deficiency had no effect on CpG-ODN induced cytokine stimulation by astrocytes (Fig. 10 A–D). However, an increase in cytokine production was observed in TLR7-deficient microglia stimulated with CpG-ODN compared to wildtype microglia (Fig. 10 E–H). Thus, both TLR7 agonists and TLR7, itself, have a suppressive effect on CpG-ODN induced cytokine production by microglia.
Fig. 10. Effect of TLR7 deficiency on TLR9 induced cytokine and chemokine production. (A–D).
Astrocyte and (E–F) microglia cultures from wild type and TLR7 deficient mice were stimulated with mock control or 80 nM of CpG-ODN 1826 for 12h and the supernatants were analyzed as described in Fig 4. Data are the mean +/− SEM of 3 samples per group. Statistical analysis was completed as described in Fig. 4. Data are representative of two replicate experiments.
Discussion
In the current study, astrocytes and microglia expressed both TLR7 and TLR9 and produced a functional response to TLR7 and TLR9 agonist stimulation. Interestingly, the cytokine profile produced by agonist stimulation was similar between the type of TLR stimulation, but varied between cell types. Microglia, but not astrocytes produced anti-inflammatory and anti-apoptotic cytokines in addition to pro-inflammatory cytokines (Fig. 4). However, astrocytes upregulated mRNA expression of a greater number of innate immune response genes than microglia including genes whose proteins are involved in signal transduction responses (Fig. 2). Since astrocytes are not derived from an immune cell lineage, these cells may upregulate the expression of signal transduction proteins when they become activated in order to allow them to respond to innate immune stimuli. The differences in the response between astrocytes and microglia also indicate that the astrocytic response is not due to a contamination of microglia cells. The kinetics of gene expression may also vary between microglia and astrocytes. Although similar kinetics were observed in gene expression between microglia and astrocytes for Ccl2, Cxcl10 and Tnf (data not shown), the expression of other genes in the innate immune response may differ. The current study only analyzed a single time point and it is possible that there are fluctuations in other gene expression at earlier or later time points.
TNF, at concentrations higher than 200 pg/ml can be neurotoxic (Gelbard et al., 1993; Westmoreland et al., 1996). Surprisingly, supernatants from neither activated microglia nor activated astrocytes altered neuronal survival, despite high levels of TNF (Fig. 6). Previous studies have demonstrated that CpG-ODN activation of co-cultured microglia and neurons can induce neuronal toxicity, mediated in part by TNF (Iliev et al., 2004). The inability of supernatants from CpG-ODN activated microglia to induce neurotoxicity suggests that cell to cell interactions may also be a necessary component of microglia-induced neuronal cell death and that other cytokines induced by TLR activation may counteract the neurotoxic effects of TNF.
A few discrepancies were observed between mRNA expression and protein production in astrocytes and microglia in this study. For example, Il10 mRNA was upregulated by TLR7/9 agonist stimulation in both astrocytes and microglia; however, IL-10 protein was only detected in culture supernatants from microglia. Tnf mRNA levels were substantially higher in astrocytes, but protein levels were either similar or higher in microglia. Both IL-10 and TNF are regulated post-transcriptionally which may influence the secretion of the protein in one cell type versus another (Pauli, 1994; Powell et al., 2000). Possibly, microglia may be able to translate these cytokine mRNA into functional proteins at a higher rate than astrocytes, resulting in higher protein production despite lower mRNA expression.
High concentrations of imiquimod inhibited CpG-ODN induced responses in both microglia and astrocyte cultures (Fig. 7). Suppression of TLR9 ligand-induced interferon responses by both natural and synthetic agonists have previously been shown for both plasmacytoid dendritic cells and B cells (Berghofer et al., 2007; Marshall et al., 2007). However, the mechanism behind this suppression was not known. Our current results indicate that the mechanism behind this suppression is not due to a feedback mechanism by TLR7 signaling (Fig. 8). It is possible that the mechanism of suppression is due to an interaction between TLR7 and TLR9 agonists, with imiquimod interacting with CpG-ODN and preventing binding of CpG-ODN to TLR9. Alternatively, high concentrations of imiquimod may allow imiquimod to interact directly with TLR9, thus inhibiting the binding of CpG-ODN to TLR9. In both scenarios, the inhibition would be concentration dependent and would explain why 50 µM concentrations of imiquimod suppress CpG-ODN stimulation to a greater extent than 5 µM (Figs. 7 & 8).
In contrast to the inhibitory effect of imiquimod on CpG-ODN induced responses in astrocytes and microglia, the combination of TLR7 and TLR9 agonists had a synergistic effect on neuronal death (Fig. 6). Neither TLR7 nor TLR9 agonists alone affected neuronal survival, which is similar to previous reports (Iliev et al., 2004; Ma et al., 2006). However, the combination of TLR7 and TLR9 agonists together was neurotoxic as determined by MTT assay as well as β-tubulin staining (Fig. 6). Primary mouse neurons do not express TLR7 (Ma et al., 2006). One possible explanation is that the combination of TLR7 and TLR9 agonists altered the binding of CpG-ODN to TLR9 and induced an altered response that lead to cell death. Alternatively, the combination of CpG-ODN and imiquimod may have activated TLR8, as TLR8 activation can induce caspase 3-induced death in neurons (Ma et al., 2006). Oligonucleotides have been shown to enhance binding of TLR7/8 agonists to the TLR8, while inhibiting signaling to TLR7 in HEK cells (Gorden et al., 2006b; Gorden et al., 2006a).
Although TLR7 did not have a direct role in imiquimod-mediated inhibition of CpG-ODN induced responses in glial cells, TLR7 does appear to have a direct suppressive effect on TLR9-induced responses. Microglia, but not astrocytes, from TLR7 deficient mice had higher levels of cytokine production following CpG-ODN stimulation compared to microglia from wildtype mice (Fig. 9). Since the expression of TLR7 can influence the response of microglia to TLR9 agonist, the level of TLR7 expression may have mediating role in the innate immune response to TLR9 agonist-expressing pathogens. This difference in response by microglia was surprising since human embryonic kidney (HEK) cells transfected with both TLR7 and TLR9 demonstrated a TLR9-mediated inhibition of TLR7 agonist-induced responses, but not a TLR7-mediated inhibition of TLR9 agonist-induced responses (Wang et al., 2006). Possibly, there is a distinct interaction between TLR7 and TLR9 regulation in different cell types. TLR7 and TLR9 compete for binding of the Ubiquitin protein, Unc93b1, which regulates the migration of these receptors from the endoplasmic reticulum to the endolysosome (Fukui et al., 2009). The expression level of UNC93b1 or MyD88, the signal transduction molecule associated with both TLR7 and TLR9, in an individual cell may regulate the interactions between these two receptors.
Acknowledgements
We would like to thank Susan Pourciau, Bruce Chesebro, Kim Hasenkrug, Jim Striebel and Leonard Evans for critical reading of the manuscript. We would also like to thank Aaron Carmody for technical assistance with flow cytometry. This work was supported in part by the Intramural Research Program of the NIH and in part by National Center for Research Resources Grant IP20RR020159
References
- Asensio VC, Campbell IL. Chemokine gene expression in the brains of mice with lymphocytic choriomeningitis. J Virol. 1997;71:7832–7840. doi: 10.1128/jvi.71.10.7832-7840.1997. [DOI] [PMC free article] [PubMed] [Google Scholar]
- Beignon AS, McKenna K, Skoberne M, Manches O, DaSilva I, Kavanagh DG, Larsson M, Gorelick RJ, Lifson JD, Bhardwaj N. Endocytosis of HIV-1 activates plasmacytoid dendritic cells via Toll-like receptor-viral RNA interactions. J Clin Invest. 2005;115:3265–3275. doi: 10.1172/JCI26032. [DOI] [PMC free article] [PubMed] [Google Scholar]
- Berghofer B, Haley G, Frommer T, Bein G, Hackstein H. Natural and synthetic TLR7 ligands inhibit CpG-A- and CpG-C-oligodeoxynucleotide-induced IFN-alpha production. J Immunol. 2007;178:4072–4079. doi: 10.4049/jimmunol.178.7.4072. [DOI] [PubMed] [Google Scholar]
- Bowman CC, Rasley A, Tranguch SL, Marriott I. Cultured astrocytes express toll-like receptors for bacterial products. Glia. 2003;43:281–291. doi: 10.1002/glia.10256. [DOI] [PubMed] [Google Scholar]
- Butchi NB, Pourciau S, Du M, Morgan TW, Peterson KE. Analysis of the neuroinflammatory response to TLR7 stimulation in the brain: comparison of multiple TLR7 and/or TLR8 agonists. J Immunol. 2008;180:7604–7612. doi: 10.4049/jimmunol.180.11.7604. [DOI] [PubMed] [Google Scholar]
- Carpentier PA, Begolka WS, Olson JK, Elhofy A, Karpus WJ, Miller SD. Differential activation of astrocytes by innate and adaptive immune stimuli. Glia. 2005;49:360–374. doi: 10.1002/glia.20117. [DOI] [PubMed] [Google Scholar]
- Cheeran MC, Hu S, Yager SL, Gekker G, Peterson PK, Lokensgard JR. Cytomegalovirus induces cytokine and chemokine production differentially in microglia and astrocytes: antiviral implications. J Neurovirol. 2001;7:135–147. doi: 10.1080/13550280152058799. [DOI] [PubMed] [Google Scholar]
- Dalpke AH, Schafer MK, Frey M, Zimmermann S, Tebbe J, Weihe E, Heeg K. Immunostimulatory CpG-DNA activates murine microglia. J Immunol. 2002;168:4854–4863. doi: 10.4049/jimmunol.168.10.4854. [DOI] [PubMed] [Google Scholar]
- Dickson DW, Lee SC, Mattiace LA, Yen SH, Brosnan C. Microglia and cytokines in neurological disease, with special reference to AIDS and Alzheimer's disease. Glia. 1993;7:75–83. doi: 10.1002/glia.440070113. [DOI] [PubMed] [Google Scholar]
- El Andaloussi A, Sonabend AM, Han Y, Lesniak MS. Stimulation of TLR9 with CpG ODN enhances apoptosis of glioma and prolongs the survival of mice with experimental brain tumors. Glia. 2006;54:526–535. doi: 10.1002/glia.20401. [DOI] [PubMed] [Google Scholar]
- Fontaine RH, Cases O, Lelievre V, Mesples B, Renauld JC, Loron G, Degos V, Dournaud P, Baud O, Gressens P. IL-9/IL-9 receptor signaling selectively protects cortical neurons against developmental apoptosis. Cell Death Differ. 2008;15:1542–1552. doi: 10.1038/cdd.2008.79. [DOI] [PubMed] [Google Scholar]
- Fukui R, Saitoh SI, Matsumoto F, Kozuka-Hata H, Oyama M, Tabeta K, Beutler B, Miyake K. Unc93B1 biases Toll-like receptor responses to nucleic acid in dendritic cells toward DNA- but against RNA-sensing. J Exp Med. 2009 doi: 10.1084/jem.20082316. [DOI] [PMC free article] [PubMed] [Google Scholar]
- Gelbard HA, Dzenko KA, DiLoreto D, del Cerro C, del Cerro M, Epstein LG. Neurotoxic effects of tumor necrosis factor alpha in primary human neuronal cultures are mediated by activation of the glutamate AMPA receptor subtype: implications for AIDS neuropathogenesis. Dev Neurosci. 1993;15:417–422. doi: 10.1159/000111367. [DOI] [PubMed] [Google Scholar]
- Gomez-Nicola D, Valle-Argos B, Pita-Thomas DW, Nieto-Sampedro M. Interleukin 15 expression in the CNS: blockade of its activity prevents glial activation after an inflammatory injury. Glia. 2008;56:494–505. doi: 10.1002/glia.20628. [DOI] [PubMed] [Google Scholar]
- Gorden KB, Gorski KS, Gibson SJ, Kedl RM, Kieper WC, Qiu X, Tomai MA, Alkan SS, Vasilakos JP. Synthetic TLR agonists reveal functional differences between human TLR7 and TLR8. J Immunol. 2005;174:1259–1268. doi: 10.4049/jimmunol.174.3.1259. [DOI] [PubMed] [Google Scholar]
- Gorden KK, Qiu X, Battiste JJ, Wightman PP, Vasilakos JP, Alkan SS. Oligodeoxynucleotides differentially modulate activation of TLR7 and TLR8 by imidazoquinolines. J Immunol. 2006a;177:8164–8170. doi: 10.4049/jimmunol.177.11.8164. [DOI] [PubMed] [Google Scholar]
- Gorden KK, Qiu XX, Binsfeld CC, Vasilakos JP, Alkan SS. Cutting edge: activation of murine TLR8 by a combination of imidazoquinoline immune response modifiers and polyT oligodeoxynucleotides. J Immunol. 2006b;177:6584–6587. doi: 10.4049/jimmunol.177.10.6584. [DOI] [PubMed] [Google Scholar]
- Griffin DE. Immune responses to RNA-virus infections of the CNS. Nat Rev Immunol. 2003;3:493–502. doi: 10.1038/nri1105. [DOI] [PMC free article] [PubMed] [Google Scholar]
- Gurley C, Nichols J, Liu S, Phulwani NK, Esen N, Kielian T. Microglia and Astrocyte Activation by Toll-Like Receptor Ligands: Modulation by PPAR-gamma Agonists. PPAR Res. 2008;2008:453120. doi: 10.1155/2008/453120. [DOI] [PMC free article] [PubMed] [Google Scholar]
- Hemmi H, Kaisho T, Takeuchi O, Sato S, Sanjo H, Hoshino K, Horiuchi T, Tomizawa H, Takeda K, Akira S. Small anti-viral compounds activate immune cells via the TLR7 MyD88-dependent signaling pathway. Nat Immunol. 2002;3:196–200. doi: 10.1038/ni758. [DOI] [PubMed] [Google Scholar]
- Hosoi T, Suzuki S, Nomura J, Ono A, Okuma Y, Akira S, Nomura Y. Bacterial DNA induced iNOS expression through MyD88-p38 MAP kinase in mouse primary cultured glial cells. Brain Res Mol Brain Res. 2004;124:159–164. doi: 10.1016/j.molbrainres.2004.02.014. [DOI] [PubMed] [Google Scholar]
- Iliev AI, Stringaris AK, Nau R, Neumann H. Neuronal injury mediated via stimulation of microglial toll-like receptor-9 (TLR9) FASEB J. 2004;18:412–414. doi: 10.1096/fj.03-0670fje. [DOI] [PubMed] [Google Scholar]
- Lewis SD, Butchi NB, Khaleduzzaman M, Morgan TW, Du M, Pourciau S, Baker DG, Akira S, Peterson KE. Toll-like receptor 7 is not necessary for retroviral neuropathogenesis but does contribute to virus-induced neuroinflammation. J Neurovirol. 2008;14:492–502. doi: 10.1080/13550280802345723. [DOI] [PubMed] [Google Scholar]
- Ma Y, Li J, Chiu I, Wang Y, Sloane JA, Lu J, Kosaras B, Sidman RL, Volpe JJ, Vartanian T. Toll-like receptor 8 functions as a negative regulator of neurite outgrowth and inducer of neuronal apoptosis. J Cell Biol. 2006;175:209–215. doi: 10.1083/jcb.200606016. [DOI] [PMC free article] [PubMed] [Google Scholar]
- Mandl JN, Barry AP, Vanderford TH, Kozyr N, Chavan R, Klucking S, Barrat FJ, Coffman RL, Staprans SI, Feinberg MB. Divergent TLR7 and TLR9 signaling and type I interferon production distinguish pathogenic and nonpathogenic AIDS virus infections. Nat Med. 2008;14:1077–1087. doi: 10.1038/nm.1871. [DOI] [PubMed] [Google Scholar]
- Marshall JD, Heeke DS, Gesner ML, Livingston B, Van Nest G. Negative regulation of TLR9-mediated IFN-alpha induction by a small-molecule, synthetic TLR7 ligand. J Leukoc Biol. 2007;82:497–508. doi: 10.1189/jlb.0906575. [DOI] [PubMed] [Google Scholar]
- McKimmie CS, Fazakerley JK. In response to pathogens, glial cells dynamically and differentially regulate Toll-like receptor gene expression. J Neuroimmunol. 2005;169:116–125. doi: 10.1016/j.jneuroim.2005.08.006. [DOI] [PubMed] [Google Scholar]
- Pauli U. Control of tumor necrosis factor gene expression. Crit Rev Eukaryot Gene Expr. 1994;4:323–344. doi: 10.1615/critreveukargeneexpr.v4.i2-3.20. [DOI] [PubMed] [Google Scholar]
- Pedras-Vasconcelos JA, Goucher D, Puig M, Tonelli LH, Wang V, Ito S, Verthelyi D. CpG oligodeoxynucleotides protect newborn mice from a lethal challenge with the neurotropic Tacaribe arenavirus. J Immunol. 2006;176:4940–4949. doi: 10.4049/jimmunol.176.8.4940. [DOI] [PubMed] [Google Scholar]
- Pedras-Vasconcelos JA, Puig M, Sauder C, Wolbert C, Ovanesov M, Goucher D, Verthelyi D. Immunotherapy with CpG oligonucleotides and antibodies to TNF-alpha rescues neonatal mice from lethal arenavirus-induced meningoencephalitis. J Immunol. 2008;180:8231–8240. doi: 10.4049/jimmunol.180.12.8231. [DOI] [PubMed] [Google Scholar]
- Peterson KE, Errett JS, Wei T, Dimcheff DE, Ransohoff R, Kuziel WA, Evans L, Chesebro B. MCP-1 and CCR2 contribute to non-lymphocyte-mediated brain disease induced by Fr98 polytropic retrovirus infection in mice: role for astrocytes in retroviral neuropathogenesis. J Virol. 2004;78:6449–6458. doi: 10.1128/JVI.78.12.6449-6458.2004. [DOI] [PMC free article] [PubMed] [Google Scholar]
- Pitzer C, Kruger C, Plaas C, Kirsch F, Dittgen T, Muller R, Laage R, Kastner S, Suess S, Spoelgen R, Henriques A, Ehrenreich H, Schabitz WR, Bach A, Schneider A. Granulocyte-colony stimulating factor improves outcome in a mouse model of amyotrophic lateral sclerosis. Brain. 2008;131:3335–3347. doi: 10.1093/brain/awn243. [DOI] [PMC free article] [PubMed] [Google Scholar]
- Powell MJ, Thompson SA, Tone Y, Waldmann H, Tone M. Posttranscriptional regulation of IL-10 gene expression through sequences in the 3'-untranslated region. J Immunol. 2000;165:292–296. doi: 10.4049/jimmunol.165.1.292. [DOI] [PubMed] [Google Scholar]
- Prins RM, Craft N, Bruhn KW, Khan-Farooqi H, Koya RC, Stripecke R, Miller JF, Liau LM. The TLR-7 agonist, imiquimod, enhances dendritic cell survival and promotes tumor antigen-specific T cell priming: relation to central nervous system antitumor immunity. J Immunol. 2006;176:157–164. doi: 10.4049/jimmunol.176.1.157. [DOI] [PubMed] [Google Scholar]
- Sauder C, Hallensleben W, Pagenstecher A, Schneckenburger S, Biro L, Pertlik D, Hausmann J, Suter M, Staeheli P. Chemokine gene expression in astrocytes of Borna disease virus-infected rats and mice in the absence of inflammation. J Virol. 2000;74:9267–9280. doi: 10.1128/jvi.74.19.9267-9280.2000. [DOI] [PMC free article] [PubMed] [Google Scholar]
- Sorensen LN, Reinert LS, Malmgaard L, Bartholdy C, Thomsen AR, Paludan SR. TLR2 and TLR9 synergistically control herpes simplex virus infection in the brain. J Immunol. 2008;181:8604–8612. doi: 10.4049/jimmunol.181.12.8604. [DOI] [PubMed] [Google Scholar]
- Town T, Bai F, Wang T, Kaplan AT, Qian F, Montgomery RR, Anderson JF, Flavell RA, Fikrig E. Toll-like receptor 7 mitigates lethal West Nile encephalitis via interleukin 23-dependent immune cell infiltration and homing. Immunity. 2009;30:242–253. doi: 10.1016/j.immuni.2008.11.012. [DOI] [PMC free article] [PubMed] [Google Scholar]
- Wang J, Shao Y, Bennett TA, Shankar RA, Wightman PD, Reddy LG. The functional effects of physical interactions among Toll-like receptors 7, 8, and 9. J Biol Chem. 2006;281:37427–37434. doi: 10.1074/jbc.M605311200. [DOI] [PubMed] [Google Scholar]
- Westmoreland SV, Kolson D, Gonzalez-Scarano F. Toxicity of TNF alpha and platelet activating factor for human NT2N neurons: a tissue culture model for human immunodeficiency virus dementia. J Neurovirol. 1996;2:118–126. doi: 10.3109/13550289609146545. [DOI] [PubMed] [Google Scholar]
- Zhang Z, Trautmann K, Schluesener HJ. Microglia activation in rat spinal cord by systemic injection of TLR3 and TLR7/8 agonists. J Neuroimmunol. 2005;164:154–160. doi: 10.1016/j.jneuroim.2005.03.014. [DOI] [PubMed] [Google Scholar]
- Zucchini N, Bessou G, Traub S, Robbins SH, Uematsu S, Akira S, Alexopoulou L, Dalod M. Cutting edge: Overlapping functions of TLR7 and TLR9 for innate defense against a herpesvirus infection. J Immunol. 2008;180:5799–5803. doi: 10.4049/jimmunol.180.9.5799. [DOI] [PubMed] [Google Scholar]


