

Abstract
High blood pressure (BP) is more prevalent and contributes to more severe manifestations of cardiovascular disease (CVD) in African Americans than in any other United States ethnic group. Several small African-ancestry (AA) BP genome-wide association studies (GWASs) have been published, but their findings have failed to replicate to date. We report on a large AA BP GWAS meta-analysis that includes 29,378 individuals from 19 discovery cohorts and subsequent replication in additional samples of AA (n = 10,386), European ancestry (EA) (n = 69,395), and East Asian ancestry (n = 19,601). Five loci (EVX1-HOXA, ULK4, RSPO3, PLEKHG1, and SOX6) reached genome-wide significance (p < 1.0 × 10⁻⁸) for either systolic or diastolic BP in a transethnic meta-analysis after correction for multiple testing. Three of these BP loci (EVX1-HOXA, RSPO3, and PLEKHG1) lack previous associations with BP. We also identified one independent signal in a known BP locus (SOX6) and provide evidence for fine mapping in four additional validated BP loci. We also demonstrate that validated EA BP GWAS loci, considered jointly, show significant effects in AA samples. Consequently, these findings suggest that BP loci might have universal effects across studied populations, demonstrating that multiethnic samples are an essential component in identifying, fine mapping, and understanding their trait variability.
Main Text
Hypertension (HTN [MIM 145500]) disproportionally affects African Americans, who generally have higher mean blood pressure (BP) and an earlier age of HTN diagnosis than other United States ethnicities.1–3 Increased severity of HTN contributes to a greater risk of stroke, coronary heart disease, and end-stage renal disease in African Americans than in United States European-ancestry (EA) individuals.4,5 Several factors are known to be associated with HTN risk, and they include genetic susceptibility and behavioral factors such as lifestyle, diet, and obesity,6–10 which vary across racial and ethnic groups. Several BP genome-wide association studies (GWASs) in EA individuals have been reported,11–13 including the International Consortium for Blood Pressure (ICBP) GWAS, which identified 28 loci with a combined genetic effect explaining 0.9% of BP variability.11 BP GWASs performed in African-ancestry (AA) individuals, however, have involved relatively smaller sample sizes14,15 and to date have failed to identify replicable loci. In contrast, admixture-mapping analysis has successfully identified NPR3 (MIM 108962) as a BP-associated locus in AA individuals;16 this region has also been identified in EA individuals and East Asians.11,17,18 Unfortunately, there have only been limited large-scale BP GWASs in African Americans, despite their higher risk of HTN and greater burden from BP disease. This communication reports findings from a large GWAS of 29,378 AA subjects for BP traits.
The overall study design is presented in Figure 1. We performed a meta-analyses of 19 studies (n = 29,378 subjects) from the Continental Origins and Genetic Epidemiology Network (COGENT) GWAS of AA samples for BP traits (Table 1). All individuals were at least 20 years old and were from 18 United States African American cohorts and a study from Yoruba, Nigeria. For individuals reporting use of antihypertensive medications, BP was imputed by the addition of 10 and 5 mmHg for systolic BP (SBP) and diastolic BP (DBP), respectively. Outliers defined as >4 SDs from the mean were excluded. Each study received institutional-review-board approval of its consent procedures, examination and surveillance components, data security measures, and DNA collection and use for genetic research. All participants in each study gave written informed consent for their participation in the study and genetic research.
Figure 1.
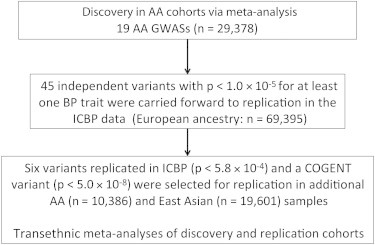
Overview of GWAS Meta-analysis for the COGENT Discovery and Replication Cohorts
Table 1.
Descriptive Characteristics of the AA Studies
| Study | Total Subjects | Age in Years (Mean ± SD) | No. of Males (%) | BMI (Mean ± SD) | No. with HTN (%) | SBP in mmHg (Mean ± SD) | DBP in mmHg (Mean ± SD) | Hypertensive Medication (%) |
|---|---|---|---|---|---|---|---|---|
| BioVu | 942 | 44.3 ± 16.5 | 269 (28.6) | 32.2 ± 10.0 | 673 (67.1) | 131.4 ± 21.1 | 79.3 ± 12.6 | 57.3 |
| ARIC | 2,511 | 53.3 ± 5.8 | 1,045 (36.9) | 29.7 ± 6.0 | 1,612 (58.7) | 128.3 ± 20.8 | 79.7 ± 12.1 | 44.0 |
| CARDIA | 833 | 24.4 ± 3.8 | 366 (38.6) | 25.4 ± 6.1 | 210 (25.2) | 116.9 ± 16.4 | 76.9 ± 12.1 | 13.0 |
| CFS | 489 | 45.7 ± 16.2 | 213 (40.9) | 34.3 ± 9.7 | 209 (44.6) | 128.2 ± 16.0 | 76.5 ± 10.7 | 38.9 |
| JHS | 2,017 | 50.0 ± 12.2 | 213 (39.3) | 32.3 ± 7.8 | 1,193 (56.5) | 124.9 ± 18.0 | 80.0 ± 10.6 | 46.3 |
| MESA | 1,623 | 62.2 ± 10.1 | 745 (45.3) | 30.2 ± 5.9 | 1,019 (62.0) | 131.4 ± 21.7 | 74.5 ± 10.2 | 50.5 |
| CHS | 815 | 72.7 ± 5.7 | 305 (37.4) | 28.5 ± 5.5 | 598 (73.4) | 148.1 ± 23.9 | 78.3 ± 11.6 | 62.7 |
| GeneSTAR | 1,132 | 46.5 ± 12.3 | 432 (38.2) | 32.0 ± 7.8 | 613 (54.2) | 127.7 ± 19.7 | 80.7 ± 11.4 | 37.9 |
| GENOA | 996 | 56.4 ± 11.1 | 295 (29.6) | 31.1 ± 6.8 | 688 (69.1) | 135.6 ± 22.5 | 78.3 ± 12.3 | 56.9 |
| HANDLS | 950 | 48.5 ± 9.0 | 424 (44.6) | 29.9 ± 8.0 | 437 (46.0) | 126.3 ± 19.8 | 75.4 ± 12.1 | 35.5 |
| Health ABC | 1,139 | 73.4 ± 2.9 | 488 (42.8) | 28.6 ± 5.4 | 871 (76.8) | 138.7 ± 21.4 | 72.5 ± 11.3 | 62.7 |
| HyperGEN | 1,252 | 45.2 ± 13.3 | 407 (32.5) | 32.5 ± 7.8 | 780 (54.2) | 134.4 ± 23.5 | 76.5 ± 12.0 | 37.7 |
| Maywood-Loyola | 743 | 42.3 ± 7.8 | 467 (62.9) | 26.7 ± 7.7 | 158 (21.3) | 120.6 ± 19.9 | 77.0 ± 13.4 | 0.7 |
| Nigeria-Loyola | 1,188 | 47.8 ± 15.5 | 510 (42.9) | 23.3 ± 5.1 | 443 (37.3) | 127.9 ± 26.4 | 77.8 ± 14.9 | 3.8 |
| Mt. Sinai Study | 873 | 59.3 ± 12.5 | 364 (41.7) | 30.7 ± 7.8 | 803 (92.0) | 134.2 ± 19.6 | 76.7 ± 10.5 | 88.3 |
| WHI-SHARe | 8,094 | 61.6 ± 7.0 | 0 (0.0) | 31.0 ± 6.4 | 4,780 (59.0) | 132.2 ± 17.9 | 78.1 ± 9.4 | 46.2 |
| HUFS | 1,017 | 48.4 ± 13.2 | 419 (41.2) | 30.5 ± 8.3 | 509 (50.0) | 131.3 ± 21.9 | 81.4 ± 13.3 | 13.3 |
| BHS | 368 | 37.6 ± 4.9 | 142 (38.6) | 31.4 ± 8.7 | 105 (28.5) | 125.8 ± 19.5 | 83.7 ± 13.0 | 16.2 |
| SIGNET | 2,396 | 63. 5 ± 8.6 | 870 (36.3) | 31.5 ± 6.9 | 585 (24.4) | 137.3 ± 18.8 | 81.4 ± 10.8 | 71.4 |
| AA Replication Cohorts | ||||||||
| JUPITER | 1,688 | 66.4 ± 8.1 | 850 (50.3) | 28.2 ± 7.3 | 1,067 (63.7) | 140.7 ± 17.7 | 84.3 ± 9.4 | 53.3 |
| Ghana | 3,420 | 43.0 ± 13.6 | 1,452 (42.5) | 24.7 ± 5.0 | 784 (22.9) | 127.3 ± 19.9 | 76.8 ± 12.0 | 0.0 |
| FBPP-AXIOM | 872 | 48.9 ± 13.1 | 372 (42.6) | 31.1 ± 7.0 | 604 (69.2) | 128.8 ± 21.6 | 74.6 ± 11.9 | 65.4 |
| HRS | 1,337 | 66.5 ± 10.2 | 483 (36.1) | 30.5 ± 6.5 | 1,073 (80.3) | 137.3 ± 23.2 | 82.2 ± 13.0 | 66.9 |
| Mt. Sinai IPM Biobank Program | 3,057 | 50.2 ± 14.7 | 1,018 (33.3) | 30.7 ± 8.2 | 1,999 (65.4) | 136.0 ± 23.0 | 80.0 ± 21.0 | 65.2 |
| The Seychelles TANDEM | 483 | 48.1 ± 13.6 | 203 (42.0) | 27.8 ± 5.4 | 310 (64.2) | 135.6 ± 22.6 | 84.5 ± 12.5 | 44.3 |
| The Seychelles Heart Study III | 906 | 44.9 ± 11.2 | 401 (44.3) | 27.2 ± 5.7 | 396 (43.7) | 129.5 ± 20.0 | 84.2 ± 12.3 | 27.9 |
Characteristics of studies contributing to the COGENT BP meta-analyses. Abbreviations are as follows: BMI, body mass index; BioVU, DNA databank of Vanderbilt University; ARIC, Atherosclerosis Risk in Communities; CARDIA, Coronary Artery Risk Development in Young Adults; CFS, Cleveland Family Study; JHS, Jackson Heart Study; MESA, Multi-Ethnic Study of Atherosclerosis; CHS, Cardiovascular Health Study; GeneSTAR, Genetic Study of Atherosclerosis Risk; GENOA, Genetic Epidemiology Network of Arteriopathy; HANDLS, The Healthy Aging in Neighborhoods of Diversity across the Life Span study; Health ABC, Health, Aging, and Body Composition study; HyperGEN, Hypertension Genetic Epidemiology Network; Maywood-Loyola, Maywood study at Loyola University Medical Center; Nigeria-Loyola, Nigeria study at Loyola University Medical Center; Mt. Sinai Study, Mount Sinai, New York City, USA, study; WHI-SHARe, Women’s Health Initiative SNP Health Association Resource; HUFS, Howard University Family Study; BHS, Bogalusa Heart Study; SIGNET, Sea Islands Genetic Network; JUPITER, Justification for the Use of Statins in Prevention: An Intervention Trial Evaluating Rosuvastatin; Ghana, Ghana study at Vanderbilt University; FBPP-AXIOM, Family Blood Pressure Program-AXIOM; HRS, Health and Retirement Study; and Mt. Sinai IPM Biobank, Mount Sinai Institute for Personalized Medicine Biobank Program.
After stringent quality control of genotyped and imputed data (Table S1, available online), ∼2.42 million SNPs were available for analyses. Prespecified analyses of SBP, DBP, and clinically treated HTN were performed for each cohort according to standardized protocols. SNP associations for SBP or DBP were assessed by linear regression or the generalized linear mixed-effects model for family data19 under the assumption of an additive model and after adjustment for age,2 body mass index, and gender. Each study also adjusted for the first ten principal components20,21 in regression analysis. For HTN, we used logistic regression models and adjusted the covariates appropriately. The genomic-control inflation factors showed little evidence of residual confounding by ancestry (λGC 0.97–1.12), indicating that population structure was well controlled in each cohort (Table S2). For each trait (SBP, DBP, and HTN), we combined results across studies by using the inverse-variance-weighted meta-analysis method. The quantile-quantile and Manhattan plots for discovery analyses are shown in Figure S1. In these analyses, only one SNP (rs11041530) located 10 kb downstream of cytochrome b5 reductase 2 (CYB5R2 [MIM 608342]) reached genome-wide significance for SBP (p = 4.0 × 10⁻⁸) (Table 2).
Table 2.
Meta-analyses of COGENT Discovery AA Samples and Replication in EA, East Asian, and Additional AA Data Sets
| Chr | SNP | Gene | Effect Allele/Other Allele |
Discovery COGENT |
Transethnic Replication |
Transethnic Meta-analysis pb,c | |||||
|---|---|---|---|---|---|---|---|---|---|---|---|
| Effect Allele Frequency | Trait | Beta (SE) | COGENT pa | EA ICBP pa | AA pa | East Asian pa | |||||
| 6 | rs13209747 | RSPO3 | T/C | 0.19 | SBP | 0.85 (0.21) | 5.9 × 10⁻⁵ | 5.4 × 10⁻⁴ | 5.0 × 10⁻⁴ | 2.6 × 10⁻³ | 2.6 × 10⁻¹⁰ |
| DBP | 0.56 (0.12) | 8.8 × 10⁻⁶ | 1.5 × 10⁻³ | 2.2 × 10⁻² | 1.2 × 10⁻⁴ | 2.4 × 10⁻¹¹ | |||||
| 6 | rs17080102 | PLEKHG1 | C/G | 0.1 | SBP | −1.02 (0.25) | 3.4 × 10⁻⁵ | 9.2 × 10⁻⁴ | 2.3 × 10⁻¹ | 3.4 × 10⁻² | 4.8 × 10⁻⁸ |
| DBP | −0.74 (0.15) | 5.4 × 10⁻⁷ | 1.5 × 10⁻⁴ | 4.1 × 10⁻¹ | 8.5 × 10⁻⁴ | 1.9 × 10⁻¹¹ | |||||
| 6 | rs6924906 | C6orf37 (FAM46A) | T/C | 0.71 | SBP | −0.41 (0.17) | 1.7 × 10⁻² | 5.6 × 10⁻⁴ | 4.7 × 10⁻¹ | 2.0 × 10⁻³ | 6.2 × 10⁻⁵ |
| DBP | −0.51 (0.10) | 5.6 × 10⁻⁷ | 4.9 × 10⁻² | 9.8 × 10⁻¹ | 8.8 × 10⁻³ | 5.5 × 10⁻⁷ | |||||
| 7 | rs17428471 | EVX1-HOXA | T/G | 0.14 | SBP | 1.20 (0.24) | 4.0 × 10⁻⁷ | 8.0 × 10⁻⁶ | 1.4 × 10⁻⁴ | 3.4 × 10⁻¹ | 2.1 × 10⁻¹² |
| DBP | 0.61 (0.14) | 1.2 × 10⁻⁵ | 2.8 × 10⁻⁵ | 1.1 × 10⁻² | 4.4 × 10⁻¹ | 1.6 × 10⁻⁹ | |||||
| 3 | rs1717027 | ULK4d | T/C | 0.64 | SBP | 0.18 (0.16) | 2.6 × 10⁻¹ | 5.0 × 10⁻¹ | 6.0 × 10⁻¹ | 5.6 × 10⁻¹ | 3.0 × 10⁻¹ |
| DBP | 0.49 (0.10) | 5.1 × 10⁻⁷ | 2.5 × 10⁻⁷ | 2.2 × 10⁻² | 1.5 × 10⁻¹ | 4.6 × 10⁻¹³ | |||||
| 11 | rs1401454 | SOX6d | T/C | 0.46 | SBP | 0.55 (0.16) | 5.7 × 10⁻⁴ | 2.2 × 10⁻⁴ | 9.7 × 10⁻⁴ | 6.7 × 10⁻¹ | 9.5 × 10⁻⁷ |
| DBP | 0.45 (0.10) | 2.1 × 10⁻⁶ | 3.1 × 10⁻⁵ | 5.0 × 10⁻³ | 5.5 × 10⁻¹ | 5.1 × 10⁻¹⁰ | |||||
| 11 | rs11041530 | CYB5R2 | C/G | 0.11 | SBP | −1.35 (0.25) | 4.0 × 10⁻⁸ | 0.029 | 8.0 × 10⁻¹ | 9.3 × 10⁻¹ | 5.6 × 10⁻⁶ |
| DBP | −0.54 (0.15) | 2.6 × 10⁻⁴ | 0.119 | 6.5 × 10⁻¹ | 6.6 × 10⁻¹ | 7.6 × 10⁻⁴ | |||||
Boldface indicates genome-wide significance after correction for the number of SNPs and traits. The following abbreviation is used: Chr, chromosome.
Significant thresholds: COGENT discovery, p < 5.0 × 10⁻⁸; replication in ICBP, p = 5.8 × 10⁻⁴; further replication in AA and East Asians, p = 0.0037.
Final significant variants were defined with the significance threshold of p < 1.67 × 10⁻⁸ after adjustment for the three traits.
p values were combined for the analysis of the ICBP meta-analysis of EA samples. The replication sample size and power for each SNP in the AA studies are presented in Table S5.
In addition to including CYB5R2, we carried forward all SNPs with p < 1.0 × 10⁻⁵ for SBP or DBP from the COGENT discovery AA analyses for replication in each of three replication samples: EA, AA, and Asian. We first attempted replication in the EA ICBP data,11 which have the largest replication sample size. There were 45 independent SNPs with p < 1.0 × 10⁻⁵ for at least one trait (Table S3, pairwise r2 < 0.076 in AA samples). Two SNPs monomorphic in HapMap CEU (Utah residents with ancestry from northern and western Europe from the CEPH collection) data were excluded from further analysis (Table S3). Among the 43 independent SNPs evaluated, we calculated the expected number of SNPs in EA ICBP samples across a range of significance levels under the assumption that the number of variants observed in the ICBP samples follows a binomial distribution when none of these variants are associated with BP. We observed significant enrichment of BP-associated SNPs in the EA ICBP samples across the range of significance levels (the largest p < 2.2 × 10⁻⁷, Table S4). After correction for multiple testing (Bonferroni cutoff p = 5.8 × 10⁻⁴ for two traits and 43 independent SNPs), six additional SNPs in six BP loci reached the significance threshold for SBP or DBP; these SNPs were located on chromosomes 3, 6, 7, and 11 (Table 2). However, rs11041530 (CYB5R2), which reached genome-wide significance in the COGENT discovery AA samples, did not replicate in ICBP samples after adjustment for multiple tests (p = 0.029).
We then carried these six SNPs and rs11041530 forward for further replication in additional AA (n = 10,386) and East Asian (n = 19,601) samples. The characteristics of the AA replication sample are shown in Table 1. Power estimates for AA samples are described in Table S5. Three SNPs (rs13209747, rs17428471, and rs1401454) across three independent loci replicated in AA samples (Bonferroni cutoff p = 0.0037 for 14 tests, i.e., two traits and seven SNPs, Table 2). Three SNPs (rs13209747, rs17080102 and rs6924906) were also significantly associated with BP traits in East Asians (p < 0.0037, Table 2). However, the beta estimate of rs6924906 was the opposite of the COGENT AA beta estimate, and this SNP association was not considered to be replicated (Table 2).
We next conducted transethnic meta-analyses by combining discovery AA samples and replication samples from all three ethnicities. In these analyses, in five independent loci we identified five SNPs associated with BP traits at p < 1.67 × 10⁻⁸; they included rs1717027, rs13209747, rs17080102, rs17428471, and rs1401454, which are consistent with the replication analyses of AA and East Asian samples. The threshold p = 1.67 × 10⁻⁸, which represents the genome-wide significance after correction for the three traits (SBP, DBP, and HTN) we analyzed, is relatively conservative because of the correlation among the BP traits. Two SNPs, rs6924906 and rs11041530, did not reach genome-wide significance and might indicate false-positive findings.
Three of the five SNPs in the identified loci lack previous associations with BP. SNP rs13209747 is located near R-spondin family member 3 (RSPO3 [MIM 610574]) in chromosomal region 6q22 (p = 2.56 × 10⁻¹⁰ for SBP and 2.43 × 10⁻¹¹ for DBP) (Table 2). rs17080102 is an intronic SNP in pleckstrin-homology-domain-containing, family G (with RhoGef domain) member 1 (PLEKHG1) in chromosomal region 6q25.1 (p = 4.75 × 10⁻⁸ for SBP and 1.90 × 10⁻¹¹ for DBP) (Table 2). Previous admixture-mapping studies have suggested evidence of local association with HTN at the 6q22–25 region in AA populations.16,22,23 RSPO3 activates the Wnt/beta-catenin signaling pathway, and variants therein are associated with blood urea nitrogen (a kidney trait) in East Asians,24 waist-to-hip ratio, and bone mineral density.25,26 Studies of knockout mice have shown that RSPO3 is required for Vegf expression and endothelial cell proliferation.27
The third BP variant, rs17428471, is located at 7p15–14, which contains several homeobox genes (EVX1-HOXA locus [MIM 142996 and MIM 142955], transethnic meta-analysis p = 2.1 × 10⁻¹² for SBP and p = 1.6 × 10⁻⁹ for DBP) (Table 2). Linkage disequilibrium (LD) in COGENT AA samples at 7p15–14 suggested three LD blocks represented by three independent SNPs—rs17428471, rs17471520, and rs11564022—with maximum pairwise r2 = 0.04. The three SNPs showed evidence of association with BP. We then performed conditional analysis by including the three SNPs in linear regression models by using the summary statistics28 and observed little change in significance (Table S6). These results are consistent with the regional SBP, DBP, and HTN plots, where three independent SNPs are present (Figures 2A–2C). Two of these SNPs replicated in additional AA samples for SBP (p = 0.011 for rs11564022 and p = 1.4 × 10⁻⁴ for rs17428471). rs17428471 also replicated in EA ICBP samples for both SBP and DBP (p < 2.8 × 10⁻⁵). This variant was not associated with BP traits in East Asians, although the allele is of lower frequency in Asians (minor allele frequency < 0.05). rs17428471 also reached genome-wide significance in transethnic meta-analyses (p = 2.1 × 10⁻¹² and no evidence of heterogeneity between ancestry samples) (Table 2 and Table S7).
Figure 2.
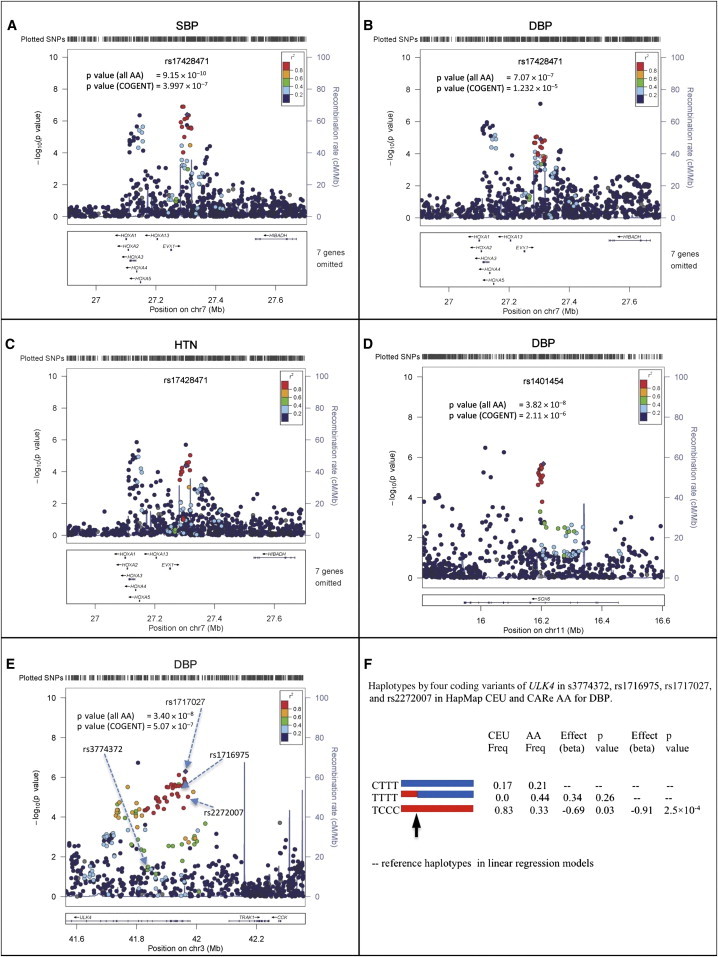
Regional Interrogation of the EVX1-HOXA, SOX6, and ULK4 Loci
(A–C) Associations between SBP, DBP, and HTN and homeobox genes on chromosome 7. Note the three independent SNPs (purple diamonds) in this region with multiple homeobox genes and EVX1 (Table 2). SNP rs17428471 is located in the middle peak.
(D) Association between DBP and SOX6 on chromosome 11. p values of rs1401454 in both COGENT and all combined AA samples are shown.
(E) Association between DBP and ULK4 on chromosome 3. One arrow points to the ICBP SNP rs3774372, which does not show evidence of association in COGENT samples. The most significant SNP is rs1717027.
(F) Haplotype analysis of coding variants rs3774372, rs1716975, rs1717027, and rs2272007 in ULK4. The red and blue lines indicate haplotypes. The arrow points to a historical recombination breakpoint observed in AA, but not in EA (HapMap CEU), populations. The best model fitting the National Heart, Lung, and Blood Institute Candidate-gene Association Resource (“CARe”) data is TCCC versus (CTTT and TTTT), indicating that SNP rs3774372 reported in ICBP11 is unlikely to be a causal variant.
In (A)–(E), the x axes show chromosomal positions, the left y axes show the p values, and the right y axes show the recombination rates across the region.
The fourth variant identified, rs1401454 in SOX6 (transcription factor SRY-Box6 [MIM 607257]) (Table 2 and Figure 2D), replicated in the additional AA samples. This SNP is 151 kb from rs2014408, a SNP which was previously reported in a GWAS of mean arterial pressure18 in EA individuals, but the two SNPs are in low LD (r2 ≤ 0.08 in our AA data). Furthermore, rs1401454 is 652 kb away from PLEKHA7 (MIM 612686) rs381815, a BP-associated SNP reported in EA samples,11 and LD between these SNPs was weak in our data (r2 ≤ 0.05). rs2014408 and rs381815 were only nominally associated with DBP in COGENT discovery AA samples (p = 0.05 and 0.02, respectively). We then performed conditional analysis for DBP in the COGENT AA cohorts by including rs2014408 and rs381815 as covariates in linear regression models by using the summary-statistic method. The association between rs1401454 and DBP was largely unchanged (Table S8), suggesting that rs1401454 is independent of the two reported SNPs identified in EA subjects.
The fifth identified variant, rs1717027, is located in ULK4 (p = 4.6 × 10⁻¹³ in the transethnic DBP meta-analysis) (Table 2). This locus was previously reported to be associated with DBP in EA individuals.12 rs1717027 is in strong LD with two nonsynonymous SNPs (nsSNPs) (rs1716975 and rs2272007, pairwise r2 > 0.93 in HapMap YRI [Yoruba in Ibadan, Nigeria]). Another ULK4 nsSNP, rs3774372, previously reported to be associated with DBP11 (Figure 2E), was not associated with BP traits in our AA samples (p = 0.75), nor was it in LD with rs1717027, rs1716975, or rs2272007 (all pairwise r2 < 0.14 in COGENT AA subjects). We phased haplotypes by using these four SNPs and observed two common haplotypes in the HapMap CEU sample and evidence of a historical recombination event in a haplotype in AA samples (Figure 2F). Both the recombinant haplotype and one original haplotype (blue haplotype in Figure 2F) in AA populations have similar effects on DBP, suggesting that rs3774372 or variants that are in LD with it are unlikely to be the causal variant(s). Because rs1716975 and rs2272007 are in strong LD in the AA population, further conditional fine mapping would be uninformative.
Because of the high correlation among BP traits, we also examined evidence of SNP associations with SBP, DBP, and HTN in COGENT GWAS samples by using a “sign flipping” multitrait test, based on available summary statistics. In brief, let be the estimated regression coefficients and SEs for SBP, DBP, and HTN, respectively, for the ith SNP and the jth cohort, where i = 1, 2, …, 2,415,958 and j = 1, 2, …, 19. Let be the meta-analysis p values of the ith SNP for the three traits. We used Fisher’s method for combining p values to summarize the total association evidence of the ith SNP for each trait, i.e., . Because no original genotype and phenotype information is available for the cohorts, we were not able to evaluate the distribution of xi under the null hypothesis by a conventional permutation approach, i.e., by permuting the original phenotypes while holding the genotypes constant. Instead, we randomly flipped the sign of regression coefficients. To preserve the correlations among the three traits, as well as the LD patterns among SNPs, we flipped the signs of regression coefficients simultaneously for one cohort and three traits. We performed this procedure 10,000 times. That is, at the kth time for the jth cohort, we generated = 1 or −1 with equal probability and let be the estimated regression coefficients. We then performed an inverse-variance-weighted meta-analysis by using the flipped regression coefficients and the original SEs to calculate and hence . We recorded , where k = 1, 2, …, 10,000, which is the empirical distribution of the most extreme summary statistic, genome-wide, under the null hypothesis that a SNP is not associated with any of the three traits. For the ith SNP, we computed the genome-wide p value as . Any SNP with p < 0.05 was considered genome-wide significant. Our simulations suggested that this method has valid type I error and is more powerful than a single SNP analysis (data not shown). With the “sign flipping” test, SNP rs17428471 reached genome-wide significance (p = 0.002), suggesting that this variant contributes to SBP, DBP, and HTN traits. These findings also provide further evidence of a role for the EVX1-HOXA locus for BP traits.
We also assessed whether BP loci previously identified in EA subjects have a broad role across ancestries. We tested the 29 ICBP-reported BP-associated SNPs from EA individuals;11 three loci were significantly associated with BP in COGENT AA individuals (Table S9, p < 0.00086), and ten additional loci showed nominal replication (p < 0.05). We then examined the correlations between effect sizes and log10(p values) and the 29 EA-derived SNPs in our AA and East Asian samples. Although the p values were generally weakly correlated across different ancestries, the effect sizes were strongly correlated (Figure 3), suggesting consistent contribution of these common variants to BP across ancestries.
Figure 3.
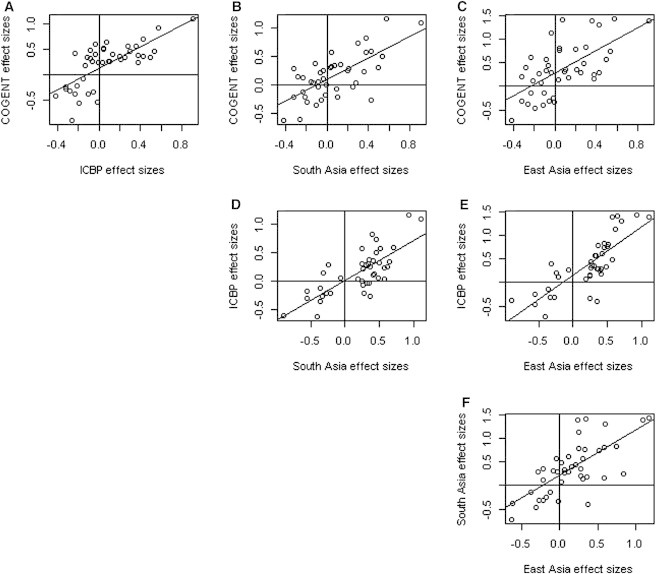
Pairwise Scatter Plots of the Effect Sizes of the 21 ICBP-Reported Variants among the COGENT, ICBP, South Asian, and East Asian Data Sets
The figure is plotted on the basis of the variants after exclusion of eight monomorphic variants in HapMap CHB (Han Chinese in Beijing, China) and JPT (Japanese in Tokyo, Japan) samples. The Pearson correlation coefficients and the corresponding p values are r = 0.72 and p = 8.6 × 10⁻¹¹ (A), r = 0.69 and p = 2.1 × 10⁻⁹ (B), r = 0.64 and p = 8.6 × 10⁻⁷ (C), r = 0.76 and p = 1.4 × 10⁻¹³ (D), r = 0.8 and p = 3.2 × 10⁻¹⁷ (E), and r = 0.7 and p = 3.2 × 10⁻¹⁰ (F). We observed that the effect sizes are highly correlated across the different ethnic populations. These results strongly suggest that many common variants consistently contribute to BP variation across ethnicities, although replication is challenging because of variation in LD, sample size, and allele frequency.
To fine map the genomic regions of reported ICBP variants, we further examined the 500 kb surrounding region at each of the loci in the COGENT AA samples. In four loci, we noted more significant SNPs than the ICBP index (published) SNPs identified in EA individuals. The index SNPs were not significant when conditioned on the most significant SNPs in the COGENT sample (Table S10 and Figures S2–S5). We calculated the sizes of LD blocks surrounding the most significant SNPs in the COGENT AA sample and observed shorter LD blocks. Therefore, in this data set, AA samples provided further fine mapping of these signals within these BP-associated loci.
We then estimated composite genetic-risk scores, as defined by ICBP, and observed highly significant associations for both SBP and DBP in the COGENT AA sample (p = 1.5 × 10⁻¹⁰ for SBP and p = 1.3 × 10⁻⁷ for DBP). A composite genetic-risk score using the five variants identified in this study accounted for 0.44% and 0.54% of the variability of SBP and DBP, respectively. The addition of these SNPs to the known variants from ICBP in the composite genetic-risk score substantially improved the explained variability to 0.80% and 1.42% for SBP and DBP, respectively. These findings provide evidence that many common variants at BP loci have broad effects across EA, AA, and East Asian populations rather than being population specific.
By examining a large number of genome-wide gene-expression data sets primarily from EA populations with significant index SNPs or proxies in high LD (r2 > 0.8 in HapMap CEU and YRI),29 we identified two loci as expression quantitative trait loci (eQTL). The BP-associated SOX6 index signal (rs1401454) was also independently associated with gene-expression levels of SOX6 in liver tissue in two studies (p < 5.8 × 10−54 and p < 1.0 × 10⁻¹⁶).30,31 The strongest eQTL SNP for SOX6 in each data set was rs1401454, indicating strong concordance between the BP and expression association signals. Several correlated SNPs at 3p22.1, including the index SNP rs1717027, were associated with gene-expression levels of both ULK4 and CTNNB1 (MIM 116806) in multiple tissues, including blood cells, adipose tissue, and brain tissue (ULK4 strongest p = 1.0 × 10⁻¹⁹ in the prefrontal cortex, CTNNB1 strongest p = 3.8 × 10−56 in the prefrontal cortex).
Pathway analyses applied to the genes (EVX1-HOXA, SOX6, RSPO3, PLEKHG1, and ULK4) with Ingenuity Pathway Analysis identified five canonical pathways (Figures S6A and S6B, p < 0.05), including nitric oxide signaling, which influences many processes related to BP, such as effects on vessel caliber (vasodilation), endothelial function, and cardiac contraction32 (Table S11). The genes identified in this study (EVX1, SOX6, and HOXA family genes) were present in a network connecting with CTNNB1, which is also a gene identified in expression analysis. CTNNB1 is a key player in Wnt signaling pathway.33
We further investigated the functional significance of the SNP signals in our association analysis by using the publically available ENCODE Project Consortium resources.34–36 We primarily used RegulomeDB and HaploReg for functional annotation of our COGENT BP findings.35,36 The rs17428471 variant in HOXA3 was observed to be in a Pax-4 motif. rs11564022 (HOXA3) is in perfect LD with rs11564023, which is in a DNase site (in NB4 cells) and marked by a number of histone marks and PEBP, Osf2, and Evi-1 motifs. rs17080102 resides in a DNase hypersensitive site marked by H3K27Ac and is in a region shown to bind c-Fos, GATA-2, and Pol2. Furthermore, this variant is in perfect LD with rs17080069, located in a DNase hypersensitive site that demonstrates binding to a number of cardiovascular regulators, including ESR1, TCF4, and NR3C1 (glucocorticoid receptor).
We then evaluated the evidence of recent positive selection near the BP signals identified in our association analysis by using several statistical techniques and the BioVU GWAS data, as well as population reference data sets (HapMap Phase III and the Human Genome Diversity Project). We compared adjusted allele frequencies among the BioVU African Americans and HapMap Phase III LWK (Luhya in Webuye, Kenya) and YRI individuals by using the method Treeselect37 and detected genome-wide-significant evidence of local differentiation between East and West African populations at nsSNP rs2301721 (p = 6.73 × 10⁻⁹) in homeobox A7 (HOXA7) in the chromosome 7 region near our SBP signal at EVX1. We detected modest signatures of recent positive selection in the region of EVX1-HOXA (near HOXA7) by using a number of conventional metrics38–40 (Figures S7–S13). Similar signatures of selection have been previously noted in East Asian populations at the ALDH2 locus, where an ethnicity-specific association with BP traits was also observed.17 These observations are consistent with the notion that BP-regulation mechanisms have been subjected to natural selection during human history.41
In summary, using AA samples and transethnic meta-analyses, we identified three BP loci (EVX1-HOXA, RSPO3, and PLEKHG1) and one independent SNP in a known BP locus (SOX6) and further fine mapped four previously identified loci. Overall, we observed that common variants discovered in EA subjects also have broad effects in our AA data sets. Cumulatively, these analyses signify that a largely common set of genes regulate BP across the studied human populations.
Contributor Information
Nora Franceschini, Email: noraf@unc.edu.
Xiaofeng Zhu, Email: xiaofeng.zhu@case.edu.
the Asian Genetic Epidemiology Network Consortium:
Min Jin Go, Young Jin Kim, Jong-Young Lee, Jae-Pil Jeon, Sung Soo Kim, Bok-Ghee Han, Yoon Shin Cho, Xueling Sim, Wan Ting Tay, Rick Twee Hee Ong, Mark Seielstad, Jian Jun Liu, Tin Aung, Tien Yin Wong, Yik Ying Teo, E. Shyong Tai, Chien-Hsiun Chen, Li-ching Chang, Yuan-Tsong Chen, Jer-Yuarn Wu, Tanika N. Kelly, Dongfeng Gu, James E. Hixson, Yun Ju Sung, Jiang He, Yasuharu Tabara, Yoshihiro Kokubo, Tetsuro Miki, Naoharu Iwai, Norihiro Kato, Fumihiko Takeuchi, Tomohiro Katsuya, Toru Nabika, Takao Sugiyama, Yi Zhang, Wei Huang, Xuegong Zhang, Xueya Zhou, Li Jin, and Dingliang Zhu
Supplemental Data
Web Resources
The URLs for data presented herein are as follows:
ENCODE Pilot Project: Common Consortium Resources, www.genome.gov/12513455
Ingenuity Pathway Analysis, http://www.ingenuity.com
Online Mendelian Inheritance in Man (OMIM), http://www/omim.org/
References
- 1.Roger V.L., Go A.S., Lloyd-Jones D.M., Benjamin E.J., Berry J.D., Borden W.B., Bravata D.M., Dai S., Ford E.S., Fox C.S., American Heart Association Statistics Committee and Stroke Statistics Subcommittee Executive summary: heart disease and stroke statistics—2012 update: a report from the American Heart Association. Circulation. 2012;125:188–197. doi: 10.1161/CIR.0b013e3182456d46. [DOI] [PubMed] [Google Scholar]
- 2.Hertz R.P., Unger A.N., Cornell J.A., Saunders E. Racial disparities in hypertension prevalence, awareness, and management. Arch. Intern. Med. 2005;165:2098–2104. doi: 10.1001/archinte.165.18.2098. [DOI] [PubMed] [Google Scholar]
- 3.Stevens J., Truesdale K.P., Katz E.G., Cai J. Impact of body mass index on incident hypertension and diabetes in Chinese Asians, American Whites, and American Blacks: the People’s Republic of China Study and the Atherosclerosis Risk in Communities Study. Am. J. Epidemiol. 2008;167:1365–1374. doi: 10.1093/aje/kwn060. [DOI] [PMC free article] [PubMed] [Google Scholar]
- 4.Chobanian A.V., Bakris G.L., Black H.R., Cushman W.C., Green L.A., Izzo J.L., Jr., Jones D.W., Materson B.J., Oparil S., Wright J.T., Jr., Roccella E.J., National Heart, Lung, and Blood Institute Joint National Committee on Prevention, Detection, Evaluation, and Treatment of High Blood Pressure. National High Blood Pressure Education Program Coordinating Committee The Seventh Report of the Joint National Committee on Prevention, Detection, Evaluation, and Treatment of High Blood Pressure: the JNC 7 report. JAMA. 2003;289:2560–2572. doi: 10.1001/jama.289.19.2560. [DOI] [PubMed] [Google Scholar]
- 5.Berry J.D., Dyer A., Cai X., Garside D.B., Ning H., Thomas A., Greenland P., Van Horn L., Tracy R.P., Lloyd-Jones D.M. Lifetime risks of cardiovascular disease. N. Engl. J. Med. 2012;366:321–329. doi: 10.1056/NEJMoa1012848. [DOI] [PMC free article] [PubMed] [Google Scholar]
- 6.Forman J.P., Stampfer M.J., Curhan G.C. Diet and lifestyle risk factors associated with incident hypertension in women. JAMA. 2009;302:401–411. doi: 10.1001/jama.2009.1060. [DOI] [PMC free article] [PubMed] [Google Scholar]
- 7.Whelton P.K., He J., Appel L.J., Cutler J.A., Havas S., Kotchen T.A., Roccella E.J., Stout R., Vallbona C., Winston M.C., Karimbakas J., National High Blood Pressure Education Program Coordinating Committee Primary prevention of hypertension: clinical and public health advisory from The National High Blood Pressure Education Program. JAMA. 2002;288:1882–1888. doi: 10.1001/jama.288.15.1882. [DOI] [PubMed] [Google Scholar]
- 8.Stamler J., Stamler R., Neaton J.D., Wentworth D., Daviglus M.L., Garside D., Dyer A.R., Liu K., Greenland P. Low risk-factor profile and long-term cardiovascular and noncardiovascular mortality and life expectancy: findings for 5 large cohorts of young adult and middle-aged men and women. JAMA. 1999;282:2012–2018. doi: 10.1001/jama.282.21.2012. [DOI] [PubMed] [Google Scholar]
- 9.Appel L.J., Brands M.W., Daniels S.R., Karanja N., Elmer P.J., Sacks F.M., American Heart Association Dietary approaches to prevent and treat hypertension: a scientific statement from the American Heart Association. Hypertension. 2006;47:296–308. doi: 10.1161/01.HYP.0000202568.01167.B6. [DOI] [PubMed] [Google Scholar]
- 10.Primatesta P., Falaschetti E., Gupta S., Marmot M.G., Poulter N.R. Association between smoking and blood pressure: evidence from the health survey for England. Hypertension. 2001;37:187–193. doi: 10.1161/01.hyp.37.2.187. [DOI] [PubMed] [Google Scholar]
- 11.Ehret G.B., Munroe P.B., Rice K.M., Bochud M., Johnson A.D., Chasman D.I., Smith A.V., Tobin M.D., Verwoert G.C., Hwang S.J., International Consortium for Blood Pressure Genome-Wide Association Studies. CARDIoGRAM consortium. CKDGen Consortium. KidneyGen Consortium. EchoGen consortium. CHARGE-HF consortium Genetic variants in novel pathways influence blood pressure and cardiovascular disease risk. Nature. 2011;478:103–109. doi: 10.1038/nature10405. [DOI] [PMC free article] [PubMed] [Google Scholar]
- 12.Levy D., Ehret G.B., Rice K., Verwoert G.C., Launer L.J., Dehghan A., Glazer N.L., Morrison A.C., Johnson A.D., Aspelund T. Genome-wide association study of blood pressure and hypertension. Nat. Genet. 2009;41:677–687. doi: 10.1038/ng.384. [DOI] [PMC free article] [PubMed] [Google Scholar]
- 13.Newton-Cheh C., Johnson T., Gateva V., Tobin M.D., Bochud M., Coin L., Najjar S.S., Zhao J.H., Heath S.C., Eyheramendy S., Wellcome Trust Case Control Consortium Genome-wide association study identifies eight loci associated with blood pressure. Nat. Genet. 2009;41:666–676. doi: 10.1038/ng.361. [DOI] [PMC free article] [PubMed] [Google Scholar]
- 14.Adeyemo A., Gerry N., Chen G., Herbert A., Doumatey A., Huang H., Zhou J., Lashley K., Chen Y., Christman M., Rotimi C. A genome-wide association study of hypertension and blood pressure in African Americans. PLoS Genet. 2009;5:e1000564. doi: 10.1371/journal.pgen.1000564. [DOI] [PMC free article] [PubMed] [Google Scholar]
- 15.Fox E.R., Young J.H., Li Y., Dreisbach A.W., Keating B.J., Musani S.K., Liu K., Morrison A.C., Ganesh S., Kutlar A., International Consortium for Blood Pressure Genome-wide Association Studies (ICBP-GWAS) Association of genetic variation with systolic and diastolic blood pressure among African Americans: the Candidate Gene Association Resource study. Hum. Mol. Genet. 2011;20:2273–2284. doi: 10.1093/hmg/ddr092. [DOI] [PMC free article] [PubMed] [Google Scholar]
- 16.Zhu X., Young J.H., Fox E., Keating B.J., Franceschini N., Kang S., Tayo B., Adeyemo A., Sun Y.V., Li Y. Combined admixture mapping and association analysis identifies a novel blood pressure genetic locus on 5p13: contributions from the CARe consortium. Hum. Mol. Genet. 2011;20:2285–2295. doi: 10.1093/hmg/ddr113. [DOI] [PMC free article] [PubMed] [Google Scholar]
- 17.Kato N., Takeuchi F., Tabara Y., Kelly T.N., Go M.J., Sim X., Tay W.T., Chen C.H., Zhang Y., Yamamoto K. Meta-analysis of genome-wide association studies identifies common variants associated with blood pressure variation in east Asians. Nat. Genet. 2011;43:531–538. doi: 10.1038/ng.834. [DOI] [PMC free article] [PubMed] [Google Scholar]
- 18.Johnson T., Gaunt T.R., Newhouse S.J., Padmanabhan S., Tomaszewski M., Kumari M., Morris R.W., Tzoulaki I., O’Brien E.T., Poulter N.R., Cardiogenics Consortium. Global BPgen Consortium Blood pressure loci identified with a gene-centric array. Am. J. Hum. Genet. 2011;89:688–700. doi: 10.1016/j.ajhg.2011.10.013. [DOI] [PMC free article] [PubMed] [Google Scholar]
- 19.Chen M.H., Yang Q. GWAF: an R package for genome-wide association analyses with family data. Bioinformatics. 2010;26:580–581. doi: 10.1093/bioinformatics/btp710. [DOI] [PMC free article] [PubMed] [Google Scholar]
- 20.Price A.L., Patterson N.J., Plenge R.M., Weinblatt M.E., Shadick N.A., Reich D. Principal components analysis corrects for stratification in genome-wide association studies. Nat. Genet. 2006;38:904–909. doi: 10.1038/ng1847. [DOI] [PubMed] [Google Scholar]
- 21.Zhu X., Zhang S., Zhao H., Cooper R.S. Association mapping, using a mixture model for complex traits. Genet. Epidemiol. 2002;23:181–196. doi: 10.1002/gepi.210. [DOI] [PubMed] [Google Scholar]
- 22.Zhu X., Cooper R.S. Admixture mapping provides evidence of association of the VNN1 gene with hypertension. PLoS ONE. 2007;2:e1244. doi: 10.1371/journal.pone.0001244. [DOI] [PMC free article] [PubMed] [Google Scholar]
- 23.Zhu X., Luke A., Cooper R.S., Quertermous T., Hanis C., Mosley T., Gu C.C., Tang H., Rao D.C., Risch N., Weder A. Admixture mapping for hypertension loci with genome-scan markers. Nat. Genet. 2005;37:177–181. doi: 10.1038/ng1510. [DOI] [PubMed] [Google Scholar]
- 24.Kim Y.J., Go M.J., Hu C., Hong C.B., Kim Y.K., Lee J.Y., Hwang J.Y., Oh J.H., Kim D.J., Kim N.H., MAGIC consortium Large-scale genome-wide association studies in East Asians identify new genetic loci influencing metabolic traits. Nat. Genet. 2011;43:990–995. doi: 10.1038/ng.939. [DOI] [PubMed] [Google Scholar]
- 25.Duncan E.L., Danoy P., Kemp J.P., Leo P.J., McCloskey E., Nicholson G.C., Eastell R., Prince R.L., Eisman J.A., Jones G. Genome-wide association study using extreme truncate selection identifies novel genes affecting bone mineral density and fracture risk. PLoS Genet. 2011;7:e1001372. doi: 10.1371/journal.pgen.1001372. [DOI] [PMC free article] [PubMed] [Google Scholar]
- 26.Heid I.M., Jackson A.U., Randall J.C., Winkler T.W., Qi L., Steinthorsdottir V., Thorleifsson G., Zillikens M.C., Speliotes E.K., Mägi R., MAGIC Meta-analysis identifies 13 new loci associated with waist-hip ratio and reveals sexual dimorphism in the genetic basis of fat distribution. Nat. Genet. 2010;42:949–960. doi: 10.1038/ng.685. [DOI] [PMC free article] [PubMed] [Google Scholar]
- 27.Kazanskaya O., Ohkawara B., Heroult M., Wu W., Maltry N., Augustin H.G., Niehrs C. The Wnt signaling regulator R-spondin 3 promotes angioblast and vascular development. Development. 2008;135:3655–3664. doi: 10.1242/dev.027284. [DOI] [PubMed] [Google Scholar]
- 28.Yang J., Ferreira T., Morris A.P., Medland S.E., Madden P.A., Heath A.C., Martin N.G., Montgomery G.W., Weedon M.N., Loos R.J., Genetic Investigation of ANthropometric Traits (GIANT) Consortium. DIAbetes Genetics Replication And Meta-analysis (DIAGRAM) Consortium Conditional and joint multiple-SNP analysis of GWAS summary statistics identifies additional variants influencing complex traits. Nat. Genet. 2012;44:369–375. doi: 10.1038/ng.2213. S1–S3. [DOI] [PMC free article] [PubMed] [Google Scholar]
- 29.Johnson A.D., Handsaker R.E., Pulit S.L., Nizzari M.M., O’Donnell C.J., de Bakker P.I. SNAP: a web-based tool for identification and annotation of proxy SNPs using HapMap. Bioinformatics. 2008;24:2938–2939. doi: 10.1093/bioinformatics/btn564. [DOI] [PMC free article] [PubMed] [Google Scholar]
- 30.Greenawalt D.M., Dobrin R., Chudin E., Hatoum I.J., Suver C., Beaulaurier J., Zhang B., Castro V., Zhu J., Sieberts S.K. A survey of the genetics of stomach, liver, and adipose gene expression from a morbidly obese cohort. Genome Res. 2011;21:1008–1016. doi: 10.1101/gr.112821.110. [DOI] [PMC free article] [PubMed] [Google Scholar]
- 31.Innocenti F., Cooper G.M., Stanaway I.B., Gamazon E.R., Smith J.D., Mirkov S., Ramirez J., Liu W., Lin Y.S., Moloney C. Identification, replication, and functional fine-mapping of expression quantitative trait loci in primary human liver tissue. PLoS Genet. 2011;7:e1002078. doi: 10.1371/journal.pgen.1002078. [DOI] [PMC free article] [PubMed] [Google Scholar]
- 32.Saraiva R.M., Hare J.M. Nitric oxide signaling in the cardiovascular system: implications for heart failure. Curr. Opin. Cardiol. 2006;21:221–228. doi: 10.1097/01.hco.0000221584.56372.dc. [DOI] [PubMed] [Google Scholar]
- 33.Clevers H., Nusse R. Wnt/β-catenin signaling and disease. Cell. 2012;149:1192–1205. doi: 10.1016/j.cell.2012.05.012. [DOI] [PubMed] [Google Scholar]
- 34.Bernstein B.E., Birney E., Dunham I., Green E.D., Gunter C., Snyder M., ENCODE Project Consortium An integrated encyclopedia of DNA elements in the human genome. Nature. 2012;489:57–74. doi: 10.1038/nature11247. [DOI] [PMC free article] [PubMed] [Google Scholar]
- 35.Boyle A.P., Hong E.L., Hariharan M., Cheng Y., Schaub M.A., Kasowski M., Karczewski K.J., Park J., Hitz B.C., Weng S. Annotation of functional variation in personal genomes using RegulomeDB. Genome Res. 2012;22:1790–1797. doi: 10.1101/gr.137323.112. [DOI] [PMC free article] [PubMed] [Google Scholar]
- 36.Ward L.D., Kellis M. HaploReg: a resource for exploring chromatin states, conservation, and regulatory motif alterations within sets of genetically linked variants. Nucleic Acids Res. 2012;40(Database issue):D930–D934. doi: 10.1093/nar/gkr917. [DOI] [PMC free article] [PubMed] [Google Scholar]
- 37.Bhatia G., Patterson N., Pasaniuc B., Zaitlen N., Genovese G., Pollack S., Mallick S., Myers S., Tandon A., Spencer C. Genome-wide comparison of African-ancestry populations from CARe and other cohorts reveals signals of natural selection. Am. J. Hum. Genet. 2011;89:368–381. doi: 10.1016/j.ajhg.2011.07.025. [DOI] [PMC free article] [PubMed] [Google Scholar]
- 38.Tajima F. Statistical method for testing the neutral mutation hypothesis by DNA polymorphism. Genetics. 1989;123:585–595. doi: 10.1093/genetics/123.3.585. [DOI] [PMC free article] [PubMed] [Google Scholar]
- 39.Sabeti P.C., Varilly P., Fry B., Lohmueller J., Hostetter E., Cotsapas C., Xie X., Byrne E.H., McCarroll S.A., Gaudet R., International HapMap Consortium Genome-wide detection and characterization of positive selection in human populations. Nature. 2007;449:913–918. doi: 10.1038/nature06250. [DOI] [PMC free article] [PubMed] [Google Scholar]
- 40.Voight B.F., Kudaravalli S., Wen X., Pritchard J.K. A map of recent positive selection in the human genome. PLoS Biol. 2006;4:e72. doi: 10.1371/journal.pbio.0040072. [DOI] [PMC free article] [PubMed] [Google Scholar]
- 41.Young J.H., Chang Y.P., Kim J.D., Chretien J.P., Klag M.J., Levine M.A., Ruff C.B., Wang N.Y., Chakravarti A. Differential susceptibility to hypertension is due to selection during the out-of-Africa expansion. PLoS Genet. 2005;1:e82. doi: 10.1371/journal.pgen.0010082. [DOI] [PMC free article] [PubMed] [Google Scholar]
Associated Data
This section collects any data citations, data availability statements, or supplementary materials included in this article.