

Abstract
Derivatives of vitamin B12 (cobalamin) are essential cofactors for enzymes required in intermediary metabolism. Defects in cobalamin metabolism lead to disorders characterized by the accumulation of methylmalonic acid and/or homocysteine in blood and urine. The most common inborn error of cobalamin metabolism, combined methylmalonic acidemia and hyperhomocysteinemia, cblC type, is caused by mutations in MMACHC. However, several individuals with presumed cblC based on cellular and biochemical analysis do not have mutations in MMACHC. We used exome sequencing to identify the genetic basis of an X-linked form of combined methylmalonic acidemia and hyperhomocysteinemia, designated cblX. A missense mutation in a global transcriptional coregulator, HCFC1, was identified in the index case. Additional male subjects were ascertained through two international diagnostic laboratories, and 13/17 had one of five distinct missense mutations affecting three highly conserved amino acids within the HCFC1 kelch domain. A common phenotype of severe neurological symptoms including intractable epilepsy and profound neurocognitive impairment, along with variable biochemical manifestations, was observed in all affected subjects compared to individuals with early-onset cblC. The severe reduction in MMACHC mRNA and protein within subject fibroblast lines suggested a role for HCFC1 in transcriptional regulation of MMACHC, which was further supported by the identification of consensus HCFC1 binding sites in MMACHC. Furthermore, siRNA-mediated knockdown of HCFC1 expression resulted in the coordinate downregulation of MMACHC mRNA. This X-linked disorder demonstrates a distinct disease mechanism by which transcriptional dysregulation leads to an inborn error of metabolism with a complex clinical phenotype.
Introduction
Cobalamin-derived cofactors, 5′-adenosylcobalamin (Ado-Cbl) and methylcobalamin (Me-Cbl), are essential for the activity of methylmalonyl-CoA mutase (MUT [ENZYME EC 5.4.99.2]) and methionine synthase (MTR [ENZYME EC 2.1.1.13]), respectively. MUT functions in the catabolism of branched-chain amino acids and odd-chain fatty acids into the Krebs cycle, and MTR catalyzes the remethylation of homocysteine to methionine. Mutations in MUT (MIM 609058) or MTR (MIM 156570) or defects in either the intracellular transport of cobalamin or the synthesis of the active enzymatic cofactors result in one of nine distinct inborn errors of metabolism, historically designated by the cellular complementation class (mut, cblA–cblG, or cblJ).1 The disorders that affect both the synthesis and the transport of 5′-Ado-Cbl and Me-Cbl (cblC [MIM 277400]), cblD combined [MIM 277410], cblF [MIM 277380], and cblJ [MIM 614857]) share the characteristic biochemical findings of combined methylmalonic acidemia and hyperhomocysteinemia.
Combined methylmalonic acidemia and hyperhomocysteinemia, cblC type, one of the first recognized and most common inborn errors of cobalamin metabolism, is caused by mutations in MMACHC2 (MIM 609831). The clinical phenotype of cblC is diverse and can feature neurologic, renal, cardiac, hematologic, and ophthalmologic manifestations.3–5 Although the clinical phenotypes of cblD combined, cblF, and cblJ defects are not as well delineated, most reported cases have been phenotypically similar to cblC.6–8 The genes associated with these disorders have been discovered.6–9 However, several individuals who have a cellular, but not molecular, diagnosis of cblC still exist,2,9 suggesting genetic heterogeneity within this complementation group. MMACHC sequence analysis did not identify causative mutations in 14/2049 or 3/1182 reported individuals with biochemically confirmed cblC deficiency.
Here, we describe the identification of an X-linked form of combined methylmalonic acidemia and hyperhomocysteinemia, designated cblX. Exome sequencing of a male subject initially diagnosed with cblC by complementation analysis but who had no mutations in MMACHC identified a mutation in HCFC1 (MIM 300019), a coregulator of the zinc-finger transcription factor THAP11 (also known as RONIN).10,11 Sanger sequencing of HFCF1 in 17 additional male subjects revealed that 13 harbored one of five pathogenic missense HCFC1 mutations. Functional analysis further implicated HCFC1 in transcriptional regulation of MMACHC.
Subjects and Methods
Human Subjects
All human subject samples used in this study were collected after informed consent was obtained. Subject 1 and his parents were enrolled into a research protocol (COMIRB no. 07-0386) approved by the institutional review board at the University of Colorado, School of Medicine. Subject 1, subject 11, and their parents were enrolled in National Institutes of Health study “Clinical and Basic Investigations of Methylmalonic Acidemia and Related Disorders” (clinicaltrials.gov identifier NCT00078078) in compliance with the Helsinki Declaration and provided informed consent. The studies at McGill University Health Centre (Montreal) and University Children’s Hospital (Zurich) were approved by their respective ethics committees. Genomic DNA was obtained from either peripheral-blood lymphocytes or cultured skin fibroblasts.
Whole-Exome Sequencing
Whole-exome sequencing (WES) on subject 1 and his parents was performed with Nimblegen SeqCap EZ Exome v.2.0 and was followed by sequencing on an Illumina HiSeq 2000. Approximately 50 million 90 bp paired-end reads (>50×) were obtained. Sequence reads were first mapped to the human reference genome (hg19 assembly, UCSC Genome Browser) with the Burrows-Wheeler Aligner12 and then visualized with the Integrative Genomics Viewer.13 The utilities in SAMtools14 were used for variant calling, and variants were annotated with SeattleSeq. Further filtering and testing of the inheritance model were done with tools in Galaxy.15 Single-nucleotide variants (SNVs) were filtered for retaining calls that met the following criteria: SNP and consensus scores >50, read coverage >8, and >25% of the reads containing the variant call. Bases with a PHRED-scaled score <20 were removed from the analysis. For homozygous and hemizygous variant calls, >80% reads were required to contain the variant, whereas for heterozygous variant calls, the number of reads containing the variant call ranged between 25% and 80%. Indels < 50 bp were filtered on the basis of similar criteria, except that the SNP and consensus scores were required to be >100. Variants found in segmental duplications or simple- or low-complexity repeats were removed because of the higher likelihood of mapping errors. Sequence data from parental samples were used as an additional filter for confirmation of variant calls in subject 1. The filtering criteria for variant calling in parental data were less stringent than those in subject 1 so that erroneous classification of variants as unique to subject 1 could be minimized. Thus, the criteria for parental data included SNP score > 5 for SNVs and SNP score > 10 for indels and required that at least two reads contain the variant call. Variants were filtered against dbSNP build 135 and 1000 Genomes (November 23, 2010 release). The sequence data from the family was then used for testing for causal variants under different inheritance models, including a de novo mutation in a dominant model and compound-heterozygous, homozygous, and X-linked hemizygous mutations in recessive models.
Sanger Sequencing
Variants identified in HCFC1 and TTN (MIM 188840) were further validated by Sanger sequencing in subject 1 and his parents. Mutations detected in HCFC1 and TTN were named with the use of RefSeq cDNA accession numbers NM_005334.2 and NM_133378.4, respectively. Primers were designed to amplify and sequence the 26 coding exons of HCFC1 in the 17 additional subjects and available parents (Table S1, available online). Genomic DNA (100 ng) was amplified with the following PCR conditions: Promega GoTaq Hot Start kit with 1× Master Mix and 400 nM of each primer. PCR began with an initial cycle at 95°C for 3 min and 30 subsequent cycles of 94°C for 30 s, 60°C for 30 s, and 72°C for 1 min and finished with an extension at 72°C for 5 min. Amplified PCR products were sequenced with the PCR primers as sequencing primers on an ABI PRISM 3730xl by a commercial sequencing facility.
Protein Alignment
HCFC1 sequences in human (RefSeq NP_005325.2), chimpanzee (RefSeq XP_521330.3), mouse (RefSeq NP_032250.2), rat (RefSeq NP_001132979.1), frog (RefSeq XP_002937269.1), and two zebrafish paralogs (RefSeq NP_001122009.1 and NP_001038529.1) were aligned with ClustalW.16
Protein Modeling
Predicted models of the wild-type and altered HCFC1 (UniProtKB P51610) kelch domain (amino acids 42–342) were created by Modeller17 with human KLHL12 (Protein Data Bank ID 2VPJ) as a modeling template. KLHL12 was chosen by CPHmodels18 because it had an available protein model with the highest homology with the HCFC1 kelch domain. The resulting structures were visualized with Chimera.19
HCFC1 and THAP11 Binding Sites
Binding regions of HCFC1 and THAP11 were obtained from chromatin immunoprecipitation sequencing (ChIP-seq) data in mouse embryonic stem cells.10 Mouse genomic coordinates from the mm8 assembly of the UCSC Genome Browser were converted to the orthologous human hg19 assembly with the LiftOver tool from the UCSC Genome Browser.20 A highly conserved 15 bp (5′-CTGGGARWTGTAGTY-3′) THAP11 binding motif10 was identified by fuzznuc21 in the human genome. A maximum of 2 bp mismatch was allowed.
Analysis of RNA Expression
For quantitative evaluation of gene expression, total RNA was isolated from human fibroblasts and reverse transcribed. The two control samples used were from healthy individuals with no known biochemical or neurological phenotypes. The Promega GoScript reverse-transcription system was used for converting RNA to cDNA with random primers. Assays for quantitative PCR (qPCR) were designed with the Roche Universal ProbeLibrary Design Center, and Roche Universal Probes and FastStart Universal Probe Master Mix with Rox were used. The Roche Universal ProbeLibrary Human ACTB (β-actin) Gene Assay was used as an endogenous control (catalog no. 05046165001). Primers (Table S1) were synthesized by Integrated DNA Technologies. Primer pairs that showed an amplification efficiency within ± 10% of each other and a coefficient of correlation between 0.95 and 1.0 were used for quantification. ABI 7500 Software version 2.0.5 was used to calculate the relative expression levels with the ΔΔCT method. The reactions were all carried out in technical triplicates. The experiment was also repeated in three biological replicates. Error bars represent the SEM of relative expression levels. Statistical significance was calculated with a two-tailed t test.
Immunoblot Analysis
Control human dermal fibroblasts (C-013-5C) were obtained from Life Technologies. Human fibroblasts were grown to ∼95% confluence in 10 cm plates and lysed in T-PER containing a protease-inhibitor cocktail (Thermo Fisher Scientific). Crude lysates were clarified by centrifugation at 13,000 rpm for 10 min at 4°C. Seventy-five micrograms of lysate was analyzed by immunoblots with a rabbit polyclonal MMACHC (ab96195; Abcam) antibody at a dilution of 1:1,000 or rabbit polyclonal HCFC1 antibody (A301-400A; Bethyl Laboratories) at a dilution of 1:2,000. The blot was stripped with Restore Western Blot Stripping Buffer (Thermo Fisher Scientific) and reprobed with a rabbit polyclonal β-actin antibody at a dilution of 1:3,000 as a loading control. Secondary antibody was visualized by chemiluminescence detection (Thermo Fisher Scientific). Immunoblots for HCFC1 siRNA knockdown experiments were performed on cell lysates obtained from human embryonic kidney 293 (HEK293) cells (American Type Culture Collection) treated with either HCFC1 siRNA or scrambled siRNA in three biological replicates. Cells were harvested for immunoblotting 4 days after transfection. The antibodies used for immunoblot analysis of HCFC1 and β-actin were the same as above.
HCFC1 siRNA Knockdown
HEK293 cells were transfected with Trilencer-27 siRNA duplexes (Origene) with the use of the siTran transfection reagent and incubated for 48 hr. RNA was isolated from HCFC1 siRNA-treated cells and scrambled-siRNA-treated control cells with the RNeasy Micro Kit (QIAGEN). Total RNA was quantitated in each individual sample, and 1 μg of total RNA was used for producing cDNA with random hexamer primers with the GoScript Reverse Transcription System (Promega) according to the manufacturer’s instructions. Quantitative PCR was performed as described above. The reactions were all carried out in technical triplicates. The experiment was also repeated in three biological replicates. Error bars represent the SEM of relative expression levels. Statistical significance was calculated with a two-tailed t test.
MMA Production by Cultured cblX Fibroblasts
A modified chemical-stimulation study was performed as described previously.22 Six-well tissue-culture plates were seeded at a density of 2 × 10⁵ or 5 × 10⁵ cells per well in high glucose (4 g/l) DMEM supplemented with 10% fetal bovine serum, penicillin streptomycin, L-glutamine, and sodium pyruvate. The next day, the DMEM growth medium was removed and replaced with 1 ml of DMEM growth medium containing sodium propionate (10 mM) or sodium propionate (10 mM) plus hydroxocobalamin (1 μg/ml). After 72 hr, the medium was collected for gas chromatography–mass spectrometry analysis of MMA and measured in triplicate. Cell viability was determined by visual inspection and noted to be equal in all groups.
Results
Clinical Data
The clinical features of subjects are shown in Table 1. A common phenotype of severe neurological symptoms, which primarily include intractable epilepsy and neurocognitive impairment, was observed in all affected males (Table 1). Disease onset was either in the prenatal period (n = 3) or in early infancy (n = 11), and severe neurological manifestations were present in all subjects. Seizures (n = 12), profound developmental delay (n = 11), microcephaly (n = 7), movement disorders (n = 4), and a history of maternal male infant deaths (n = 3) were reported. Biochemical perturbations included hyperhomocysteinemia, methylmalonic acidemia, and increased propionylcarnitine (Table 1 and Table S2). Laboratory values were more variable than seen in individuals with early-onset cblC4 (Figure 1) given that five cblX subjects had normal plasma total homocysteine. Cellular biochemical studies were performed in all subjects and revealed diminished 1-[14C]-propionate and 5-[14C]-methyl-THF incorporation (which improved with hydroxocobalamin supplementation), impaired synthesis of Ado-Cbl and Me-Cbl (Table S2), and failure to complement respective cblC cell lines.
Table 1.
Clinical and Biochemical Features of Male Subjects with HCFC1 Variants
| Subject | Age of Onset | Clinical Symptoms | Genetic Testing (Negative) | HCFC1 Variant | Plasma tHcya(μmol/l) | Serum MMAb(μmol/l) | Urine MMAc(mmol/mol creatinine) |
|---|---|---|---|---|---|---|---|
| 1 | 4 months | severe developmental delay, infantile spasms with hypsarrythmia, gyral cortical malformation, microcephaly, chorea, undescended testes, megacolon | MMACHC | c.344C>Td (p.Ala115Val) | 141 | 21.5 | ND |
| 2 | 4 months | severe developmental delay, intractable epilepsy, choreoathetosis, microcephaly, FTT | MMACHC | c.344C>T (p.Ala115Val) | ND | ND | 650 |
| 3 | prenatal | severe developmental delay, neonatal epilepsy, choreoathetosis, congenital microcephaly, FTT | MMACHC | c.344C>T (p.Ala115Val) | ND | ND | elevated |
| 4 | <3 months | infantile spasms with hypsarrythmia, absent development | MMACHC | c.344C>T (p.Ala115Val) | 5 | ND | 201 |
| 5 | 2 months | severe developmental delay, epilepsy, choreoathetosis, neutropenia | MMACHC | c.344C>T (p.Ala115Val) | WNL | ND | 626 |
| 6 | prenatal | severe developmental delay, infantile spasms with hypsarrythmia, microcephaly, IUGR | MMACHC | c.344C>T (p.Ala115Val) | ND | 22.7 | 192 |
| 7 | 4 months | epilepsy, hypotonia | MMACHC | c.344C>T (p.Ala115Val) | 118 | 11.6 | ND |
| 8 | <3 months | severe developmental delay, intractable epilepsy, hypospadias | MMACHC | c.344C>T (p.Ala115Val) | 80 | ND | elevated |
| 9 | <3 months | severe developmental delay, epilepsy, no eye contact, muscular hypotonia, microcephaly | MMACHC | c.344C>T (p.Ala115Val) | 61 | 5.5 | ND |
| 10 | 2 weeks | acute neurologic and metabolic decompensation, ketoacidosis with hyperammonemia, microcephaly, abnormal EEG, death in infancy | MMACHC | c.343G>A (p.Ala115Thr) | ND | elevated | elevated |
| 11 | 5 months | severe developmental delay, intractable epilepsy, choreoathetosis, FTT, ballismus | MMADHC, MMACHC | c.218C>Te (p.Ala73Val) | 9 | 5.7 | 127 |
| 12 | 9 weeks | severe developmental delay, epilepsy, muscular hypotonia, generalized disturbance and delay of myelination on MRI at age 8 years | MMACHC | c.218C>T (p.Ala73Val) | 13 | ND | 329 |
| 13 | 5 weeks | severe developmental delay, epilepsy, FTT | MMACHC | c.217G>A (p.Ala73Thr) | WNL | ND | elevated |
| 14 | prenatal | seizures, blindness, hearing impairment, slight dysmorphia, congenital microcephaly, IUGR, FTT | MMACHC | c.202C>G (p.Gln68Glu) | 87 | 23.0 | elevated |
Abbreviations are as follows: FTT, failure to thrive; IUGR, intrauterine growth retardation; ND, not determined; and WNL, within normal limits.
Normal is <13 μmol/l.
Normal is <0.4 μmol/l.
Normal is undetectable.
Mother was found to carry a de novo variant.
De novo variant.
Figure 1.
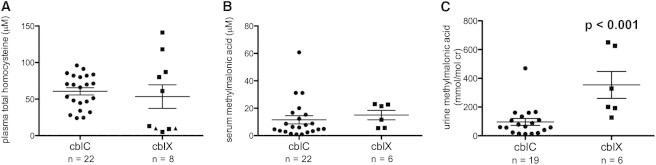
Metabolite Measurements in cblX Subjects Compared to Treated, Early-Onset cblC Subjects
Plasma total homocysteine (tHcy) and serum and urine methylmalonic acid (MMA) were measured in cblX subjects (single measurements) and 23 subjects with early-onset cblC deficiency (1–13 measurements per subject). In cases where multiple measurements were available for the same subject, the mean of all readings was used. n = the total number of subjects in each group.
(A) There was no statically significant difference in plasma tHcy measurements between cblC subjects and cblX subjects (cblC, 60.63 ± 4.88 μM; cblX, 64.25 ± 18.30 μM [mean ± SEM]). Normal levels of plasma tHcy are <13 μM. Triangles indicate two subjects with reportedly normal tHcy (no concentration was provided to the referring diagnostic laboratory).
(B) There was no significant difference in serum MMA measurements between cblC subjects and cblX subjects (cblC, 11.57 ± 2.99 μM; cblX, 15.00 ± 3.43 μM [mean ± SEM]). Normal levels of serum MMA are <0.4 μM.
(C) cblX subjects had higher urine MMA (t test p < 0.001) than did cblC subjects (cblC, 96.52 ± 23.89 mmol/mol creatinine; cblX, 354.20 ± 93.70 mmol/mol creatinine [mean ± SEM]). Normal levels of urine MMA are <4 mmol/mol creatinine.
WES
We selected one male subject (subject 1) with presumed cblC for WES analysis because of his atypical neurological phenotype, which included a gyral cortical malformation that required surgical resection. We first filtered out common variants present in dbSNP and 1000 Genomes and focused on nonsynonymous coding variants, coding indels, and variants affecting splice sites, resulting in 161 rare variants that were considered for further analysis (Table S3). Parental WES data were used for identifying possible pathogenic variants under various inheritance models, including dominant (de novo mutations) and recessive (compound-heterozygous, homozygous, and X-linked hemizygous mutations) models.
Under the recessive model, we identified two candidate genes with potentially pathogenic mutations. The first, TTN, encodes Titin, a giant protein involved in the assembly of cardiac and skeletal muscle. Subject 1 had compound-heterozygous missense changes in TTN: c.61634G>A (p.Arg20545Gln) inherited from his mother and c.77236G>A (p.Val25746Ile) inherited from his father. The only known function of TTN in muscle assembly made it unlikely to play a role in disease etiology. The second candidate, HCFC1 on chromosome X, had a nonsynonymous, missense variant in exon 3, c.344C>T (p.Ala115Val). Sanger sequencing validated the variant in subject 1 and his unaffected carrier mother. This mutation was not found in the subject’s maternal grandparents, suggesting that the mutation might have originated de novo in his mother (Figure S1A). The pleiotropic function of HCFC1 coupled with the recent description of an X-linked form of mental retardation (MRX3 [MIM 309541]) caused by its altered expression prompted further investigations.23
HCFC1 Mutation Screening
Seventeen additional males, the majority of whom had been diagnosed with cblC deficiency by cellular studies but who likewise did not have mutations in MMACHC (Table 1), were identified through a retrospective review of laboratory and clinical data from two international referral centers. Sanger sequencing of the coding exons and splice sites of HCFC1 identified one of five distinct pathogenic missense mutations in 13/17 subjects: three in exon 2 (c.202C>G [p.Gln68Glu], c.217G>A [p.Ala73Thr], and c.218C>T [p.Ala73Val]) and two in exon 3 (c.343G>A [p.Ala115Thr] and c.344C>T [p.Ala115Val]). The missense changes affect three highly conserved amino acids: Gln68, Ala73, and Ala115 (Figure 2). The mutation present in the index case, c.344C>T (p.Ala115Val), was the most frequent and was present in nine of the subjects.
Figure 2.
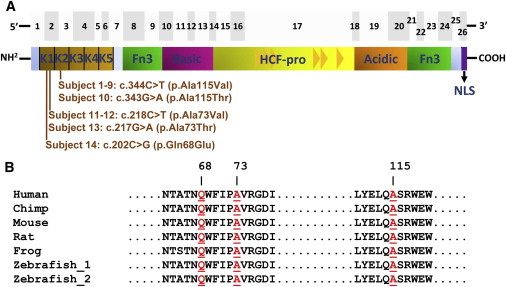
Pathogenic Variants of HCFC1 in cblX
(A) The top panel shows the 26 exons of HCFC1 as gray boxes. The bottom panel shows the predicted HCFC1 domains, including the kelch domain (kelch motifs K1–K5), Fn3 (fibronectin type 3), the basic domain, HCF-proteolysis repeats (HCF-pro; represented as triangles), the acidic domain, and NLS (nuclear localization signal) domains (adapted from Wilson et al.24). The HCFC1 mutations are clustered within exon 2 and 3 of the cDNA, corresponding to the first (K1) and second (K2) kelch motifs, respectively, in HCFC1.
(B) Comparative analysis of HCFC1 from multiple species demonstrated that Gln68, Ala73, and Ala115 (highlighted in red) are evolutionarily conserved throughout vertebrates.
Parental samples were only available for subject 1, whose mother was a carrier, and subject 11, whose parents were both negative for the c.218C>T (p.Ala73Val) change (the fact that subject 11’s parents were negative for the mutation suggests that it arose de novo). Sanger sequencing of HCFC1 in 100 normal controls (50 individuals of European descent and 50 African Americans; Human Variation Panel, Coriell Institute) identified a single African American female carrier (NA17132) of the c.344C>T mutation. We concurrently analyzed exome data from 7,597 controls (6,503 from the National Heart, Lung, and Blood Institute [NHLBI] Exome Sequencing Project Exome Variant Server and 1,094 from 1000 Genomes) and did not discover any of the variants detected in our cohort.
HCFC1 contains a kelch domain with five kelch motifs, fibronectin-like domains, and an HCF-proteolysis domain with six HCF repeats24 (Figure 2). The five mutations identified in the cblX individuals affect Gln68, Ala73, and Ala115 within adjacent kelch motifs (Figure 2) and are predicted to be deleterious (Table S4). Furthermore, the predicted three-dimensional structure of wild-type HCFC1 (Figure S2) places Gln68, Ala73, and Ala115 in close proximity to each other. Interestingly, the introduction of the Ala73 and Ala115 substitutions leads to a conformational change in the HCFC1 structure predicted by Modeller17 (Figures S2B, S2D, and S2E), suggesting that the observed missense mutations could alter the protein structure of HCFC1.
Binding Sites of the THAP11-HCFC1 Complex
ChIP-seq studies in mouse embryonic stem cells10 have previously shown that the THAP11-HCFC1 complex binds consensus-sequence motifs in genes encoding enzymes of cobalamin metabolism, e.g., MMACHC, MTR, and ABCD4 (MIM 603214), as well as SUCLG1 (MIM 611224). SUCLG1 encodes a Krebs-cycle enzyme, and mutations in this gene cause a severe form of isolated methylmalonic aciduria.25 We identified orthologous, conserved binding motifs for the THAP11-HCFC1 complex in human MMACHC, MTR, ABCD4, and SUCLG1 (Figure S3), suggesting that the expression of human MMACHC and possibly other cobalamin metabolism enzymes is regulated by the THAP11-HCFC1 complex.
Analysis of RNA and Protein Expression
To further characterize the functional consequences of the observed HCFC1 mutations in vitro, we examined the expression of various enzymatic targets—MMACHC, MMADHC, MTR, SUCLG1, and ABCD4—in skin fibroblasts from two cblX individuals (subjects 1 and 11) by using qPCR and immunoblots (Figure 3). Whereas expression levels of MMADHC, MTR, SUCLG1 and ABCD4 in subjects 1 and 11 were similar to those in two control fibroblast lines, MMACHC mRNA and MMACHC expression levels (Figures 3A and 3B) were severely reduced in the affected individuals. The expression levels of HCFC1 mRNA (Figure 3A) and HCFC1 (Figure 3C and Figure S4) were similar in the fibroblasts of control and affected individuals, showing that the missense mutations in HCFC1 do not affect its expression but apparently inhibit its function in the transcriptional activation of MMACHC.
Figure 3.
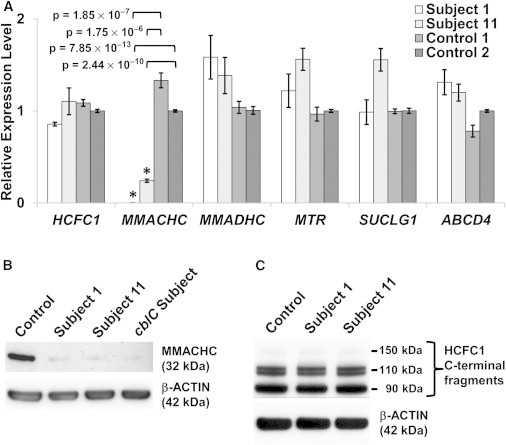
Expression Analysis
(A) qPCR analysis of mRNA expression. MMACHC expression was either completely lost or reduced by ∼76% in fibroblasts derived from subjects 1 and 11, respectively (asterisks indicate statistical significance). Error bars represent the SEM of relative expression levels. The two control samples used were from healthy individuals with no known biochemical or neurological phenotypes.
(B) Immunoblot analysis of MMACHC. Fibroblast lysates from a reference (control) sample (human dermal fibroblast C-013-5C, Life Technologies), two individuals with cblX, and one with cblC were analyzed. The cblX (lanes 2 and 3) and cblC (lane 4) lines show only trace amounts of MMACHC (top panel).
(C) Immunoblot analysis of HCFC1. Fibroblast lysates from the same control used in (B) and two cblX cell lines were analyzed. HCFC1 levels in all the samples remained unchanged. β-actin was used as a loading control in all immunoblots (in the bottom of B and C).
Functional Analysis of HCFC1 by siRNA Knockdown
In order to further demonstrate the regulatory role of HCFC1 in MMACHC transcription, we performed siRNA knockdown of HCFC1 in HEK293 cells. The reduction in HCFC1 expression resulted in the coordinate downregulation of MMACHC in siRNA-treated cells, but not in untreated control cells (Figure 4). This suggests that HCFC1 regulates the expression of MMACHC, explaining the lower levels of MMACHC expression in the fibroblasts of affected individuals (Figure 3). This is further supported by the observation that fibroblasts from cblX individuals produced excessive methylmalonate as a result of reduced MMACHC expression, which normalized after cobalamin supplementation (Figure S5).
Figure 4.
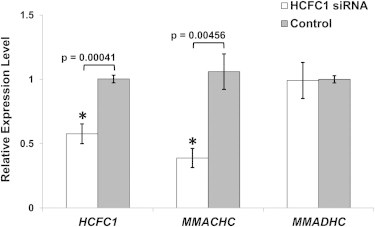
siRNA Knockdown of HCFC1
HEK293 cells were transfected with HCFC1-specific siRNA or scrambled siRNA (control), and the relative expression of HCFC1 and MMACHC was assayed by qPCR using ACTB (β-actin) as an endogenous control. Compared to control cells (average expression levels were fixed at 1), siRNA-treated cells had significantly reduced HCFC1 (0.275) and MMACHC (0.424) expression levels, but the MMADHC expression level remain unchanged. Error bars represent the SEM of relative expression levels.
Discussion
WES of the index case and his unaffected parents allowed us to discover the mutation underlying his complex clinical phenotype, which included an apparent cblC deficiency combined with severe neurological phenotypes. HCFC1, unlike other genes associated with cobalamin disorders, does not encode an enzyme in the cobalamin pathway. It is in fact a predicted transcriptional coregulator of enzymes involved in cobalamin metabolism, including that encoded by MMACHC, mutations in which are responsible for cblC deficiency.2 The location of HCFC1 on human chromosome X, combined with the existence of several males with apparent cblC deficiency and no MMACHC mutations,2,9 led us to predict that this disorder might represent an X-linked disorder affecting males. Indeed, we identified HCFC1 mutations in 13/17 additional male subjects with biochemical and cellular findings that were similar to the index case, leading us to designate this cobalamin disorder cblX.
All of the mutations discovered in our cohort affect conserved amino acids in two of the five kelch motifs within the HCFC1 kelch domain. Kelch domains are typically repetitive antiparallel β sheets and are known to mediate protein-protein interactions, catalytic activity, and transportation.26,27 The HCFC1 kelch domain recognizes a conserved HCFC1 binding motif,28,29 which is important for protein-protein interaction with its transcriptional-regulation partners.30–33 HCFC1 is known to interact with diverse proteins to regulate a variety of processes, including the cell cycle, proliferation, and transcription,30,34,35 and exerts control on targets through THAPs, specifically THAP11.10,11 Thus, mutations that interfere with the interaction between HCFC1 and its transcriptional-regulation partners are likely to affect the expression of a wide range of downstream effectors. It is noteworthy that HCFC1 interacts with many other transcription factors, such as E2Fs, MLLs, CREB, BAP1, and SETD1A, through the kelch domain and subsequently has an extensive effect on transcription activities.29,30,32,34 In a recent study, the HCFC1 complex was shown to be bound to ∼5,400 (24%) promoters of the human transcriptome, including the THAP11 promoter.36
The most obvious question that we needed to address next was how mutations in HCFC1 might affect cobalamin metabolism and the apparent cblC deficiency observed in the cblX individuals. We first demonstrated that predicted binding motifs for the THAP11-HCFC1 complex exist in the regions flanking human MMACHC, as well as other genes encoding components of the cobalamin pathway. We then showed that expression levels of both MMACHC mRNA and MMACHC were severely reduced in skin fibroblasts from cblX individuals. Furthermore, siRNA knockdown of HCFC1 expression in HEK293 cells led to coordinate downregulation of MMACHC transcription. Thus, our data strongly support a model in which the THAP11-HCFC1 complex controls the expression of MMACHC. Mutations that affect binding of HCFC1 and THAP11 could then lead to the cellular and biochemical phenotype of cblC deficiency as a result of a reduction in the expression of MMACHC.
The discovery of mutations in HCFC1 as the cause of the cblX disorder highlights perturbation of transcription as the cause of a classical inborn error of metabolism. Although cblC and cblX share some clinical features, cblX individuals were not documented to have the specific bulls-eye maculopathy, which is a frequent finding in cblC.5 Furthermore, the neurological features were more severe (e.g., brain malformation, infantile spasms, movement disorders) in cblX individuals, suggesting that MMACHC deficiency alone does not explain all of the clinical manifestations. The pathophysiology underlying the complex phenotype remains to be fully elucidated but most likely involves dysregulation of other HCFC1 targets. The recent discovery of variants in the regulatory regions of HCFC1 as a possible cause of nonsyndromic intellectual disability has implicated HCFC1 in brain development and function23 and, together with the data presented here, suggests that the metabolic manifestations of MMACHC deficiency, along with mutation analysis of HCFC1, should be assessed in individuals with idiopathic X-linked intellectual disability.
We conclude that missense mutations affecting the kelch domain of HCFC1 lead to combined methylmalonic acidemia and hyperhomocysteinemia, establishing a functional relationship between HCFC1 and cobalamin metabolism. This distinct disorder establishes locus heterogeneity for cblC deficiency, most likely mediated by the transcriptional regulation of genes involved in cobalamin metabolism by HCFC1, and demonstrates that an inborn error of metabolism can be caused by transcriptional dysregulation.
Acknowledgments
We are grateful to Renata Gallagher, Janet Thomas, Laura Pickler, and Cynthia Freehauf for their input and advice on the clinical aspects of this project and for their contribution to the care of affected individuals, to Leah Ladores for biochemical and complementation analysis, and to the referring physicians. This work was supported in part by a National Institutes of Health grant (GM081519) to T.H.S. and funds and services from the Colorado Intellectual and Developmental Disabilities Research Center. A.Q. was supported by a grant for postdoctoral research training (T32MH015442), and U.S. was supported by the 2012 Pediatrics Student Research Program at Children’s Hospital Colorado. J.L.S., N.P.A., I.M., and C.P.V. were supported by the Intramural Research Program of the National Human Genome Research Institute. D.S.R. was supported by an operating grant from the Canadian Institutes of Health Research (CIHR-M08-15078). M.R.B and B.F. were supported by a grant from the Swiss National Science Foundation (31003A_138521).
Supplemental Data
Web Resources
The URLs for data presented herein are as follows:
1000 Genomes, http://www.1000genomes.org/
Burrows-Wheeler Aligner, http://bio-bwa.sourceforge.net/
ENZYME, http://enzyme.expasy.org/
Galaxy, http://main.g2.bx.psu.edu/
Integrative Genomics Viewer, http://www.broadinstitute.org/igv/
NHLBI Exome Sequencing Project (ESP) Exome Variant Server, http://evs.gs.washington.edu/EVS/
Online Mendelian Inheritance in Man (OMIM), http://www.omim.org/
SAMtools, http://samtools.sourceforge.net/
SeattleSeq, http://snp.gs.washington.edu/SeattleSeqAnnotation134/
UCSC Genome Browser, http://genome.ucsc.edu/
References
- 1.Watkins D., Rosenblatt D.S. Inborn errors of cobalamin absorption and metabolism. Am. J. Med. Genet. C. Semin. Med. Genet. 2011;157:33–44. doi: 10.1002/ajmg.c.30288. [DOI] [PubMed] [Google Scholar]
- 2.Lerner-Ellis J.P., Anastasio N., Liu J., Coelho D., Suormala T., Stucki M., Loewy A.D., Gurd S., Grundberg E., Morel C.F. Spectrum of mutations in MMACHC, allelic expression, and evidence for genotype-phenotype correlations. Hum. Mutat. 2009;30:1072–1081. doi: 10.1002/humu.21001. [DOI] [PubMed] [Google Scholar]
- 3.Martinelli D., Deodato F., Dionisi-Vici C. Cobalamin C defect: natural history, pathophysiology, and treatment. J. Inherit. Metab. Dis. 2011;34:127–135. doi: 10.1007/s10545-010-9161-z. [DOI] [PubMed] [Google Scholar]
- 4.Carrillo-Carrasco N., Chandler R.J., Venditti C.P. Combined methylmalonic acidemia and homocystinuria, cblC type. I. Clinical presentations, diagnosis and management. J. Inherit. Metab. Dis. 2012;35:91–102. doi: 10.1007/s10545-011-9364-y. [DOI] [PMC free article] [PubMed] [Google Scholar]
- 5.Carrillo-Carrasco N., Venditti C.P. Combined methylmalonic acidemia and homocystinuria, cblC type. II. Complications, pathophysiology, and outcomes. J. Inherit. Metab. Dis. 2012;35:103–114. doi: 10.1007/s10545-011-9365-x. [DOI] [PMC free article] [PubMed] [Google Scholar]
- 6.Coelho D., Suormala T., Stucki M., Lerner-Ellis J.P., Rosenblatt D.S., Newbold R.F., Baumgartner M.R., Fowler B. Gene identification for the cblD defect of vitamin B12 metabolism. N. Engl. J. Med. 2008;358:1454–1464. doi: 10.1056/NEJMoa072200. [DOI] [PubMed] [Google Scholar]
- 7.Rutsch F., Gailus S., Miousse I.R., Suormala T., Sagné C., Toliat M.R., Nürnberg G., Wittkampf T., Buers I., Sharifi A. Identification of a putative lysosomal cobalamin exporter altered in the cblF defect of vitamin B12 metabolism. Nat. Genet. 2009;41:234–239. doi: 10.1038/ng.294. [DOI] [PubMed] [Google Scholar]
- 8.Coelho D., Kim J.C., Miousse I.R., Fung S., du Moulin M., Buers I., Suormala T., Burda P., Frapolli M., Stucki M. Mutations in ABCD4 cause a new inborn error of vitamin B12 metabolism. Nat. Genet. 2012;44:1152–1155. doi: 10.1038/ng.2386. [DOI] [PubMed] [Google Scholar]
- 9.Lerner-Ellis J.P., Tirone J.C., Pawelek P.D., Doré C., Atkinson J.L., Watkins D., Morel C.F., Fujiwara T.M., Moras E., Hosack A.R. Identification of the gene responsible for methylmalonic aciduria and homocystinuria, cblC type. Nat. Genet. 2006;38:93–100. doi: 10.1038/ng1683. [DOI] [PubMed] [Google Scholar]
- 10.Dejosez M., Levine S.S., Frampton G.M., Whyte W.A., Stratton S.A., Barton M.C., Gunaratne P.H., Young R.A., Zwaka T.P. Ronin/Hcf-1 binds to a hyperconserved enhancer element and regulates genes involved in the growth of embryonic stem cells. Genes Dev. 2010;24:1479–1484. doi: 10.1101/gad.1935210. [DOI] [PMC free article] [PubMed] [Google Scholar]
- 11.Parker J.B., Palchaudhuri S., Yin H., Wei J., Chakravarti D. A transcriptional regulatory role of the THAP11-HCF-1 complex in colon cancer cell function. Mol. Cell. Biol. 2012;32:1654–1670. doi: 10.1128/MCB.06033-11. [DOI] [PMC free article] [PubMed] [Google Scholar]
- 12.Li H., Durbin R. Fast and accurate short read alignment with Burrows-Wheeler transform. Bioinformatics. 2009;25:1754–1760. doi: 10.1093/bioinformatics/btp324. [DOI] [PMC free article] [PubMed] [Google Scholar]
- 13.Robinson J.T., Thorvaldsdóttir H., Winckler W., Guttman M., Lander E.S., Getz G., Mesirov J.P. Integrative genomics viewer. Nat. Biotechnol. 2011;29:24–26. doi: 10.1038/nbt.1754. [DOI] [PMC free article] [PubMed] [Google Scholar]
- 14.Li H., Handsaker B., Wysoker A., Fennell T., Ruan J., Homer N., Marth G., Abecasis G., Durbin R., 1000 Genome Project Data Processing Subgroup The Sequence Alignment/Map format and SAMtools. Bioinformatics. 2009;25:2078–2079. doi: 10.1093/bioinformatics/btp352. [DOI] [PMC free article] [PubMed] [Google Scholar]
- 15.Goecks J., Nekrutenko A., Taylor J., Galaxy Team Galaxy: a comprehensive approach for supporting accessible, reproducible, and transparent computational research in the life sciences. Genome Biol. 2010;11:R86. doi: 10.1186/gb-2010-11-8-r86. [DOI] [PMC free article] [PubMed] [Google Scholar]
- 16.Goujon M., McWilliam H., Li W., Valentin F., Squizzato S., Paern J., Lopez R. A new bioinformatics analysis tools framework at EMBL-EBI. Nucleic Acids Res. 2010;38(Web Server issue):W695–W699. doi: 10.1093/nar/gkq313. [DOI] [PMC free article] [PubMed] [Google Scholar]
- 17.Eswar N., Webb B., Marti-Renom M.A., Madhusudhan M.S., Eramian D., Shen M.-Y., Pieper U., Sali A. Comparative protein structure modeling using Modeller. Curr. Protoc. Bioinformatics. 2006;Chapter 5:6. doi: 10.1002/0471250953.bi0506s15. [DOI] [PMC free article] [PubMed] [Google Scholar]
- 18.Nielsen M., Lundegaard C., Lund O., Petersen T.N. CPHmodels-3.0—remote homology modeling using structure-guided sequence profiles. Nucleic Acids Res. 2010;38(Web Server issue):W576–W581. doi: 10.1093/nar/gkq535. [DOI] [PMC free article] [PubMed] [Google Scholar]
- 19.Pettersen E.F., Goddard T.D., Huang C.C., Couch G.S., Greenblatt D.M., Meng E.C., Ferrin T.E. UCSF Chimera—a visualization system for exploratory research and analysis. J. Comput. Chem. 2004;25:1605–1612. doi: 10.1002/jcc.20084. [DOI] [PubMed] [Google Scholar]
- 20.Kent W.J., Sugnet C.W., Furey T.S., Roskin K.M., Pringle T.H., Zahler A.M., Haussler D. The human genome browser at UCSC. Genome Res. 2002;12:996–1006. doi: 10.1101/gr.229102. [DOI] [PMC free article] [PubMed] [Google Scholar]
- 21.Rice P., Longden I., Bleasby A. EMBOSS: the European Molecular Biology Open Software Suite. Trends Genet. 2000;16:276–277. doi: 10.1016/s0168-9525(00)02024-2. [DOI] [PubMed] [Google Scholar]
- 22.Sloan J.L., Johnston J.J., Manoli I., Chandler R.J., Krause C., Carrillo-Carrasco N., Chandrasekaran S.D., Sysol J.R., O’Brien K., Hauser N.S., NIH Intramural Sequencing Center Group Exome sequencing identifies ACSF3 as a cause of combined malonic and methylmalonic aciduria. Nat. Genet. 2011;43:883–886. doi: 10.1038/ng.908. [DOI] [PMC free article] [PubMed] [Google Scholar]
- 23.Huang L., Jolly L.A., Willis-Owen S., Gardner A., Kumar R., Douglas E., Shoubridge C., Wieczorek D., Tzschach A., Cohen M. A noncoding, regulatory mutation implicates HCFC1 in nonsyndromic intellectual disability. Am. J. Hum. Genet. 2012;91:694–702. doi: 10.1016/j.ajhg.2012.08.011. [DOI] [PMC free article] [PubMed] [Google Scholar]
- 24.Wilson A.C., Boutros M., Johnson K.M., Herr W. HCF-1 amino- and carboxy-terminal subunit association through two separate sets of interaction modules: involvement of fibronectin type 3 repeats. Mol. Cell. Biol. 2000;20:6721–6730. doi: 10.1128/mcb.20.18.6721-6730.2000. [DOI] [PMC free article] [PubMed] [Google Scholar]
- 25.Chandler R.J., Venditti C.P. Genetic and genomic systems to study methylmalonic acidemia. Mol. Genet. Metab. 2005;86:34–43. doi: 10.1016/j.ymgme.2005.07.020. [DOI] [PMC free article] [PubMed] [Google Scholar]
- 26.Ito N., Phillips S.E., Stevens C., Ogel Z.B., McPherson M.J., Keen J.N., Yadav K.D., Knowles P.F. Novel thioether bond revealed by a 1.7 A crystal structure of galactose oxidase. Nature. 1991;350:87–90. doi: 10.1038/350087a0. [DOI] [PubMed] [Google Scholar]
- 27.Adams J., Kelso R., Cooley L. The kelch repeat superfamily of proteins: propellers of cell function. Trends Cell Biol. 2000;10:17–24. doi: 10.1016/s0962-8924(99)01673-6. [DOI] [PubMed] [Google Scholar]
- 28.Lu R., Yang P., O’Hare P., Misra V. Luman, a new member of the CREB/ATF family, binds to herpes simplex virus VP16-associated host cellular factor. Mol. Cell. Biol. 1997;17:5117–5126. doi: 10.1128/mcb.17.9.5117. [DOI] [PMC free article] [PubMed] [Google Scholar]
- 29.Freiman R.N., Herr W. Viral mimicry: common mode of association with HCF by VP16 and the cellular protein LZIP. Genes Dev. 1997;11:3122–3127. doi: 10.1101/gad.11.23.3122. [DOI] [PMC free article] [PubMed] [Google Scholar]
- 30.Tyagi S., Chabes A.L., Wysocka J., Herr W. E2F activation of S phase promoters via association with HCF-1 and the MLL family of histone H3K4 methyltransferases. Mol. Cell. 2007;27:107–119. doi: 10.1016/j.molcel.2007.05.030. [DOI] [PubMed] [Google Scholar]
- 31.Knez J., Piluso D., Bilan P., Capone J.P. Host cell factor-1 and E2F4 interact via multiple determinants in each protein. Mol. Cell. Biochem. 2006;288:79–90. doi: 10.1007/s11010-006-9122-x. [DOI] [PubMed] [Google Scholar]
- 32.Machida Y.J., Machida Y., Vashisht A.A., Wohlschlegel J.A., Dutta A. The deubiquitinating enzyme BAP1 regulates cell growth via interaction with HCF-1. J. Biol. Chem. 2009;284:34179–34188. doi: 10.1074/jbc.M109.046755. [DOI] [PMC free article] [PubMed] [Google Scholar]
- 33.Mazars R., Gonzalez-de-Peredo A., Cayrol C., Lavigne A.-C., Vogel J.L., Ortega N., Lacroix C., Gautier V., Huet G., Ray A. The THAP-zinc finger protein THAP1 associates with coactivator HCF-1 and O-GlcNAc transferase: a link between DYT6 and DYT3 dystonias. J. Biol. Chem. 2010;285:13364–13371. doi: 10.1074/jbc.M109.072579. [DOI] [PMC free article] [PubMed] [Google Scholar]
- 34.Wysocka J., Myers M.P., Laherty C.D., Eisenman R.N., Herr W. Human Sin3 deacetylase and trithorax-related Set1/Ash2 histone H3-K4 methyltransferase are tethered together selectively by the cell-proliferation factor HCF-1. Genes Dev. 2003;17:896–911. doi: 10.1101/gad.252103. [DOI] [PMC free article] [PubMed] [Google Scholar]
- 35.Yu H., Mashtalir N., Daou S., Hammond-Martel I., Ross J., Sui G., Hart G.W., Rauscher F.J., 3rd, Drobetsky E., Milot E. The ubiquitin carboxyl hydrolase BAP1 forms a ternary complex with YY1 and HCF-1 and is a critical regulator of gene expression. Mol. Cell. Biol. 2010;30:5071–5085. doi: 10.1128/MCB.00396-10. [DOI] [PMC free article] [PubMed] [Google Scholar]
- 36.Michaud J., Praz V., James Faresse N., Jnbaptiste C.K., Tyagi S., Schütz F., Herr W. HCFC1 is a common component of active human CpG-island promoters and coincides with ZNF143, THAP11, YY1, and GABP transcription factor occupancy. Genome Res. 2013;23:907–916. doi: 10.1101/gr.150078.112. [DOI] [PMC free article] [PubMed] [Google Scholar]
Associated Data
This section collects any data citations, data availability statements, or supplementary materials included in this article.