

Abstract
Changes in fatty acid (FA) and glycerophospholipid (GPL) metabolism associated with cell cycle entry are not fully understood. In this study FA-GPL remodeling was investigated in resting and proliferating primary human T cells. Significant changes were measured in the composition and distribution of FAs in GPLs following receptor activation of human T cells. The FA distribution of proliferating T cells was very similar to that of the human Jurkat T cell line and when the stimulus was removed from proliferating T cells, they stopped proliferating and the FA distribution largely reverted back to that of resting T cells. The cellular content of saturated and monounsaturated FAs was significantly increased in proliferating cells, which was associated with an induction of FA synthase and stearoyl-CoA desaturase-1 gene expression. Additionally, cellular arachidonate was redistributed in GPLs in a distinct pattern that was unlike any other FAs. This redistribution was associated with an induction of CoA-dependent and CoA-independent remodeling. Accordingly, significant changes in the expression of several acyl-CoA synthetases, lysophospholipid acyltransferases, and phospholipase A2 were measured. Overall, these results suggest that metabolic pathways are activated in proliferating T cells that may represent fundamental changes associated with human cell proliferation.
Keywords: fatty acid synthase, stearoyl-CoA desaturase 1, acyl-CoA synthetase, lysophospholipid acyltransferase, phospholipase A2, arachidonic acid
Cellular proliferation is an essential process for the regeneration of tissues and for certain cellular responses such as host defense. However, uncontrolled or unwanted cell proliferation is implicated in the progression of cancers and inflammatory and autoimmune diseases. In a proliferative state, cells need to synthesize many cellular constituents, including membranes, before cell division can occur. Glycerophospholipids (GPLs) are the major structural lipid component of cellular membranes, but they are present as a very large diverse group of molecular species. Membrane GPLs are divided into major classes based on the nature of the polar head group linked to the sn-3 position of the glycerol moiety, and are further divided into three subclasses based on the nature of the link between the glycerol and the fatty acid (FA) in the sn-1 position. Finally, the large number of combinations of different FAs present in positions sn-1 and sn-2 of GPL greatly increases the molecular diversity of membrane GPLs. The degree of unsaturation of FAs associated with GPLs is known to affect membrane fluidity and many biological processes, however the distribution of these FAs is not homogeneous or static (1–3).
During membrane biogenesis associated with cell proliferation, FA biosynthesis is enhanced and the FAs incorporated into positions sn-1 and sn-2 of phosphatidic acid during de novo biosynthesis of GPLs (Kennedy pathway) are generally saturated FAs (SFAs) and monounsaturated FAs (MUFAs) (2). However, cellular GPLs usually have PUFAs acylated to the sn-2 position, and this incorporation of PUFAs in GPLs only occurs after de novo GPL biosynthesis. This remodeling of GPL species, termed the Lands cycle, is characterized by the hydrolysis of SFAs or MUFAs from the sn-2 position of GPLs by a phospholipase A2 (PLA2) followed by a reacylation with PUFAs by a reaction catalyzed by a lysophospholipid acyl-CoA transferase (LPLAT) (2, 4) (see Fig. 1). Free FAs are activated by an acyl-CoA synthetase (ACSL) to produce the required acyl-CoA. Several PLA2s, LPLATs, and ACSLs having different characteristics and substrate specificities have been recently discovered, and their differential expression is likely responsible for the diversity of GPL molecular species in different tissues (5–11).
Fig. 1.

Schematic representation of FA and GPL biosynthesis and remodeling. During de novo biosynthesis of GPLs by the Kennedy pathway, SFAs and MUFAs are mainly incorporated in position sn-1 and sn-2 of the newly synthesized GPLs. These FAs are biosynthesized by FASN and SCD-1. PUFAs are incorporated into GPLs by Lands cycle remodeling, which is characterized by the hydrolysis of SFAs or MUFAs from the sn-2 position of GPLs by a PLA2 followed by a reacylation with PUFAs by a LPLAT. Free FA must be activated by an ACSL to produce the acyl-CoA required for its incorporation in the 2-lyso-GPL previously produced by the PLA2. Highly unsaturated long chain PUFAs, like AA (20:4n-6), which are mainly incorporated into 1-acyl-glycerophosphatidylcholine (GPC) in the Lands cycle, are directly transferred to other specific GPL species [1-acyl-glycerophosphatidylethanolamine (GPE), 1-alk-enyl-GPE, and 1-alkyl-GPC] by the CoA-IT. This CoA-independent remodeling is involved in the maturation of GPLs and the distribution of the AA in GPLs.
The FA distribution in GPLs may also be modulated by a CoA-independent transacylase (CoA-IT) (2). This transacylation is specific for highly unsaturated long chain PUFAs like arachidonic acid (AA) (20:4n-6) and is characterized by their direct transfer from diacyl-phosphatidylcholine (PC) species to 1-acyl-phosphatidylethanolamine (PE), 1-alk-enyl-PE, and 1-alkyl-PC species without requirement of cofactors, Mg2+ or Ca2+ (2, 12–18). The protein responsible for the CoA-independent remodeling has not been identified; however compounds that inhibit its activity have been described (19–23).
Figure 1 summarizes the main paths by which cellular PUFAs are incorporated into and remodeled within membrane GPLs. There are still many unanswered questions regarding PUFA metabolism when cells enter the cell cycle, including the nature of changes in the composition of GPLs and which of the several newly-discovered ACSL, LPLAT, and PLA2 isoforms may be implicated. In this study, the composition and remodeling of FAs in GPL classes and subclasses and the expression of some key enzymes believed to be associated with PUFA metabolism were measured in primary human T lymphocytes, a model in which resting nonproliferating cells can be induced to enter the cell cycle.
EXPERIMENTAL PROCEDURES
Reagents
Lymphocyte separation medium was purchased from Wisent (St-Bruno, QC, Canada). Human recombinant IL-2, boron trifluoride (14% in methanol), phospholipase C from Bacillus cereus, 2,3,4,5,6-pentafluorobenzyl bromide, and N,N-diisopropylethylamine were from Sigma-Aldrich (Oakville, ON, Canada). The [3H]AA and [14C]arachidonoyl-CoA were purchased from American Radiolabeled Chemicals Inc. (St. Louis, MO). The 1-stearoyl-2-hydroxy-sn-glycero-3-phosphocholine and 1-stearoyl-2-hydroxy-sn-glycero-3-phosphoethanolamine were from Avanti Polar Lipids (Alabaster, AL). The L-α-lysophosphatidylinositol was from EMD Millipore (Billerica, MA). The 1,2-diheptadecanoyl-PC was from Biolynx (Brockville, ON, Canada). The silica gel G TLC plates (20 × 20 cm, 250 μm) were from Analtech (Newark, DE). The acetylation kit (acetic anhydride/pyridine) was from Alltech (Deerfield, IL). The anti-CD3 was purified from the OKT3 hybridoma clone (American Type Culture Collection) culture medium using HiTrap Protein G HP columns from GE Healthcare Bio-Sciences (Uppsala, Sweden). Fatty acid methyl esters (FAMEs) and free FAs were from Nu-check Prep (Elysian, MN) and octadeuterated AA (5,8,11,14-eicosatetraenoic-5,6,8,9,11,12,14,15-d8 acid, 2H8-AA) was from Cayman Chemical (Ann Arbor, MI). FITC-labeled anti-CD3 was from Beckman Coulter (Mississauga, ON, Canada). The human CD3 positive and human T cell negative selection kits were from STEMCELL Technologies Inc. (Vancouver, BC, Canada). The anti-fatty acid synthase (FASN) (ab96863), anti-stearoyl-CoA desaturase 1 (SCD1) (ab19862), and anti-lysophosphatidylcholine acyltransferase (LPCAT)2 (ab88871) were from Abcam (Toronto, ON, Canada). The anti-LPCAT3 (PAG531Hu01) was from USCN (Wuhan Hubei, China) and the anti-lysophosphatidylinositol acyltransferase (LPIAT)1 (NBP1-69610) was from Novus (Oakville, ON, Canada). The anti-PLA2 IVC (C15308) was from Assay Biotechnology Co. (Sunnyvale, CA) and the horseradish peroxidase-conjugated anti-β-actin (A3854) was from Sigma-Aldrich.
Lymphocyte isolation and culture
Human peripheral blood mononuclear cells (PBMCs) were obtained from the buffy coat following centrifugation of heparinized blood from healthy donors on lymphocyte separation medium as previously described (24). PBMCs were incubated in RPMI 1640 with 10% FBS (1 × 10⁶ cells/ml) with or without 1 μg/ml anti-CD3 for 3 days at 37°C in a 5% CO2 atmosphere. IL-2 (20 U/ml) was added to anti-CD3-treated cells at 24 h postincubation to induce the T cell proliferation (25). In some experiments, the IL-2 and anti-CD3 were removed from proliferating cells on day 4 (stimulated to non-stimulated cells; S-NS) and cells were incubated for another 3 days without stimulation. After incubations primary T cells were then purified with the EasySep® human CD3 positive selection kit.
Flow cytometry analysis
The purity of T cells (>99%) was determined by flow cytometry (CytomicsTM FC 500; Beckman Coulter) using FITC-labeled anti-CD3. Cell cycle analysis was performed by flow cytometry as previously described (26).
Pulse labeling of cells with [3H]AA (remodeling)
After 3 days of incubation with or without stimulation, cells were pulse labeled by incubating in 1 ml of culture medium containing (1 μCi [3H]AA/107 cells) for 30 min at 37°C. Cells were then washed twice with culture medium and resuspended in their original incubation medium. T cells were then purified at 0, 4, or 24 h, the lipids were extracted, the GPL classes and subclasses were separated as described below, and the radioactivity was measured by liquid scintillation counting (Beckman Instruments LS 5000 CE) (25).
Lipid extraction and fractionation
Cellular lipids were extracted (27), GPL classes were separated by HPLC (28), and fractions containing PE, PC, and phosphatidylinositol (PI)/phosphatidylserine (PS) were collected using elution times determined with GPL standards. The GPL subclasses were processed and separated as previously described (18), and the FA mass was measured in each fraction by GC-MS as described below.
FA analysis
For measurement of FA mass in GPL classes, diheptadecanoyl-PC was added to each HPLC fraction as an internal standard. The different fractions were saponified with 0.5M KOH in methanol (100°C, 15 min) and FAMEs were prepared by adding 14% BF3 in methanol (100°C, 10 min). FAMEs were extracted in hexane and quantified by gas chromatography with flame ionization detection (GC-FID) using a 30 m trace-FAME column on a Thermo Trace gas chromatograph (Thermo Electron Corporation, Mississauga, ON, Canada) (29). Authentic FAME standards were used for the identification of FA peak retention times and for standard curve quantification.
To have more sensitivity for the measurement of unsaturated FA mass in PC and PE subclasses, penta-fluorobenzyl esters of FAs were prepared and measured by negative ion chemical ionization GC-MS (18) using a Polaris Q mass spectrometer (Thermo Electron Corporation) using the internal standard 2H8-AA. The negative chemical ionization ion trap scan was 200–400 uma, 1 ml/min of methane (220°C) was used as carrier, and 0.3 ml/min of helium was used as damping gas. Authentic free FA standards were also derivatized and used as standard curve for quantification.
Lipid phosphorus assay
Lipid phosphorus in the different GPL fractions was measured as previously described (30). GPL fractions were collected using sodium acetate buffer, 25 mM (pH 7.4), in HPLC solvents to avoid phosphate in these experiments.
Enzyme activity assays
Resting and proliferating T cells at day 3 were sonicated (3 × 10 s at 40% of amplitude) in sonication buffer (250 mM sucrose, 50 mM tris-HCl (pH 7.4), 1 mM EDTA, and 20% glycerol) and centrifuged at 1,500 g for 10 min to pellet unbroken cells. Proteins were quantified by the modified Lowry assay (31).
ACSL activity was measured as previously described (32) with minor modifications. Briefly, 50 μg of cell lysate protein in 100 μl of a solution containing 100 mM Tris-HCl (pH 8), 20 mM MgCl2, 10 mM ATP, 1 mM CoA, 1 mM 2-ME, and 10 μM [3H]AA (0.5 μCi) was incubated at 37°C for 10 min. The reactions were stopped by adding 2.25 ml 2-propanol/heptane/2M sulfuric acid (40:10:1, v/v/v). Phase separation was obtained after addition of 1.5 ml heptane and 1 ml water. The aqueous phases were collected and extracted twice with heptane containing 4 mg/ml linoleic acid, and the radioactivity in the aqueous phase and in the dried heptane fractions was measured by liquid scintillation counting.
Lysophospholipid acyltransferase activity was measured as previously described (33, 34) with minor modifications. Briefly, 2–4 μg of cell lysate protein in 100 μl of buffer containing 10 mM Tris-HCl (pH 7.4), 150 mM NaCl, 1 mM EDTA, 12.5 μM BSA, 18 μM [14C]AA-CoA (0.1 μCi), and 0–50 μM of 1-18:0-2-lyso-PC, 1-18:0-2-lyso-PE, or 2-lyso-PI was incubated at 37°C for 5 min. The reactions were stopped by adding chloroform/methanol (1:2, v/v), lipids were extracted (27), and GPL classes were separated by TLC using chloroform/methanol/acetic acid/water (50:25:8:4, v/v/v/v) as mobile phase. Lipids were then visualized with iodine, the GPL spots identified using GPL standards were scraped and measured by liquid scintillation counting.
Gene expression analysis
Cellular mRNA was extracted with Trizol (Invitrogen), purified with the RNeasy Mini Kit (QIAGEN). mRNA integrity was evaluated by electrophoretic migration on a 1% agarose gel. cDNA was obtained using the Quantitect reverse transcription kit (QIAGEN) with 1 μg of RNA. Gene expression was measured by quantitative PCR (ABI 7500, Applied Biosystems) with SsofastTM Evagreen Supermix Low ROX (Bio-Rad) and with Prime Time assay (Integrated DNA Technologies) with PerfeCTa qPCR SuperMix Low ROX (Quanta Biosciences). The efficiency of all primer pairs (Table 1) was evaluated using a standard curve and the stability of the RN18S1 reference gene expression between treatments was evaluated before analysis. All ΔΔCt experiments were performed with 10 ng of RNA reverse transcribed into cDNA. In these experiments, primary T cells were negatively selected with the EasySep® human T cell enrichment kit to avoid cellular activation and gene induction in resting cells.
TABLE 1.
List of primer sequences used in quantitative PCR experiments for each transcript
| Transcript (Accession) | Primers | Sequences | Products (bp) |
| Evagreen | |||
| LPEAT2 (NM_153613) | FWD | GTAGGGAGCTTACCTGTGATTGT | 112 |
| REV | CCACATAGCCAGCGGACA | ||
| LPIAT1 (NM_024298) | FWD | ACCATCCGCAACATCG | 145 |
| REV | CGCTCCGCAGGACATA | ||
| PLA2 IVA (NM_024420) | FWD | TGAGTGACTTTGCCACACAGGACT | 142 |
| REV | AATGTGAGCCCACTGTCCACTACA | ||
| PLA2 IVB (NM_001114633) | FWD | TGGGAACTGTCATCACGC | 202 |
| REV | AAGTGCTCCAACTACTCAACGT | ||
| PLA2 IVC (NM_003706) | FWD | CTGGTGGATGCTGGTTTAG | 141 |
| REV | GCGGCAGTAGTCAGTGGTA | ||
| PLA2 VIA (NM_003560) | FWD | GAGAGCACGGCAACAC | 134 |
| REV | GGAGGCTAGGAATGTA | ||
| RN18S1 (NR_003286) | FWD | GTAACCCGTTGAACCCCATT | 151 |
| REV | CCATCCAATCGGTAGTAGCG | ||
| Prime Time | |||
| FASN (NM_004104) | FWD | AGAACTTGCAGGAGTTCTGGGACA | 149 |
| Probe | 56-FAM/TGTGGACAT/ZEN/GGTCACGGACGATGA/3IABkFQ | ||
| REV | TCCGAAGAAGGAGGCATCAAACCT | ||
| SCD-1 (NM_005063) | FWD | AGTTCTACACCTGGCTTTGG | 137 |
| Probe | 56-FAM/CTCCACAGA/ZEN/CGATGAGCTCCTGC/3IABkFQ | ||
| REV | GTTGGCAATGATCAGAAAGAGC | ||
| FATP4 (NM_005094) | FWD | TGACCCGCCTCATCTGTTCATTCA | 139 |
| Probe | 56-FAM/TAAGCTGAG/ZEN/GGTGTAGCAGGTAAGATGC/3IABkFQ | ||
| REV | AGCCCACACTGTTAAACACCTTGC | ||
| ACSL3 (NM_004457) | FWD | ATTGTGCATACCATGGCTGCAGTG | 197 |
| Probe | 56-FAM/ACACAAGTG/ZEN/GATCCACAGGACTTCCA/3IABkFQ | ||
| REV | TCTGGAATCCTTTCTGCCATCCCA | ||
| ACSL4 (NM_004458) | FWD | TGGGCATTCCTCCAAGTAGACCAA | 129 |
| Probe | 56-FAM/ACTAGTGGT/ZEN/TCTACTGGCCGACCTAA/3IABkFQ | ||
| REV | ACTGGCCTGTCATTCCAGCTATCA | ||
| ACSL5 (NM_016234) | FWD | TCAGTCATGACATTCTTCCGGGCA | 154 |
| Probe | 56-FAM/TGGTCAAAC/ZEN/AGAATGCACAGGTGGCT/3IABkFQ | ||
| REV | CCAGCTTCACGTAATTGCAAGCCA | ||
| ACSL6 (NM_015256) | FWD | AGCTGGCCTGCTACACATATTCCA | 151 |
| Probe | 56-FAM/AGCACCGTG/ZEN/ATTGTGGACAAACCTCA/3IABkFQ | ||
| REV | TCCACATGCTCTAGCAGAAGCACA | ||
| LPCAT2 (NM_017839) | FWD | AGTATGTGATTGGCCTGGCTGTCT | 143 |
| Probe | 56-FAM/TGCAACCCT/ZEN/TCCAACACAGAGGAGAT/3IABkFQ | ||
| REV | TCCAAGGGAAGCCTGTAGAATGGT | ||
| LPCAT3 (NM_005768) | FWD | AACAGACCATCCACTGGCTCTTCA | 120 |
| Probe | 56-FAM/TGCCTCTTC/ZEN/ACGTGGGACAAATGGCTTA/3IABkFQ | ||
| REV | TCAGGAAGAAGATGTGGCCAAGGA | ||
| PLA2 VIB (NM_015723) | FWD | TCATCTGCTGCTCCAGGCTACTTT | 132 |
| Probe | 56-FAM/CCCTTCGGC/ZEN/ATTAGCTATGCATGAGT/3IABkFQ | ||
| REV | CGGCACATCTGGCCAAAGACATTT | ||
| RN18S1 (NR_003286) | FWD | GAGACTCTGGCATGCTAACTAG | 129 |
| Probe | 56-FAM/TGCTCAATC/ZEN/TCGGGTGGCTGAA/3IABkFQ | ||
| REV | GGACATCTAAGGGCATCACAG | ||
FWD, forward; REV, reverse.
Western blot analysis
Resting and proliferating primary T cells were washed with PBS and lysis buffer (150 mM NaCl; 1% Nonidet P-40; 2 mM EDTA; and 50 mM Tris-HCL, pH 7.6) supplemented with protease inhibitor cocktail (Roche) was added to the pellets. Following a quick vortex, 5× Laemmli sample buffer (300 mM Tris-HCL, pH 6.8; 10% SDS; 50% glycerol; 25% β-mercaptoethanol; and 0.05% bromophenol blue) was added and samples were boiled for 10 min. Proteins were quantified by EZQ protein quantitation kit (Molecular Probes) and 20 μg of cellular proteins were separated on Criterion 4–15% polyacrylamide gels (Bio-Rad). Proteins were transferred onto a polyvinylidene fluoride (PVDF) membrane and Western blotting was performed using indicated primary antibodies and horseradish peroxidase-conjugated secondary antibodies. Membranes were washed and developed using Amersham ECL prime (GE Healthcare) and images were captured using an Alpha Innotech Fluorchem imager (San Leandro, CA).
Statistics
Statistical analyses were performed using JMP software (Cary, NC) as described in the figure legends.
Ethics
This study was approved by the Université de Moncton institutional review committee for the research involving human subjects, and all subjects provided informed consent prior to their participation in the study.
RESULTS
Primary T cell culture and proliferation
The proliferation of primary human T cells was induced by incubation of fresh PBMCs with anti-CD3 and IL-2. After 3 days of incubation, the stimulated T cells grew in clusters and the cellular count fold increase was 2.6 ± 0.1 (P ≤ 0.0001, Student's t-test, n = 16) compared with resting cells, in accord with previous reports (25). In experiments where the IL-2 and anti-CD3 stimuli were removed from proliferating cells on day 4 (S-NS), cells ceased to proliferate and cell numbers became stable by day 6 to 7. This is consistent with the previously reported return of T cells to the G0 phase within 72 h after removal of stimuli without induction of cell death (35). The increase in the proportion of cells showing diploid (2n) DNA content (G0/G1) by flow cytometry analysis is consistent with this return to a nonproliferating quiescent phenotype (supplementary Fig. I).
Cellular FA composition
The FA composition and distribution in GPLs of resting and stimulated T cells is shown in Fig. 2. Cell proliferation was associated with a significant increase in mass of nearly all cellular FAs (Fig. 2A), which is consistent with the increase in cell size during blast transformation of T cells (36, 37). The most prominent increases in mass associated with cell proliferation were in the SFA and MUFA content. When the percent FA distribution of the two cell populations is presented, it becomes evident that only MUFAs have become enriched in stimulated T cells (Fig. 2B). Overall, these results suggest that de novo FA biosynthesis is increased in proliferating T cells, and that the cells preferentially shunt the newly synthesized SFAs toward desaturation. This is supported by a significant increase in FASN and stearoyl CoA-desaturase-1 (SCD-1) gene and protein expression in stimulated T cells (Table 2, A; Fig. 3). It is noteworthy that in contrast to all other FAs, the total cellular AA mass did not change with T cell stimulation (Fig. 2A), and as a result its percent content decreased substantially with cell stimulation (Fig. 2B).
Fig. 2.

The mass content of FAs (A) and the FA distribution (B) in total GPLs from resting and proliferating T cells. Lipids were extracted from resting T cells incubated without stimulation for 3 days and proliferating T cells that were incubated with 1 μg/ml anti-CD3 and 20 U/ml IL-2 for 3 days. The FAs were hydrolyzed and transmethylated, and individual FAs were measured by GC-FID. The results are the mean ± SEM of 9–10 independent experiments. *Different from resting cells (P < 0.05) as determined by Student's t-test.
TABLE 2.
Gene expression of selected enzymes in resting and proliferating T cells
| Coded Enzyme | Fold Increase | |
| A | FASN | 9.7 ± 2.1a |
| SCD1 | 169 ± 42a | |
| B | FATP4 | 1.8 ± 0.6 |
| ACSL3 | 3.5 ± 0.4a | |
| ACSL4 | 4.4 ± 0.5a | |
| ACSL5 | 2.1 ± 0.4a | |
| ACSL6 | 13.1 ± 3.9a | |
| C | LPCAT2 | 0.5 ± 0.2a |
| LPCAT3 | 1.5 ± 0.1a | |
| LPEAT2/LPCAT4 | 1.6 ± 0.1a | |
| LPIAT1 | 2.2 ± 0.3a | |
| D | PLA2 IVA | 25.0 ± 8.3a |
| PLA2 IVB | 0.1 ± 0.0a | |
| PLA2 IVC | 39.9 ± 3.8a | |
| PLA2 VIA | 0.8 ± 0.1a | |
| PLA2 VIB | 1.8 ± 0.3a |
RNA from resting T cells incubated without stimulation and proliferating T cells incubated with 1 μg/ml anti-CD3 and 20 U/ml of IL-2 for 3 days was extracted and reverse transcribed into cDNA. Relative quantitative PCR was performed using RN18S1 as reference gene. Values represent the mean ± SEM of fold increase of RNA expression in proliferating T cells compared with resting T cells for three to six independent experiments.
Different from resting cells (P < 0.05) as determined by Student's t-test.
Fig. 3.

FASN and SCD1 expression in resting and proliferating T cells. Proteins (20 μg) from resting T cells and proliferating T cells were separated by SDS-PAGE and transferred on PVDF membrane as described in the Experimental Procedures section. Western blotting was performed using anti-FASN (1:1,000) and anti-SCD1 (1:1,000) antibodies, and anti-β-actin (1:10,000) as loading control. These images are representative of three independent experiments using different donors.
Cellular GPLs
The total fatty acyl content of each GPL class was measured in the different T cell populations (Fig. 4A). The total cellular FAs associated with GPLs increased over 2-fold in proliferating T cells compared with resting cells. This increased total cellular GPL content was maintained following removal of the stimulus (S-NS) and was similar to that measured in the human Jurkat T cell line. Although the amount of total FAs associated with each class of GPLs increased with T cell stimulation, the relative distribution of total FAs between the different GPL classes was comparable among the different cell populations (Fig. 4B). Similar results were obtained when lipid phosphorous associated with the different GPL classes was measured in resting and proliferating T cells (supplementary Fig. II).
Fig. 4.

Total FA content (A) and the FA distribution (B) of GPL classes from different cell populations. Lipids were extracted from resting T cells incubated without stimulation for 3 days, proliferating T cells incubated with 1 μg/ml anti-CD3 and 20 U/ml IL-2 for 3 days, proliferating T cells incubated for an additional 4 days without stimulation (S-NS), and Jurkat cells. GPL classes were separated by HPLC and PC, PE, and PI/PS were collected separately. The FAs from each fraction were hydrolyzed and transmethylated, and total FAs associated with each class were measured by GC-FID. These results are the mean ± SEM of 9–10 independent experiments for resting and proliferating T cells and 3 independent experiments for the Jurkat and S-NS cells. Values within each GPL class that do not have a common superscript are significantly different (P < 0.05) as determined by one-way ANOVA.
FA distribution in GPL classes
Although no significant changes in the proportions of the cellular GPL classes were measured, several significant changes in the FA distribution within each GPL class were measured in the different cell populations (Fig. 5). First, the composition of MUFAs and SFAs in the PC fraction followed a strong distinct pattern that was associated with cell proliferation or with cell quiescence, where the MUFAs were significantly lower and stearic acid (18:0) was significantly increased in the PC from quiescent cell populations (resting and S-NS). Second, the PC fraction from both populations of nonproliferating cells (resting and S-NS) was strikingly more enriched in arachidonate than that from proliferating cells (proliferating T cells and Jurkat cells). Similar patterns were also measured in the PE and in the PI/PS fractions. A smaller decrease in AA as a percent of total FAs was previously reported in mitogen-stimulated T cells (36).
Fig. 5.

The distribution of FAs within GPL classes from different cell populations. Lipids were extracted from resting T cells incubated without stimulation for 3 days, proliferating T cells incubated with 1 μg/ml anti-CD3 and 20 U/ml IL-2 for 3 days, proliferating T cells incubated for an additional 4 days without stimulation (S-NS), and Jurkat cells. GPL classes were separated by HPLC and PC, PE, and PI/PS were collected separately. The FAs from each fraction were hydrolyzed and transmethylated, and individual FAs were measured by GC-FID. The results are the mean ± SEM of 9–10 independent experiments for resting and proliferating T cells and 3 independent experiments for the Jurkat and S-NS cells. Values within each FA that do not have a common superscript are significantly different (P < 0.05) as determined by one-way ANOVA.
To better characterize the changes occurring in the FA composition of GPLs when resting primary T cells are stimulated to proliferate, the molar FA content within the different GPL classes was measured (Fig. 6). The molar content of most FAs was significantly increased in all GPL fractions of proliferating T cells, with the most prominent increases in mass in the SFAs and MUFAs in all GPL classes. It is noteworthy that a different picture emerges when the molar content is portrayed rather than when percent FAs are presented as in Fig. 5; important information is gathered by both representations because, for example, although 16:0 is similarly enriched in the GPL fractions from resting and proliferating cells on a percent basis (Fig. 5), the stimulated cells contain much more 16:0 mass (Fig. 6).
Fig. 6.

The mass content of FAs within GPL classes of resting and proliferating T cells. Lipids were extracted from resting T cells incubated without stimulation for 3 days or proliferating T cells incubated with 1 μg/ml anti-CD3 and 20 U/ml IL-2 for 3 days. GPL classes were separated by HPLC and PC, PE, and PI/PS were collected separately. The FAs from each fraction were hydrolyzed and transmethylated, and individual FAs were measured by GC-FID. The results are the mean ± SEM of 9–10 independent experiments. *Different from resting cells (P < 0.05) as determined by Student's t-test.
AA is the only FA whose molar content follows a distinct redistribution pattern in the different GPL classes following the induction of T cell proliferation. Its molar content in both PE and PI/PS increased in proliferating T cells, while the quantity associated with PC significantly decreased compared with resting T cells (Fig. 6). This suggests that a mechanism is in place to handle cellular AA content that does not apply to other FAs. Indeed, when the distribution of each FA between the different cellular GPL classes is measured, the change in the distribution pattern of AA following the induction of T cell proliferation is unique (Fig. 7). In both quiescent cell populations (resting T and S-NS cells) the mass of cellular AA is equally distributed between PC and PE species of phospholipids, but is significantly redistributed from PC to PE and to PI/PS species in actively proliferating populations (proliferating T and Jurkat cells) (Fig. 8, supplementary Fig. III).
Fig. 7.

The distribution of FAs between GPL classes of resting and proliferating T cells. Lipids were extracted from resting T cells incubated without stimulation for 3 days or proliferating T cells incubated with 1 μg/ml anti-CD3 and 20 U/ml IL-2 for 3 days. GPL classes were separated by HPLC and PC, PE, and PI/PS were collected separately. The FAs from each fraction were hydrolyzed and transmethylated, and individual FAs were measured by GC-FID. Values represent the mean ± SEM of 9–10 independent experiments. *Different from resting cells (P < 0.05) as determined by Student's t-test.
Fig. 8.

AA mass content in GPL classes from different cell populations. Lipids were extracted from resting T cells incubated without stimulation for 3 days, proliferating T cells incubated with 1 μg/ml anti-CD3 and 20 units/ml IL-2 for 3 days, proliferating T cells incubated for an additional 4 days without stimulation (S-NS), and Jurkat cells. GPL classes were separated by HPLC and PC, PE, and PI/PS were collected separately. The FAs from each fraction were hydrolyzed and transmethylated, and FAs were measured by GC-FID. Values represent the mean ± SEM of 9–10 independent experiments for resting and proliferating T cells and 3 independent experiments for the Jurkat and S-NS T cells. Values within each GPL class that do not have a common superscript are significantly different (P < 0.05) as determined by one-way ANOVA.
Arachidonate distribution in GPL subclasses
In light of the redistribution of cellular arachidonate following the stimulation of T cells, the distribution of arachidonate in GPL subclasses was measured. In resting T cells the most abundant arachidonate-containing GPLs were 1-acyl-PC species, although important amounts of 1-acyl-PE and 1-alk-1-enyl-PE (Fig. 9), as well as 1-acyl-PI/PS (Fig. 8) species were measured. However, in proliferating cells 1-acyl-PC was no longer the predominant reservoir of cellular arachidonate and was the only subclass of GPLs to have a net loss of cellular arachidonate compared with resting cells. Increases in arachidonate content were measured mostly in the 1-alk-1-enyl-PE and 1-acyl-PI/PS species, while 1-acyl-PE remained an important reservoir of cellular AA in proliferating cells (Fig. 9). The molar composition of other unsaturated FAs in GPL subclasses was also significantly changed in proliferating T cells compared with the resting T cells (supplementary Table I), but the redistribution of arachidonate was unlike that of any other FA.
Fig. 9.

AA composition of GPL subclasses from resting and proliferating T cells. Lipids were extracted from resting T cells incubated without stimulation for 3 days and proliferating T cells incubated with 1 μg/ml anti-CD3 and 20 units/ml IL-2 for 3 days. PE and PC were separated by HPLC, and 1-acyl-, 1-alkyl-, and 1-alk-1-enyl-linked subclasses were separated and associated FAs were measured by GC-MS using 2H8-AA as internal standard. Values represent the mean ± SEM of three independent experiments. *Different from resting cells (P < 0.05) as determined by Student's t-test.
[3H]arachidonate-phospholipid remodeling
It was previously shown that following stimulation of human or murine T cells, arachidonate remodeling and CoA-IT activity are increased (25, 38). This enzyme catalyzes the transfer of arachidonate from 1-acyl-2-AA-PC to 1-alkyl-PC, 1-acyl-PE, and 1-alk-1-enyl-PE species, and its activation in intact cells can be measured by tracking the remodeling of pulse-labeled [3H]AA in cellular GPL classes over time. Pulse-label experiments in resting and proliferating cells show that pulsed [3H]AA is preferentially incorporated into PC and then transfers to PE species, but the transfer is much more rapid in proliferating cells indicating that the arachidonate-GPL remodeling rate is enhanced (Fig. 10A, B). However, the apparent more rapid remodeling kinetics of [3H]AA may be a function of the large difference in the mass distribution of arachidonate between resting and proliferating cells. To correct for the potential bias associated with this difference in mass distribution, the change in the specific activity (cpm/ng AA) of PC and PE were measured (Fig. 10C). As the pulse-labeled [3H]AA comes into isotopic equilibrium with arachidonate mass, the ratio of the specific activities of PC to PE should approach a value of one. The much more rapid decrease in specific activity ratios in proliferating cells compared with resting cells confirms that the arachidonate-GPL remodeling rate was indeed enhanced in proliferating cells.
Fig. 10.

Arachidonate-phospholipid remodeling in resting and proliferating T cells. Resting T cells incubated for 3 days without stimulation (A) and proliferating T cells incubated with 1 μg/ml anti-CD3 and 20 units/ml IL-2 for 3 days (B) were pulse labeled with [3H]AA, washed, and incubated for the indicated times prior to lipid extraction. GPL classes were separated by HPLC and PC, PE, and PI/PS were collected separately. The FAs from each fraction were hydrolyzed and transmethylated, and fatty acids were measured by GC-FID and the radioactivity associated with each fraction was measured by liquid scintillation counting. To calculate the specific activity in (C), the counts per minute were divided by the mass of AA in each fraction. Values represent the mean ± SD of six to seven independent experiments.
Incorporation of exogenous AA into GPLs
Proliferating T cells incorporated significantly more [3H]AA into GPLs in pulse-label experiments (fold increase, 21.1 ± 1.5; P ≤ 0.0002, Student's t-test, n = 3) compared with resting T cells. To evaluate the possible mechanism responsible for this increased uptake into GPLs, ACSL activity was measured and shown to be significantly elevated in proliferating T cells compared with resting T cells (Fig. 11A). The expression of four different genes coding for ACSL known to use AA (10, 11, 39–42) were also significantly increased, although the FA transport protein-4, which also possesses ACSL activity (11), was not significantly changed (Table II, B). The increased incorporation of exogenous AA into proliferating T cells was also associated with significantly increased LPCAT and LPIAT activity while lysophosphatidylethanolamine acyltransferase (LPEAT) activity was unchanged (Fig. 11B–D). To evaluate the LPLAT isoforms responsible for these activity changes, the expression of selected LPLAT genes whose gene products show selectivity for arachidonoyl-CoA (8, 9, 43–46) were measured. The expression of all evaluated LPLAT genes was elevated with the exception of LPCAT2 (Table II, C). These increases in gene expression were accompanied by markedly increased protein levels of LPCAT3 and LPIAT1 in proliferating T cells (Fig. 12). LPCAT2 was undetectable in these cells.
Fig. 11.

Arachidonoyl-CoA synthetase (A), LPCAT (B), LPIAT (C), and lysophosphatidylethanolamine (D) activities in resting and proliferating human T cells. Resting T cells incubated for 3 days without stimulation and proliferating T cells incubated with 1 μg/ml anti-CD3 and 20 units/ml IL-2 for 3 days were sonicated and activities were measured in homogenates as described in the Experimental Procedures section. Values represent the mean ± SEM (A) and mean ± SD (B–D) of three independent experiments. *Different from resting cells (P < 0.05) as determined by Student's t-test.
Fig. 12.
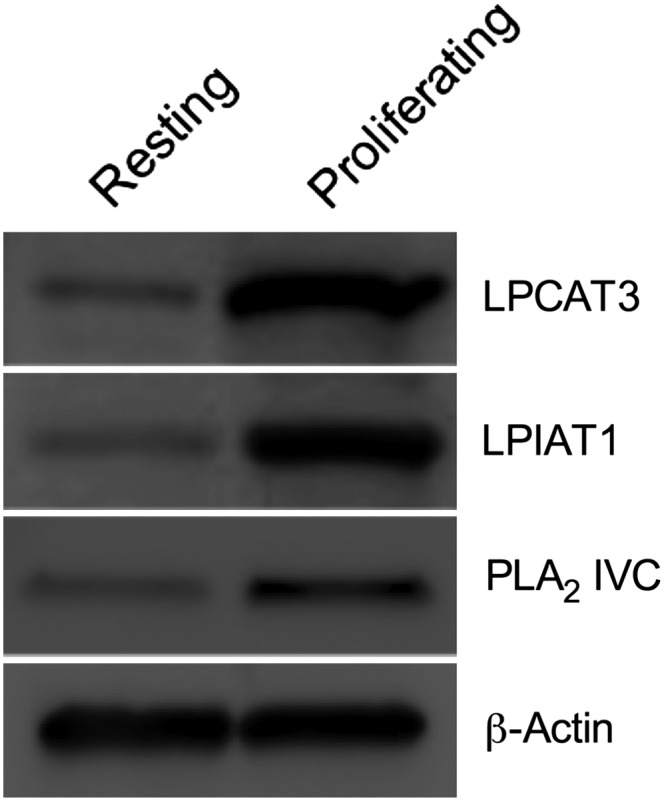
LPCAT3, LPIAT1, and PLA2 IVC expression in resting and proliferating T cells. Proteins (20 μg) from resting T cells and proliferating T cells were separated by SDS-PAGE and transferred on PVDF membrane as described in the Experimental Procedures section. Western blotting was performed using anti-LPCAT3 (1:1,000), anti-LPIAT1 (1:1,000), and anti-PLA2 IVC (1:1,000) antibodies and anti-β-actin (1:10000) as loading control. These images are representative of three independent experiments using different donors.
Finally, given the measured changes in the FA composition of GPLs associated with the induction of cell proliferation, the expression of a number of selected PLA2 genes whose gene products show selectivity for arachidonate-containing GPLs or which have been suggested to participate in GPL remodeling were also measured (5–7, 25, 26, 47–52). All of the measured genes coding for PLA2 showed significant differences in their expression between resting and proliferating T cells, though the extent of the increase in the expression of the group IVA and IVC PLA2 in proliferating T cells was especially noteworthy (Table II, D). Accordingly, group IVC PLA2 protein expression was also increased in proliferating T cells compared with resting cells (Fig. 12), while group IVA PLA2 protein levels were previously shown to be increased following induction of T cell proliferation (25).
DISCUSSION
In this study, significant differences in FA composition and metabolism in quiescent and proliferating T cell populations are reported. Striking changes in the content and distribution of FAs in GPL classes between resting and proliferating cells were measured that accompanied the expected increase in total GPL mass associated with an increase in cell size (36, 37). Because de novo FA synthesis is known to accompany cell proliferation, the increase in SFA mass in proliferating T cells was not surprising (53), however important changes in the unsaturated fatty acyl content of GPLs were also measured and these may be the result of fundamental processes associated with cell proliferation.
A salient feature of proliferating cells was the enrichment of proliferating primary T cells and Jurkat cells with MUFAs compared with resting cells and S-NS cells. Both palmitoleic acid (16:1 n-7) and oleic acid (18:1 n-9) are products of SCD1, while 18:1 n-7 is the elongation product of 16:1 n-7. Consistent with this FA profile, that is indicative of SCD-1 activity, mRNA and protein expression of SCD1 were impressively increased in proliferating T cells compared with resting cells. To our knowledge, this is the first description of an induction of SCD1 in a nontransformed cell type that accompanies the induction of cell proliferation. This observation is consistent with the reported expression of SCD1 in human cancers, chemically induced tumors, and oncogene-transformed cells (54–57). Importantly, several recent reports have shown that the knockdown or the inhibition of SCD1 in transformed cells reduces proliferation, invasiveness, and the capacity for tumor formation and induces apoptosis (58–62). Therefore, the induction of SCD1 and associated changes in cellular MUFA content may be a hallmark of proliferating cells, transformed or not, and SCD1 could represent a therapeutic target for proliferative disorders including cancers and autoimmune diseases.
One of the important changes measured in T cells once they entered the cell cycle was a profound and very specific redistribution of arachidonate within GPL classes and subclasses. Importantly, although T cells contain a number of different cellular PUFAs, the redistribution of arachidonate mass associated with cell proliferation was unique to this FA suggesting that the cell had developed a mechanism to specifically control the placement of AA, and that this placement was important for progression through the cell cycle. Indeed, the shift in cellular arachidonate mass following the induction of T cell proliferation, mainly from 1-acyl-PC to 1-radyl-PE species, coincided with an increased capacity of cells to remodel [3H]AA in pulse-label experiments. While such CoA-IT-driven remodeling has been linked to AA release for eicosanoid production following acute leukocyte stimulation (17, 20, 63–67), the present study shows that an enhanced remodeling activity is associated with a redistribution of cellular arachidonate mass. Previous studies have shown that the inhibition of CoA-IT results in the induction of apoptosis in neoplastic cell lines and in proliferating human T cells (18, 21, 25, 68). Thus the ability to transfer arachidonate between different GPL classes and subclasses, resulting in its redistribution into PE subclasses following the induction of cell proliferation, is likely an important event during cell division. The identity of the CoA-IT enzyme has not yet been determined; however its likely central role in controlling the cellular distribution of arachidonate mass suggests that the elucidation of its identity may reveal a new target for the control of cell proliferation.
The redistribution of arachidonate mass does not appear to be a phenomenon simply associated with activation of peripheral blood T cells. The Jurkat T cell line resembles stimulated proliferating T cells in that arachidonate is significantly more enriched in PE species compared with PC species. Additionally, removal of the stimuli that maintain T cells in a proliferative state reverts the cells to a senescent nonproliferating phenotype (35), and although this cell population maintains the elevated amount of total GPL measured in activated T cells, arachidonate is redistributed to the pattern observed in resting T cells where its content in PE and PC species is nearly equivalent. Thus, it appears that the redistribution of cellular arachidonate mass from PC to PE species is a phenomenon that accompanies the induction of cell proliferation, which is reversed when cells revert to a nonproliferating state. It is worth noting that this redistribution of arachidonate mass when cells cease to proliferate may be a different phenomenon from what is observed when cells are exposed to CoA-IT inhibitors (69), or when growth-promoting cytokines are removed from bone marrow-derived mast cells (70) where significant amounts of free unesterified AA accumulate due to an inhibition or loss of CoA-IT activity and cells undergo apoptosis. Such induction of cell death associated with the inability to control free unesterified AA leading to increased ceramide concentrations was also suggested to occur following group IVA PLA2 activation in TNF-sensitive cells and in cells treated with cyclooxygenase or ACSL inhibitors (71–74).
Interestingly, upon cell proliferation the cellular content of all measured FAs increased except for that of arachidonate, which instead remained constant at approximately 140 nmol/108 cells, but which was much more rapidly remodeled from PC to PE species and exhibited a unique shift in its cellular mass distribution in GPL classes and subclasses. Although the content of cellular arachidonate remained steady, unlike resting cells, the proliferating cells must nevertheless constantly incorporate new AA into newly synthesized membranes to maintain cellular arachidonate levels, and this was confirmed by the significantly increased capacity of the cells to incorporate exogenous AA. This incorporation of AA into membranes requires PLA2 activity to generate lyso-GPL, ACSL, and LPLAT activities to incorporate PUFAs into GPLs, a phenomenon called the Lands cycle and proposed several decades ago to account for the diversity of GPL molecular species generated following de novo GPL biosynthesis (2, 4) (Fig. 1).
Recently, a number of new ACSLs, LPLATs, and PLA2s have been discovered that exhibit different substrate specificities toward different FA or GPL classes and likely contribute to cellular FA diversity (5–11), although the individual isoforms responsible for the diversity of GPL molecular species in different cell types have not been definitively identified. It is therefore probable that genes coding for different isoforms of these enzymes with specificity toward AA may be differentially regulated with the induction of cell proliferation. ACSL, LPCAT, and LPIAT activities were significantly increased in proliferating T cells and the expression of ACSL and LPLAT known to utilize AA as a substrate (10, 11, 39–42) was measured. The expression of all four measured ACSL genes was significantly increased in proliferating T cells compared with resting cells, suggesting that an overall increased requirement for these enzymes to assimilate exogenous sources of PUFAs is associated with the induction of cell proliferation. With respect to LPCAT expression, LPCAT2, LPCAT3 (also called MBOAT5), and LPCAT4 (also called LPEAT2 and MBOAT2) have all shown activity for AA-CoA as a substrate (8, 9, 43–46). LPCAT3 and LPCAT4 gene expression was slightly upregulated with cell stimulation, and LPCAT3 protein expression was significantly elevated in proliferating T cells. It is noteworthy that different apparent Km values were measured in resting and proliferating cells that may be indicative of differential isoform expression in the two cell populations, or of potential posttranslational modifications of the enzyme. Overall, the enhanced expression of ACSL and LPLAT genes had not been previously associated with cell proliferation; however, their induction is consistent with the enhanced capacity for these cells to incorporate AA.
Another LPLAT that plays a potential role in the altered distribution of cellular arachidonate is LPIAT1 (MBOAT7). It is the only known isoform that shows specificity for lyso-PI and this isoform is also specific for AA-CoA as substrate (44). Interestingly, LPIAT enzymatic activity, as well as gene and protein expression of the LPIAT1 isoform, was significantly increased in proliferating cells compared with resting cells. This accompanied an increase in the proportion of [3H]AA, that is initially incorporated into PI of proliferating cells compared with resting cells in pulse-label experiments, and an increase in the proportion of cellular arachidonate mass associated with PI/PS compared with resting cells. Therefore, proliferating cells preferentially incorporate newly acquired AA into PI/PS compared with resting cells, but this PI/PS-associated arachidonate does not participate in the CoA-IT-driven remodeling between GPL species as seen by the stability of the [3H]AA associated in PI/PS over time in pulse-label experiments. The importance of an increased content of AA-containing PI/PS species is not clear, however, PI-4-phosphate-5-kinase I isoforms are specific for AA-containing PI (75) and are responsible for the synthesis of PIP2 which is concentrated in the cleavage furrow and has been postulated to be critical for the recruitment of proteins in the actomyosin ring, and thus cell division (76).
Similarly, gene expression of group VIA PLA2, known to play a role in GPL remodeling (48, 77, 78), and the group IV PLA2s, that show specificity for AA-containing GPLs (49), were also measured. There was little change in the expression of the group VIA PLA2, although the protein content of the group VIA PLA2 was previously shown to be increased in stimulated T cells (25), and its expression has been associated with cell cycle progression (26, 50). This isoform is likely not involved in the redistribution of arachidonate mass because treatment of cells with its inhibitor, BEL, has no effect on [3H]AA remodeling rates (25). Interestingly, the group IVA and IVC PLA2 gene and protein expression were both greatly upregulated in proliferating cells compared with resting cells. However, treatment of Jurkat cells with the specific group IVA inhibitor, pyrophenone, did not modify [3H]AA remodeling rates (data not shown), which is consistent with previous data using MAFP in T cells (25). Thus this enzyme is likely not associated with enhanced remodeling rates. The group IVC PLA2, whose physiological function has not yet been clearly identified, possesses multiple hydrolytic activities, including a CoA-IT activity (2, 51, 52), and its overexpression in HEK293 cells is specifically associated with changes in arachidonoyl-containing PE species (47). Studies are underway to further investigate the possible role of the group IVC PLA2 isoform in the regulation of cellular FA distribution and its potential importance in cell proliferation.
Overall, the induction of T cell proliferation was accompanied by profound changes in FA metabolism that included significant remodeling of PUFAs within GPL species. These metabolic changes were accompanied by the modified expression of a number of newly-identified enzyme isoforms whose involvement in these pathways is poorly understood, but whose expression now appears to be associated with the induction of cell proliferation. These key changes in the expression of enzymes associated with GPL remodeling and FA metabolism have unveiled several potential targets for the treatment not only of lymphoproliferative disorders, but also, potentially, of other pathologies in which unwanted cell proliferation occurs.
Supplementary Material
Acknowledgments
The authors thank Natalie Levesque for technical support with FA analysis on GC-FID and GC-MS.
Footnotes
Abbreviations:
- AA
- arachidonic acid
- ACSL
- acyl-CoA synthetase
- CoA-IT
- CoA-independent transacylase
- FAME
- fatty acid methyl ester
- FASN
- fatty acid synthase
- GPL
- glycerophospholipid
- LPCAT
- lysophosphatidylcholine acyltransferase
- LPEAT
- lysophosphatidylethanolamine acyltransferase
- LPIAT
- lysophosphatidylinositol acyltransferase
- LPLAT
- lysophospholipid acyl-CoA transferase
- PBMC
- peripheral blood mononuclear cell
- PC
- phosphatidylcholine
- PE
- phosphatidylethanolamine
- PI
- phosphatidylinositol
- PLA2
- phospholipase A2
- PS
- phosphatidylserine
- PVDF
- polyvinylidene fluoride
- SCD1
- stearoyl-CoA desaturase 1
- SFA
- saturated fatty acid
- S-NS
- stimulated to non-stimulated cells
This work was supported by grants from the Canadian Institutes of Health Research (CIHR) and the New Brunswick Health Research Foundation (NBHRF). P.P.R. was supported by Doctoral Scholarships from the CIHR, the NBHRF, and the Fonds de recherche sur l'arthrite et les maladies rhumatismales de l'université Laval. M.E.S. was supported by the Canada Research Chairs Program.
The online version of this article (available at http://www.jlr.org) contains supplementary data in the form of three figures and one table.
REFERENCES
- 1.Spector A. A., Yorek M. A. 1985. Membrane lipid composition and cellular function. J. Lipid Res. 26: 1015–1035 [PubMed] [Google Scholar]
- 2.Yamashita A., Sugiura T., Waku K. 1997. Acyltransferases and transacylases involved in fatty acid remodeling of phospholipids and metabolism of bioactive lipids in mammalian cells. J. Biochem. 122: 1–16 [DOI] [PubMed] [Google Scholar]
- 3.Fahy E., Subramaniam S., Brown H. A., Glass C. K., Merrill A. H., Jr, Murphy R. C., Raetz C. R., Russell D. W., Seyama Y., Shaw W., et al. 2005. A comprehensive classification system for lipids. J. Lipid Res. 46: 839–861 [DOI] [PubMed] [Google Scholar]
- 4.Lands W. E., Inoue M., Sugiura Y., Okuyama H. 1982. Selective incorporation of polyunsaturated fatty acids into phosphatidylcholine by rat liver microsomes. J. Biol. Chem. 257: 14968–14972 [PubMed] [Google Scholar]
- 5.Diaz B. L., Arm J. P. 2003. Phospholipase A(2). Prostaglandins Leukot. Essent. Fatty Acids. 69: 87–97 [DOI] [PubMed] [Google Scholar]
- 6.Kudo I., Murakami M. 2002. Phospholipase A2 enzymes. Prostaglandins Other Lipid Mediat. 68–69: 3–58 [DOI] [PubMed] [Google Scholar]
- 7.Murakami M., Taketomi Y., Miki Y., Sato H., Hirabayashi T., Yamamoto K. 2011. Recent progress in phospholipase A research: from cells to animals to humans. Prog. Lipid Res. 50: 152–192 [DOI] [PubMed] [Google Scholar]
- 8.Hishikawa D., Shindou H., Kobayashi S., Nakanishi H., Taguchi R., Shimizu T. 2008. Discovery of a lysophospholipid acyltransferase family essential for membrane asymmetry and diversity. Proc. Natl. Acad. Sci. USA. 105: 2830–2835 [DOI] [PMC free article] [PubMed] [Google Scholar]
- 9.Shindou H., Hishikawa D., Harayama T., Yuki K., Shimizu T. 2009. Recent progress on acyl CoA: lysophospholipid acyltransferase research. J. Lipid Res. 50(Suppl): S46–S51 [DOI] [PMC free article] [PubMed] [Google Scholar]
- 10.Soupene E., Kuypers F. A. 2008. Mammalian long-chain acyl-CoA synthetases. Exp. Biol. Med. (Maywood). 233: 507–521 [DOI] [PMC free article] [PubMed] [Google Scholar]
- 11.Johnsen G. M., Weedon-Fekjaer M. S., Tobin K. A., Staff A. C., Duttaroy A. K. 2009. Long-chain polyunsaturated fatty acids stimulate cellular fatty acid uptake in human placental choriocarcinoma (BeWo) cells. Placenta. 30: 1037–1044 [DOI] [PubMed] [Google Scholar]
- 12.Kramer R. M., Deykin D. 1983. Arachidonoyl transacylase in human platelets. Coenzyme A-independent transfer of arachidonate from phosphatidylcholine to lysoplasmenylethanolamine. J. Biol. Chem. 258: 13806–13811 [PubMed] [Google Scholar]
- 13.Kramer R. M., Patton G. M., Pritzker C. R., Deykin D. 1984. Metabolism of platelet-activating factor in human platelets. Transacylase-mediated synthesis of 1-O-alkyl-2-arachidonoyl-sn-glycero-3-phosphocholine. J. Biol. Chem. 259: 13316–13320 [PubMed] [Google Scholar]
- 14.Sugiura T., Katayama O., Fukui J., Nakagawa Y., Waku K. 1984. Mobilization of arachidonic acid between diacyl and ether phospholipids in rabbit alveolar macrophages. FEBS Lett. 165: 273–276 [DOI] [PubMed] [Google Scholar]
- 15.Robinson M., Blank M. L., Snyder F. 1985. Acylation of lysophospholipids by rabbit alveolar macrophages. Specificities of CoA-dependent and CoA-independent reactions. J. Biol. Chem. 260: 7889–7895 [PubMed] [Google Scholar]
- 16.Sugiura T., Masuzawa Y., Nakagawa Y., Waku K. 1987. Transacylation of lyso platelet-activating factor and other lysophospholipids by macrophage microsomes. Distinct donor and acceptor selectivities. J. Biol. Chem. 262: 1199–1205 [PubMed] [Google Scholar]
- 17.Chilton F. H., Fonteh A. N., Surette M. E., Triggiani M., Winkler J. D. 1996. Control of arachidonate levels within inflammatory cells. Biochim. Biophys. Acta. 1299: 1–15 [DOI] [PubMed] [Google Scholar]
- 18.Surette M. E., Chilton F. H. 1998. The distribution and metabolism of arachidonate-containing phospholipids in cellular nuclei. Biochem. J. 330: 915–921 [DOI] [PMC free article] [PubMed] [Google Scholar]
- 19.Chilton F. H., Fonteh A. N., Sung C. M., Hickey D. M., Torphy T. J., Mayer R. J., Marshall L. A., Heravi J. D., Winkler J. D. 1995. Inhibitors of CoA-independent transacylase block the movement of arachidonate into 1-ether-linked phospholipids of human neutrophils. Biochemistry. 34: 5403–5410 [DOI] [PubMed] [Google Scholar]
- 20.Fonteh A. N. 2002. Differential effects of arachidonoyl trifluoromethyl ketone on arachidonic acid release and lipid mediator biosynthesis by human neutrophils. Evidence for different arachidonate pools. Eur. J. Biochem. 269: 3760–3770 [DOI] [PubMed] [Google Scholar]
- 21.Winkler J. D., Eris T., Sung C. M., Chabot-Fletcher M., Mayer R. J., Surette M. E., Chilton F. H. 1996. Inhibitors of coenzyme A-independent transacylase induce apoptosis in human HL-60 cells. J. Pharmacol. Exp. Ther. 279: 956–966 [PubMed] [Google Scholar]
- 22.Winkler J. D., Fonteh A. N., Sung C. M., Heravi J. D., Nixon A. B., Chabot-Fletcher M., Griswold D., Marshall L. A., Chilton F. H. 1995. Effects of CoA-independent transacylase inhibitors on the production of lipid inflammatory mediators. J. Pharmacol. Exp. Ther. 274: 1338–1347 [PubMed] [Google Scholar]
- 23.Winkler J. D., Sung C. M., Chabot-Flecher M., Griswold D. E., Marshall L. A., Chilton F. H., Bondinell W., Mayer R. J. 1998. Beta-lactams SB 212047 and SB 216754 are irreversible, time-dependent inhibitors of coenzyme A-independent transacylase. Mol. Pharmacol. 53: 322–329 [DOI] [PubMed] [Google Scholar]
- 24.Böyum A. 1968. Isolation of mononuclear cells and granulocytes from human blood. Isolation of monuclear cells by one centrifugation, and of granulocytes by combining centrifugation and sedimentation at 1 g. Scand. J. Clin. Lab. Invest. Suppl. 97: 77–89 [PubMed] [Google Scholar]
- 25.Boilard E., Surette M. E. 2001. Anti-CD3 and concanavalin A-induced human T cell proliferation is associated with an increased rate of arachidonate-phospholipid remodeling. Lack of involvement of group IV and group VI phospholipase A2 in remodeling and increased susceptibility of proliferating T cells to CoA-independent transacyclase inhibitor-induced apoptosis. J. Biol. Chem. 276: 17568–17575 [DOI] [PubMed] [Google Scholar]
- 26.Roshak A. K., Capper E. A., Stevenson C., Eichman C., Marshall L. A. 2000. Human calcium-independent phospholipase A2 mediates lymphocyte proliferation. J. Biol. Chem. 275: 35692–35698 [DOI] [PubMed] [Google Scholar]
- 27.Bligh E. G., Dyer W. J. 1959. A rapid method of total lipid extraction and purification. Can. J. Biochem. Physiol. 37: 911–917 [DOI] [PubMed] [Google Scholar]
- 28.Chilton F. H. 1990. Separation and characterization of arachidonate-containing phosphoglycerides. Methods Enzymol. 187: 157–167 [DOI] [PubMed] [Google Scholar]
- 29.Surette M. E., Koumenis I. L., Edens M. B., Tramposch K. M., Chilton F. H. 2003. Inhibition of leukotriene synthesis, pharmacokinetics, and tolerability of a novel dietary fatty acid formulation in healthy adult subjects. Clin. Ther. 25: 948–971 [DOI] [PubMed] [Google Scholar]
- 30.Rouser G., Siakotos A. N., Fleischer S. 1966. Quantitative analysis of phospholipids by thin-layer chromatography and phosphorus analysis of spots. Lipids. 1: 85–86 [DOI] [PubMed] [Google Scholar]
- 31.Markwell M. A., Haas S. M., Tolbert N. E., Bieber L. L. 1981. Protein determination in membrane and lipoprotein samples: manual and automated procedures. Methods Enzymol. 72: 296–303 [DOI] [PubMed] [Google Scholar]
- 32.Pérez-Chacón G., Astudillo A. M., Ruipérez V., Balboa M. A., Balsinde J. 2010. Signaling role for lysophosphatidylcholine acyltransferase 3 in receptor-regulated arachidonic acid reacylation reactions in human monocytes. J. Immunol. 184: 1071–1078 [DOI] [PubMed] [Google Scholar]
- 33.Zarini S., Gijon M. A., Folco G., Murphy R. C. 2006. Effect of arachidonic acid reacylation on leukotriene biosynthesis in human neutrophils stimulated with granulocyte-macrophage colony-stimulating factor and formyl-methionyl-leucyl-phenylalanine. J. Biol. Chem. 281: 10134–10142 [DOI] [PubMed] [Google Scholar]
- 34.Kerkhoff C., Kaever V. 2003. A systematic approach for the solubilization of the integral membrane protein lysophospholipid: Acyl-Coa acyltransferase (LAT). Methods Mol. Biol. 228: 111–127 [DOI] [PubMed] [Google Scholar]
- 35.Bettens F., Kristensen F., Walker C., Bonnard G. D., de Weck A. L. 1984. Lymphokine regulation of human lymphocyte proliferation: formation of resting G0 cells by removal of interleukin 2 in cultures of proliferating T lymphocytes. Cell. Immunol. 86: 337–346 [DOI] [PubMed] [Google Scholar]
- 36.Anel A., Naval J., Gonzalez B., Torres J. M., Mishal Z., Uriel J., Pineiro A. 1990. Fatty acid metabolism in human lymphocytes. I. Time-course changes in fatty acid composition and membrane fluidity during blastic transformation of peripheral blood lymphocytes. Biochim. Biophys. Acta. 1044: 323–331 [DOI] [PubMed] [Google Scholar]
- 37.Calder P. C., Yaqoob P., Harvey D. J., Watts A., Newsholme E. A. 1994. Incorporation of fatty acids by concanavalin A-stimulated lymphocytes and the effect on fatty acid composition and membrane fluidity. Biochem. J. 300: 509–518 [DOI] [PMC free article] [PubMed] [Google Scholar]
- 38.Tomita M., Baker R. C., Ando S., Santoro T. J. 2004. Arachidonoyl-phospholipid remodeling in proliferating murine T cells. Lipids Health Dis. 3: 1. [DOI] [PMC free article] [PubMed] [Google Scholar]
- 39.Poppelreuther M., Rudolph B., Du C., Grossmann R., Becker M., Thiele C., Ehehalt R., Fullekrug J. 2012. The N-terminal region of acyl-CoA synthetase 3 is essential for both the localization on lipid droplets and the function in fatty acid uptake. J. Lipid Res. 53: 888–900 [DOI] [PMC free article] [PubMed] [Google Scholar]
- 40.Maloberti P. M., Duarte A. B., Orlando U. D., Pasqualini M. E., Solano A. R., Lopez-Otin C., Podesta E. J. 2010. Functional interaction between acyl-CoA synthetase 4, lipooxygenases and cyclooxygenase-2 in the aggressive phenotype of breast cancer cells. PLoS ONE. 5: e15540. [DOI] [PMC free article] [PubMed] [Google Scholar]
- 41.Orlando U. D., Garona J., Ripoll G. V., Maloberti P. M., Solano A. R., Avagnina A., Gomez D. E., Alonso D. F., Podesta E. J. 2012. The functional interaction between acyl-CoA synthetase 4, 5-lipooxygenase and cyclooxygenase-2 controls tumor growth: a novel therapeutic target. PLoS ONE. 7: e40794. [DOI] [PMC free article] [PubMed] [Google Scholar]
- 42.Van Horn C. G., Caviglia J. M., Li L. O., Wang S., Granger D. A., Coleman R. A. 2005. Characterization of recombinant long-chain rat acyl-CoA synthetase isoforms 3 and 6: identification of a novel variant of isoform 6. Biochemistry. 44: 1635–1642 [DOI] [PubMed] [Google Scholar]
- 43.Cao J., Shan D., Revett T., Li D., Wu L., Liu W., Tobin J. F., Gimeno R. E. 2008. Molecular identification of a novel mammalian brain isoform of acyl-CoA:lysophospholipid acyltransferase with prominent ethanolamine lysophospholipid acylating activity, LPEAT2. J. Biol. Chem. 283: 19049–19057 [DOI] [PubMed] [Google Scholar]
- 44.Gijón M. A., Riekhof W. R., Zarini S., Murphy R. C., Voelker D. R. 2008. Lysophospholipid acyltransferases and arachidonate recycling in human neutrophils. J. Biol. Chem. 283: 30235–30245 [DOI] [PMC free article] [PubMed] [Google Scholar]
- 45.Shindou H., Hishikawa D., Nakanishi H., Harayama T., Ishii S., Taguchi R., Shimizu T. 2007. A single enzyme catalyzes both platelet-activating factor production and membrane biogenesis of inflammatory cells. Cloning and characterization of acetyl-CoA:LYSO-PAF acetyltransferase. J. Biol. Chem. 282: 6532–6539 [DOI] [PubMed] [Google Scholar]
- 46.Shindou H., Shimizu T. 2009. Acyl-CoA:lysophospholipid acyltransferases. J. Biol. Chem. 284: 1–5 [DOI] [PubMed] [Google Scholar]
- 47.Asai K., Hirabayashi T., Houjou T., Uozumi N., Taguchi R., Shimizu T. 2003. Human group IVC phospholipase A2 (cPLA2gamma). Roles in the membrane remodeling and activation induced by oxidative stress. J. Biol. Chem. 278: 8809–8814 [DOI] [PubMed] [Google Scholar]
- 48.Balsinde J., Bianco I. D., Ackermann E. J., Conde-Frieboes K., Dennis E. A. 1995. Inhibition of calcium-independent phospholipase A2 prevents arachidonic acid incorporation and phospholipid remodeling in P388D1 macrophages. Proc. Natl. Acad. Sci. USA. 92: 8527–8531 [DOI] [PMC free article] [PubMed] [Google Scholar]
- 49.Lucas K. K., Dennis E. A. 2004. The ABC's of Group IV cytosolic phospholipase A2. Biochim. Biophys. Acta. 1636: 213–218 [DOI] [PubMed] [Google Scholar]
- 50.Manguikian A. D., Barbour S. E. 2004. Cell cycle dependence of group VIA calcium-independent phospholipase A2 activity. J. Biol. Chem. 279: 52881–52892 [DOI] [PubMed] [Google Scholar]
- 51.Yamashita A., Kamata R., Kawagishi N., Nakanishi H., Suzuki H., Sugiura T., Waku K. 2005. Roles of C-terminal processing, and involvement in transacylation reaction of human group IVC phospholipase A2 (cPLA2gamma). J. Biochem. 137: 557–567 [DOI] [PubMed] [Google Scholar]
- 52.Yamashita A., Tanaka K., Kamata R., Kumazawa T., Suzuki N., Koga H., Waku K., Sugiura T. 2009. Subcellular localization and lysophospholipase/transacylation activities of human group IVC phospholipase A2 (cPLA2gamma). Biochim. Biophys. Acta. 1791: 1011–1022 [DOI] [PubMed] [Google Scholar]
- 53.Resch K., Bessler W. 1981. Activation of lymphocyte populations with concanavalin A or with lipoprotein and lipopeptide from the outer cell wall of Escherichia coli: correlation of early membrane changes with induction of macromolecular synthesis. Eur. J. Biochem. 115: 247–252 [DOI] [PubMed] [Google Scholar]
- 54.Li J., Ding S. F., Habib N. A., Fermor B. F., Wood C. B., Gilmour R. S. 1994. Partial characterization of a cDNA for human stearoyl-CoA desaturase and changes in its mRNA expression in some normal and malignant tissues. Int. J. Cancer. 57: 348–352 [DOI] [PubMed] [Google Scholar]
- 55.Scaglia N., Caviglia J. M., Igal R. A. 2005. High stearoyl-CoA desaturase protein and activity levels in simian virus 40 transformed-human lung fibroblasts. Biochim. Biophys. Acta. 1687: 141–151 [DOI] [PubMed] [Google Scholar]
- 56.Thai S. F., Allen J. W., DeAngelo A. B., George M. H., Fuscoe J. C. 2001. Detection of early gene expression changes by differential display in the livers of mice exposed to dichloroacetic acid. Carcinogenesis. 22: 1317–1322 [DOI] [PubMed] [Google Scholar]
- 57.Yahagi N., Shimano H., Hasegawa K., Ohashi K., Matsuzaka T., Najima Y., Sekiya M., Tomita S., Okazaki H., Tamura Y., et al. 2005. Co-ordinate activation of lipogenic enzymes in hepatocellular carcinoma. Eur. J. Cancer. 41: 1316–1322 [DOI] [PubMed] [Google Scholar]
- 58.Hess D., Chisholm J. W., Igal R. A. 2010. Inhibition of stearoyl-CoA desaturase activity blocks cell cycle progression and induces programmed cell death in lung cancer cells. PLoS ONE. 5: e11394. [DOI] [PMC free article] [PubMed] [Google Scholar]
- 59.Igal R. A. 2010. Stearoyl-CoA desaturase-1: a novel key player in the mechanisms of cell proliferation, programmed cell death and transformation to cancer. Carcinogenesis. 31: 1509–1515 [DOI] [PubMed] [Google Scholar]
- 60.Minville-Walz M., Pierre A. S., Pichon L., Bellenger S., Fevre C., Bellenger J., Tessier C., Narce M., Rialland M. 2010. Inhibition of stearoyl-CoA desaturase 1 expression induces CHOP-dependent cell death in human cancer cells. PLoS ONE. 5: e14363. [DOI] [PMC free article] [PubMed] [Google Scholar]
- 61.Scaglia N., Igal R. A. 2005. Stearoyl-CoA desaturase is involved in the control of proliferation, anchorage-independent growth, and survival in human transformed cells. J. Biol. Chem. 280: 25339–25349 [DOI] [PubMed] [Google Scholar]
- 62.Scaglia N., Igal R. A. 2008. Inhibition of stearoyl-CoA desaturase 1 expression in human lung adenocarcinoma cells impairs tumorigenesis. Int. J. Oncol. 33: 839–850 [PubMed] [Google Scholar]
- 63.Balsinde J., Fernandez B., Solis-Herruzo J. A. 1994. Increased incorporation of arachidonic acid into phospholipids in zymosan-stimulated mouse peritoneal macrophages. Eur. J. Biochem. 221: 1013–1018 [DOI] [PubMed] [Google Scholar]
- 64.Fonteh A. N., Chilton F. H. 1992. Rapid remodeling of arachidonate from phosphatidylcholine to phosphatidylethanolamine pools during mast cell activation. J. Immunol. 148: 1784–1791 [PubMed] [Google Scholar]
- 65.Fonteh A. N., Chilton F. H. 1993. Mobilization of different arachidonate pools and their roles in the generation of leukotrienes and free arachidonic acid during immunologic activation of mast cells. J. Immunol. 150: 563–570 [PubMed] [Google Scholar]
- 66.Neville N. T., Parton J., Harwood J. L., Jackson S. K. 2005. The activities of monocyte lysophosphatidylcholine acyltransferase and coenzyme A-independent transacylase are changed by the inflammatory cytokines tumor necrosis factor alpha and interferon gamma. Biochim. Biophys. Acta. 1733: 232–238 [DOI] [PubMed] [Google Scholar]
- 67.Winkler J. D., Sung C. M., Huang L., Chilton F. H. 1994. CoA-independent transacylase activity is increased in human neutrophils after treatment with tumor necrosis factor alpha. Biochim. Biophys. Acta. 1215: 133–140 [DOI] [PubMed] [Google Scholar]
- 68.Surette M. E., Winkler J. D., Fonteh A. N., Chilton F. H. 1996. Relationship between arachidonate–phospholipid remodeling and apoptosis. Biochemistry. 35: 9187–9196 [DOI] [PubMed] [Google Scholar]
- 69.Surette M. E., Fonteh A. N., Bernatchez C., Chilton F. H. 1999. Perturbations in the control of cellular arachidonic acid levels block cell growth and induce apoptosis in HL-60 cells. Carcinogenesis. 20: 757–763 [DOI] [PubMed] [Google Scholar]
- 70.Fonteh A. N., LaPorte T., Swan D., McAlexander M. A. 2001. A decrease in remodeling accounts for the accumulation of arachidonic acid in murine mast cells undergoing apoptosis. J. Biol. Chem. 276: 1439–1449 [DOI] [PubMed] [Google Scholar]
- 71.Cao Y., Pearman A. T., Zimmerman G. A., McIntyre T. M., Prescott S. M. 2000. Intracellular unesterified arachidonic acid signals apoptosis. Proc. Natl. Acad. Sci. USA. 97: 11280–11285 [DOI] [PMC free article] [PubMed] [Google Scholar]
- 72.Chan T. A., Morin P. J., Vogelstein B., Kinzler K. W. 1998. Mechanisms underlying nonsteroidal antiinflammatory drug-mediated apoptosis. Proc. Natl. Acad. Sci. USA. 95: 681–686 [DOI] [PMC free article] [PubMed] [Google Scholar]
- 73.Hollenbach P. W., Zilli D. L., Laster S. M. 1992. Inhibitors of transcription and translation act synergistically with tumor necrosis factor to cause the activation of phospholipase A2. J. Biol. Chem. 267: 39–42 [PubMed] [Google Scholar]
- 74.Jayadev S., Hayter H. L., Andrieu N., Gamard C. J., Liu B., Balu R., Hayakawa M., Ito F., Hannun Y. A. 1997. Phospholipase A2 is necessary for tumor necrosis factor alpha-induced ceramide generation in L929 cells. J. Biol. Chem. 272: 17196–17203 [DOI] [PubMed] [Google Scholar]
- 75.Shulga Y. V., Topham M. K., Epand R. M. 2011. Study of arachidonoyl specificity in two enzymes of the PI cycle. J. Mol. Biol. 409: 101–112 [DOI] [PMC free article] [PubMed] [Google Scholar]
- 76.Logan M. R., Mandato C. A. 2006. Regulation of the actin cytoskeleton by PIP2 in cytokinesis. Biol. Cell. 98: 377–388 [DOI] [PubMed] [Google Scholar]
- 77.Balsinde J., Balboa M. A., Dennis E. A. 1997. Inflammatory activation of arachidonic acid signaling in murine P388D1 macrophages via sphingomyelin synthesis. J. Biol. Chem. 272: 20373–20377 [DOI] [PubMed] [Google Scholar]
- 78.Balsinde J., Dennis E. A. 1997. Function and inhibition of intracellular calcium-independent phospholipase A2. J. Biol. Chem. 272: 16069–16072 [DOI] [PubMed] [Google Scholar]
Associated Data
This section collects any data citations, data availability statements, or supplementary materials included in this article.