Abstract
Our aim is to study selected cerebrospinal fluid (CSF) glycerophospholipids (GP) that are important in brain pathophysiology. We recruited cognitively healthy (CH), minimally cognitively impaired (MCI), and late onset Alzheimer's disease (LOAD) study participants and collected their CSF. After fractionation into nanometer particles (NP) and supernatant fluids (SF), we studied the lipid composition of these compartments. LC-MS/MS studies reveal that both CSF fractions from CH subjects have N-acyl phosphatidylethanolamine, 1-radyl-2-acyl-sn-glycerophosphoethanolamine (PE), 1-radyl-2-acyl-sn-glycerophosphocholine (PC), 1,2-diacyl-sn-glycerophosphoserine (PS), platelet-activating factor-like lipids, and lysophosphatidylcholine (LPC). In the NP fraction, GPs are enriched with a mixture of saturated, monounsaturated, and polyunsaturated fatty acid species, while PE and PS in the SF fractions are enriched with PUFA-containing molecular species. PC, PE, and PS levels in CSF fractions decrease progressively in participants from CH to MCI, and then to LOAD. Whereas most PC species decrease equally in LOAD, plasmalogen species account for most of the decrease in PE. A significant increase in the LPC-to-PC ratio and PLA2 activity accompanies the GP decrease in LOAD. These studies reveal that CSF supernatant fluid and nanometer particles have different GP composition, and that PLA2 activity accounts for altered GPs in these fractions as neurodegeneration progresses.
Keywords: lipid metabolism, minimal cognitive impairment, liquid chromatography, mass spectrometry, nanoparticles, neurodegeneration
Lipids that constitute about 40% of the dry mass of the brain are divided into eight different groups (1). Of these groups, studies show that fatty acyls, glycerolipids (GLs), glycerophospholipids (GPs), sphingolipids (SPs), and sterol lipids (STs) are important in neuronal function (2–6). Within an individual lipid group, there are potentially thousands of individual lipid species, though most have not been identified. To understand their functional roles and test whether any changes are a cause or a consequence of disease, there is a need to identify and quantify these lipids.
Of all known brain lipids, GPs constitute a diverse group of molecules with important functions. For example, 1-radyl-2-acyl-sn-glycerophosphocholines (PCs) are the main component of cell membranes and lipoproteins, and they are precursors of signaling molecules (diacylglycerol), inflammatory molecules [platelet-activating factor (PAF), eicosanoids], and neurotransmitters (choline) (3, 7). Hydrolysis of PC by several phospholipases initiates the formation of these signaling and inflammatory molecules (8, 9). In addition to changes during enzyme digestion, the composition and structure of brain GPs may change when there is enhanced oxidation of PUFAs, and oxidized GPs are more susceptible to degradation (10). Lecithin cholesterol acyl transferase requires PC to esterify cholesterol (11). 1-Radyl-2-acyl-sn-glycerophosphoethanolamine (PE) and N-acyl phosphatidylethanolamine (NAPE) are precursors of endocannabinoids (12–15), whereas cell-surface 1,2-diacyl-sn-glycerophosphoserine (PS) levels can signify apoptosis (16).
Several studies associate GP metabolism with key features of Alzheimer's disease (AD), such as neuronal injury, neuroinflammation, and neurodegeneration (17–19). Whereas GP hydrolysis generates signaling and inflammatory molecules, oxidized PC is associated with ApoA1, amyloidosis, and phospholipase A2 (PLA2) activation (20–23). Thus, measurement of GP composition and PLA2 activity in cerebrospinal fluid (CSF) may elucidate potential mechanisms of AD progression.
The enormous complexity of brain cell lipid composition and the limited access to tissue during life leads to the use of CSF as a gateway to assess brain-derived lipid components and any fluctuation that may occur in association with pathophysiological states. How closely CSF lipids mirror those in the brain remains to be determined, but we recently described nanometer-sized membrane particles (NPs) that have rich lipid content, functionally active enzymes, and neurotransmitters distinct from the surrounding supernatant fluid (SF) (24). Though the mechanism for the formation of these CSF fractions remains to be determined, NPs can be considered to represent some of the brain tissue components, and the SF fraction represents extracellular fluids. Thus, CSF provides a readily accessible source to investigate both soluble and particulate GPs that reflect brain physiology or pathological conditions.
It is not clear whether the GP composition of NP is different from that of the SF fraction. In this study, we used liquid chromatography tandem mass spectrometry to determine the main GP classes and the most abundant PC, PE, and PS species in SF and NP fractions from the CSF of cognitively healthy study participants more than 70 years of age. We then compared GP levels between study participants classified as cognitively healthy (CH), minimally cognitively impaired (MCI), or late onset Alzheimer's disease (LOAD). Since we found differences in GPs associated with neurodegeneration, we measured PLA2 activity to determine its involvement in LOAD.
MATERIALS AND METHODS
Clinical methods
The local Institutional Review Board (Huntington Hospital, Pasadena, CA) approved our protocol and consent form, and all study participants gave written informed consent. Study participants were assessed using the Mini-Mental Status Examination and clinical dementia rating scale (25, 26). Briefly, 70 consecutive participants were classified as CH based on their having no evidence of cognitive impairment after uniform clinical and neuropsychological examinations; 40 participants were diagnosed after fulfilling the criteria for MCI (27); and of 40 participants with dementia, 29 were diagnosed after fulfilling the criteria for clinically probable LOAD (25, 26). Demographic and baseline CSF clinical measures are shown in Table 1. Lumbar CSF was obtained between 8:00 AM and 11:00 AM after an overnight fasting within one month of neuropsychological testing and centrifuged (1,500 g × 3 min) to remove cell debris. Lumbar CSF was immediately examined for total cells and total protein, and the remainder was stored in 1 ml aliquots at −80°C within 2 h after collection, until thawed for these experiments.
TABLE 1.
Demographic and CSF parameters in the clinical groups based on cognition
| Parameters | CH | MCI | LOAD |
| Number of subjects | 70 | 40 | 29 |
| Female (%) | 61 | 60 | 55 |
| Mean ± SD | |||
| Age (years) | 77.2 ± 6.8 | 77.0 ± 7.0 | 77.4 ± 9.6 |
| BMIa | 1.7 ± 0.8 | 1.8 ± 0.8 | 1.6 ± 0.8 |
| Aβ42 (pg/ml) | 722 ± 299 | 754 ± 268 | 506 ± 231 |
| Tau (pg/ml) | 273 ± 149 | 265 ± 168 | 473 ± 222 |
| Aβ42/Tau | 3.4 ± 2.2 | 3.9 ± 2.3 | 1.4 ± 1.3 |
| CSF protein (μg/ml) | 399 ± 16) | 414 ± 15 | 403 ± 19 |
Diagnoses for CH, MCI, and LOAD were made on standard clinical criteria described in Methods.
BMI: Underweight = 0, Normal weight = 1, Overweight = 2, Obese = 3.
Materials
HPLC-grade water, 2-isopropanol, and anhydrous acetonitrile were purchased from VWR (West Chester, PA). Ammonium acetate and butylated hydroxytoluene (BHT) were purchased from Sigma (St Louis, MO). PC(17:0/17:0), PC(11:0/11:0), PC(16:0/18:0), PC(16:0/18:1), PC(16:0/18:2), PC(18:0/16:0), PC(16:0/16:0), PC(18:0/18:0), PC(20:0/20:0), PC(16:0/20:4), PC(16:0/20:5), PC16:0/22:6), PE(17:0/17:0), PS(17:0/17:0) and lysophosphatidylcholine [LPC(17:0)] standards were purchased from Avanti Polar Lipids (Alabaster, AL). N-arachidonoyl phosphatidylethanolamine, D4-PAF, and D4-LPC were purchased from Cayman Chemical (Ann Arbor, MI).
CSF Aβ42 and Tau
CSF concentrations of Aβ42 and Tau were measured using a sandwich ELISA kit (Innotest β-amyloid(1-42) and Innotest hTAU-Ag (Innogenetics, Gent, Belgium) according to the manufacturer's protocol.
CSF fractionation and GP extraction
CSF membranes were prepared as described (24). Briefly, 4 ml of CSF was centrifuged at 17,000 g, and the resulting supernatant fluid was centrifuged again at 200,000 g. The final SF was stored at −80°C, and the pellet containing CSF nanoparticles was washed with 4 ml of PBS, repelleted at 200,000 g, and the final pellet (NP) was resuspended in 25–200 µl of PBS. After adding internal standards (IS) and retention time calibrants [5 ng PC(11:0/11:0), 1 ng D4-PAF, 5 ng LPC(11:0), and 5 ng D4-LPC)] to 1 ml SF from the original 4 ml of CSF, GPs were extracted using a modified Bligh and Dyer procedure (28). Briefly, 2 ml methanol containing 0.2 mg/ml BHT and 1 ml chloroform was added to CSF to obtain a monophase at room temperature. After vigorous mixing for 10 min, 2 ml chloroform and then 1 ml water containing 1M NaCl were added to separate a lipid-rich chloroform layer, which was then aspirated to clean borosilicate culture tubes. For the NP fraction, 40% of the suspended pellet derived from the original 4 ml of CSF was suspended in 1 ml water containing 1 M NaCl, IS, and then extracted as described above. The GP-rich chloroform layers from SF or NP were dried under a stream of N2, and 40% from each fraction was reconstituted in HPLC solvent for LC-MS/MS analyses.
Determination of protein in CSF fractions
SF and NP fractions were diluted using PBS, and protein amounts were determined using a florescence-based Quant-iT™ protein detection kit (Invitrogen, Eugene, OR) with 0–500 ng/μl BSA as standards.
Hydrophilic interaction liquid chromatography of GPs
Hydrophilic interaction liquid chromatography (HILIC) was performed using an HP-1100 system equipped with an autosampler, a column oven maintained at 35°C, and a binary pump. GP extracts were separated using a TSK-Gel Amide-80 Column (2.0 × 150 mm) and a binary solvent system of 20% acetonitrile in isopropanol (solvent A) containing 8% solvent B (20% water in isopropanol containing 10 mM ammonium acetate) at a flow rate of 0.2 ml/min. The starting solvent mixture was maintained for 5 min followed by a linear increase to 20% solvent B in 20 min, maintained at 20% B for 25 min, and then equilibrated with solvent A for 15 min before subsequent injections.
Positive ion ESI/MS/MS
GPs eluting from the HILIC column were positively ionized in ESI and detected using several MS scanning modes in a triple quadrupole mass spectrometer (TSQ Classic, Thermo Fisher Scientific, San Jose, CA.) The MS was operated with a spray voltage of 4.5 kV, heated capillary temperature of 300°C, with nitrogen (50 units) and argon (5 units) as the sheath gas and auxiliary gas, respectively. xPE (retention time [RT] 1.6 min) and PE (RT 4.5) were obtained using neutral ion loss scan of 141 with acquisition mass range of 660–880. NAPE (RT 1.8) was acquired using precursor ion scanning m/z 551 with a range of 900–1,050. PC (RT 12.6) was acquired using precursor ion scanning m/z 184 with a range of 630–920. PC(11:0/11:0) IS (RT 14.9) was acquired using selected reaction monitoring (SRM) of m/z 595 (precursor ion) to 184 (product ion). PS (RT 13.5) was acquired using neutral ion loss of 185 with a mass range of 645–900. PAF-like lipids (RT 22.5) were acquired using precursor scanning m/z 184 with a mass range of 440–630. LPC (RT 26 min) was acquired using precursor ion scanning m/z 104 with a mass range of 440–580. D4-PAF was acquired using SRM of m/z 528 (precursor ion) to 184 (product ion), and D4-LPAF was acquired using SRM of 486 (precursor ion) to 184 (product ion). LPC(11:0) was acquired using precursor ion scan of m/z 104 and by SRM of m/z 426 (precursor ion) to 104 (product ion). All GP scans were optimized with respect to collision energies, and data was collected using three different scan windows from 0–6 min, 6–14.5 min, and 14.5–40 min. Our instrument was rated for two decimal places mass measurement, and thus exact mass measurements were not possible. However, this limitation was circumvented in our study when we quantified only GP species that were isotopically resolved using the analysis strategies described below. Complete experimental MS parameters are reported in the supplementary methods.
LC-MS/MS data analyses
Peak areas for all GPs were integrated using the Qual Browser module of the Xcalibur software (Thermo Fisher, San Jose, CA). All integrated GP peak areas were normalized to PC(11:0/11:0) used as an IS. For quantification, known amounts of GPs and a fixed amount of IS (5 ng) were run separately, and standard curves of GP amount versus GP/PC(11:0/11:0) were obtained. From the ensuing standard curves, quantities of GPs were calculated for SF (ng/ml CSF) or for NP (ng/ml CSF equivalent). PC, PE, and PS molecular species were identified using the spectra function of the Qual Browser software. The other components of the IS mix [(D4-PAF, D4-LPAF, LPC(11:0)] were used as retention time calibrants for PAF, LPAF, and LPC, respectively. The major molecular species were identified using Lipid Maps MS tools (www.lipidmaps.org), and masses of the most intense molecular species not encumbered by isobars were extracted. Peak intensities of the extracted ions were compared with the IS [PC(11:0/11:0)], and amounts were estimated using standard curves for PC, PE, and PS, respectively.
Isobaric peaks
In CSF samples with lipids over a wide, dynamic range of abundance and heterogeneity, isobaric interferences are a concern. We approached this problem by carefully reviewing PC species using the Quan software (Thermo Fisher, San Jose, CA) to extract 0.5 min spectral segments across the PC peak. The exact mass from each segment was exported to an Excel spreadsheet and then sorted by peak intensities. After deleting peaks with intensities less than 100, the data was sorted by increasing m/z. Once all spectral peaks from each segment were combined, we isolated isobaric peaks that decreased from the parent m/z from authentic PC peaks that increased relative to the preceding peak. Examples of these can be seen in supplementary Fig. I (methods) and supplementary Table I (data). To be conservative, we only selected a peak that was of equal or higher intensity compared with the odd m/z isobars. We demonstrated that the abundance of the isobars in our method is predictable with little variation, as seen in the analyses of isobars for 10 commercial lipid standards [supplementary Fig. I-B (methods)].
Multiple reaction monitoring of GP species
In addition to parent ion or neutral ion loss scanning of GPs, targeted analyses were performed for selected PC, oxidized PC, nitrated PC or short-chain PC species using multiple reaction monitoring (MRM). PC and LPC species were selected using published molecular species tables (29) supplemented with m/z selected from the Lipid Maps database from the mass range 558–986 (www.lipidmaps.org). Only PC species that are not burdened by isobaric interference were included in our studies. Oxidized PC masses were from published data (30, 31). Details of the MS parameters for these MRM studies and a list of targeted GP species are reported in the supplementary methods. The major groups include 121 transitions for PC species, 36 transitions for PAF-LL and short-chain PC species, and 33 transitions for LPC species. We do not notice any differences in collision energy or tube lens voltage for different PC species [supplementary Fig. II (methods)]; therefore, we used standardized values in all our studies.
PLA2 activity assay
A modified liposomal-based fluorescent assay was used to measure PLA2 activity in CSF samples (32). Briefly, a PLA2 substrate cocktail consisting of 7-hydroxycoumarinyl-arachidonate (0.3 mM), 7-hydroxycoumarinyl-linolenate (0.3 mM), hydroxycoumarinyl-6-heptenoate (0.3 mM), 10 mM dioleoylphosphatidylcholine (DOPC), and 10 mM dioleoylphosphatidylglycerol (DOPG) was prepared in ethanol. Liposomes were formed by gradually adding 77 μl substrate/lipid cocktail to 10 ml PLA2 buffer (50 mM Tris-HCl at pH 8.9, 100 mM NaCl, 1 mM CaCl2) while stirring rapidly over 1 min using a magnetic stirrer (Invitrogen EnzChek® phospholipase A2 assay). CSF containing 10 μg total protein was added to 96-well plates, and PLA2 activity was initiated by adding 50 μl substrate cocktail. Fluorescence (excitation at 360 nm and emission at 460 nm) was measured, and specific activity [relative fluorescent units (RFU)/µg protein/min] for each sample was calculated.
Statistical analyses
All GP data are presented as the mean ± SEM (ng/ml) or as a percentage of total in the SF or NP fractions. A small number (< 5) of CSF samples was not available for analyses because of defective sample preparation or less than ideal sensitivity for LC-MS/MS detection. Differences in GP content of SF and NP fractions were determined using a Student paired t-test. Kruskal-Wallis and Mann-Whitney tests were performed to determine the presence of significant differences in GP levels or PLA2 activity between CH, MCI, and LOAD study participants. All analyses were performed using GraphPad Prism software (La Jolla, CA), and significance was set at the 5% level for rejecting the null hypothesis.
RESULTS
GP class composition in SF and NP
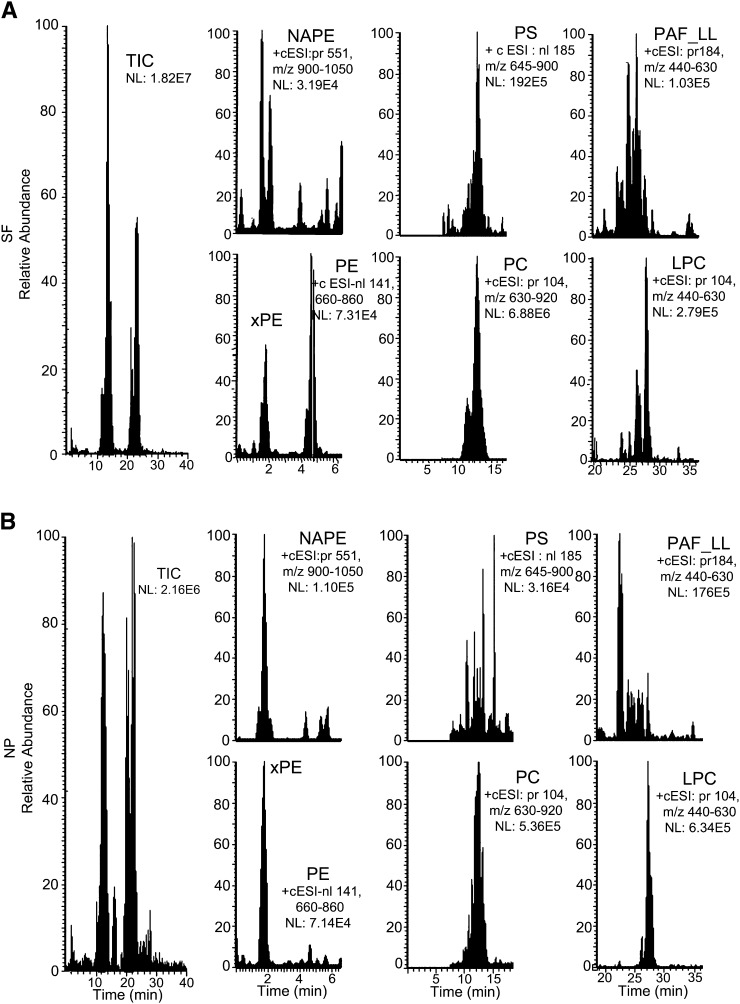
We initially examined the composition of SF and NP GPs using positive ion ESI LC-MS/MS. The total ion current (TIC) shows that both SF and NP have several GP classes (Fig. 1). GP-specific neutral ion loss monitoring or parent ion monitoring revealed the expression of xPE, NAPE, PE, PS, PC, PAF-LL, and LPC in SF. Phosphatidylinositol (PI), phosphatidic acid (PA), and phosphatidylglycerol (PG) were not reliably detected using positive ion ESI and may require development of negative ion ESI for sensitive detection. Of the GPs detected in SF using positive ion ESI, PC accounted for 99.1% (Table 2). Similar to SF, several GPs were detected in NP, but the levels of PS were below the limit of detection for most NP samples. The distribution of detected GPs was different between SF and NP (Table 2). For example, whereas the proportion of PC (NP/SF) in NP was about 0.7 of that in SF, the proportions of other GPs were higher in NP. This was seen when the lipid content is normalized to volume (Table 2) or to total protein content (Table 3) of CSF. The proportion of LPC to PC was also higher in NP than SF. Together our data show the detection of several GP classes and their differential distribution between the SF and NP fractions from CSF of CH study participants.
Fig. 1.
LC-MS/MS of SF and NP GPs. GPs extracted from CSF SF or NP fractions were separated using HILIC and detected using tandem MS. The total ion current (TIC) and scan-specific chromatographs for NAPE, xPE and PE, PS, PC, PAF_LL, and LPC for SF (A) and NP (B). These data are representative of injections from 70 and 67 SF and NP, respectively.
TABLE 2.
GP levels in SF and NP normalized to CSF volume
| GP | SF (n = 70) | % Total (SF Mean) | NP (n > 66) | % Total (NP Mean) | NP/SF (% Total) |
| xPE | 1.35 ± 0.1 | 0.02 | 10.6 ± 0.7 | 14.1 | 705 |
| NAPE | 11.9 ± 1.6 | 0.13 | 7.8 ± 0.6 | 10.4 | 79.6 |
| PE | 43.9 ± 3.3 | 0.5 | 1.6 ± 0.1 | 2.1 | 4.4 |
| PC | 9030 ± 398 | 99.1 | 52.4 ± 6 | 69.7 | 0.7 |
| PS | 8.8 ± 0.7 | 0.1 | Low level | ND | ND |
| PAF_LL | 4.9 ± 0.5 | 0.1 | 0.08 ± 0.01 | 0.1 | 2.0 |
| LPC | 12.1 ± 1.3 | 0.1 | 2.7 ± 0.2 | 3.6 | 27.1 |
| LPC/PC | 0.0013 | 0.0519 | 39.9 |
GPs extracted from CSF supernatant fluid or NP were separated using HILIC and detected using MS. Amounts of each GP were quantified using standard curves, and data were expressed as the mean normalized to CSF volume (mean ± SEM, ng/ml). For each fraction, we used the mean values to estimate proportions of each detected GP (% Total) and to calculate the relative enrichment in NP compared with SF (NP/SF). We also calculated the proportion of LPC to PC (LPC/PC). Levels of PS in NP were very low (low level) or not detectable (ND).
TABLE 3.
GP levels in SF and NP normalized to protein content
| GP | SF (n = 70) | % Total (SF Mean) | NP (n > 66) | % Total (NP Mean) | NP/SF (% Total) |
| xPE | 0.0035 ± 0.0003 | 0.02 | 6.7 ± 0.5 | 9.8 | 491 |
| NAPE | 0.032 ± 0.004 | 0.14 | 5.0 ± 0.5 | 7.4 | 53.3 |
| PE | 0.108 ± 0.009 | 0.47 | 1.636 ± 0.5 | 2.4 | 5.1 |
| PC | 23.01 ± 1.36 | 99.1 | 52.4 ± 6 | 76.4 | 0.8 |
| PS | 0.024 ± 0.002 | 0.10 | ND | ND | ND |
| PAF_LL | 0.012 ± 0.001 | 0.05 | 0.08 ± 0.01 | 0.12 | 2.3 |
| LPC | 0.031 ± 0.003 | 0.13 | 2.7 ± 0.2 | 4.0 | 29.7 |
| LPC/PC | 0.0014 | 0.0519 | 37.1 |
GPs in SF and NP were quantified using LC-MS/MS as described in Methods. Amounts of each GP are expressed as the mean normalized to total the protein content of SF or NP (ng/μg). For each fraction, we used the mean values to estimate proportions of each GP (% Total) and to calculate the relative enrichment in NP compared with SF (NP/SF). We also determined the proportion of LPC to PC (LPC/PC). Levels of PS in NP were very low or not detectable (ND).
Molecular composition of the major GPs
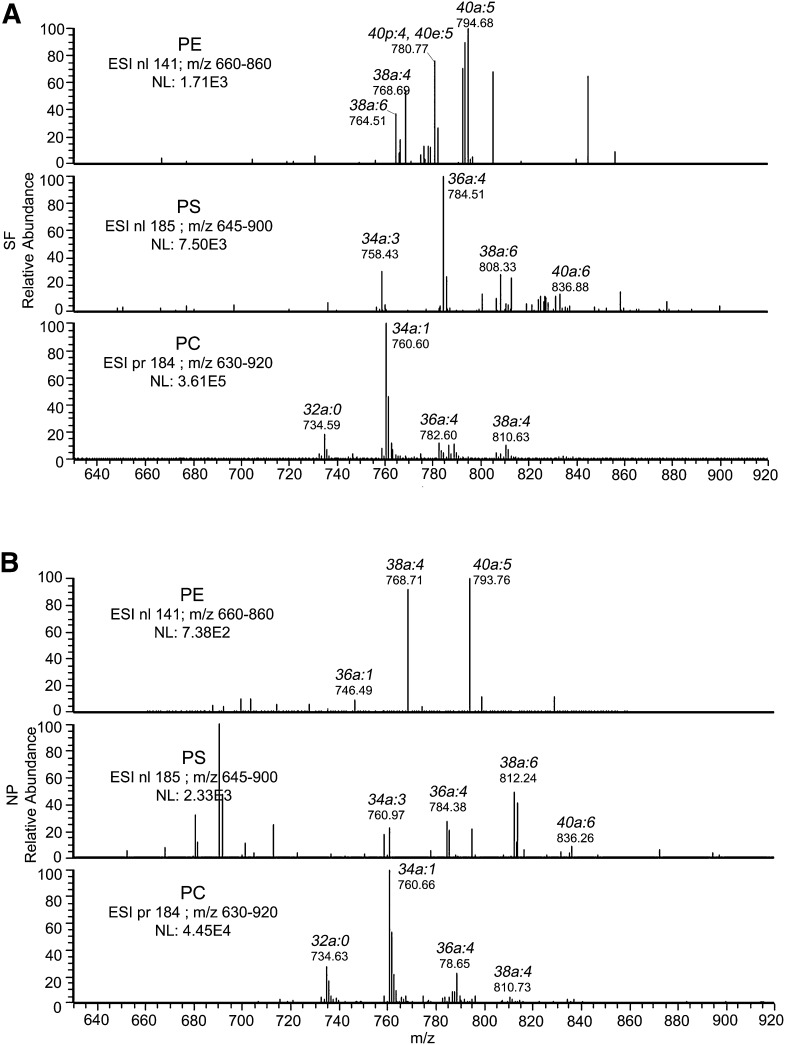
Using spectral analyses, we identified several molecular species of PE, PS, and PC in SF (Fig. 2A) and NP (Fig. 2B). In SF, the main molecular species of PE and PS had PUFAs. In contrast, the molecular species in PC were composed of unsaturated fatty acids, monounsaturated fatty acids, and proportionally less PUFAs. Several molecular species of PE found in SF were absent in NP, and several PS species found in NP were absent in SF. PC molecular species appeared identical in SF and NP, although their proportions might differ.
Fig. 2.
Spectra of major GPs in SF and NP. The major GPs from LC-MS/MS were processed using the spectral feature of Qual Browser software. Shown are the spectra for PE, PS, and PC for SF (A) and NP (B). These data are representative of 70 SF and 67 NP injections.
PC species in SF and NP
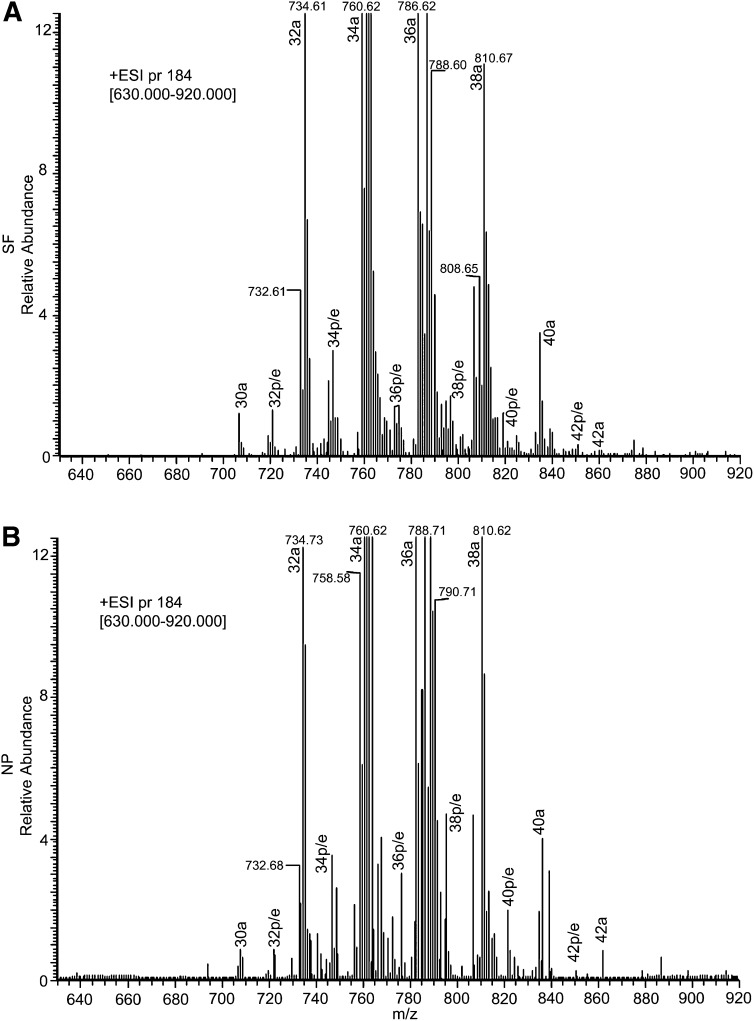
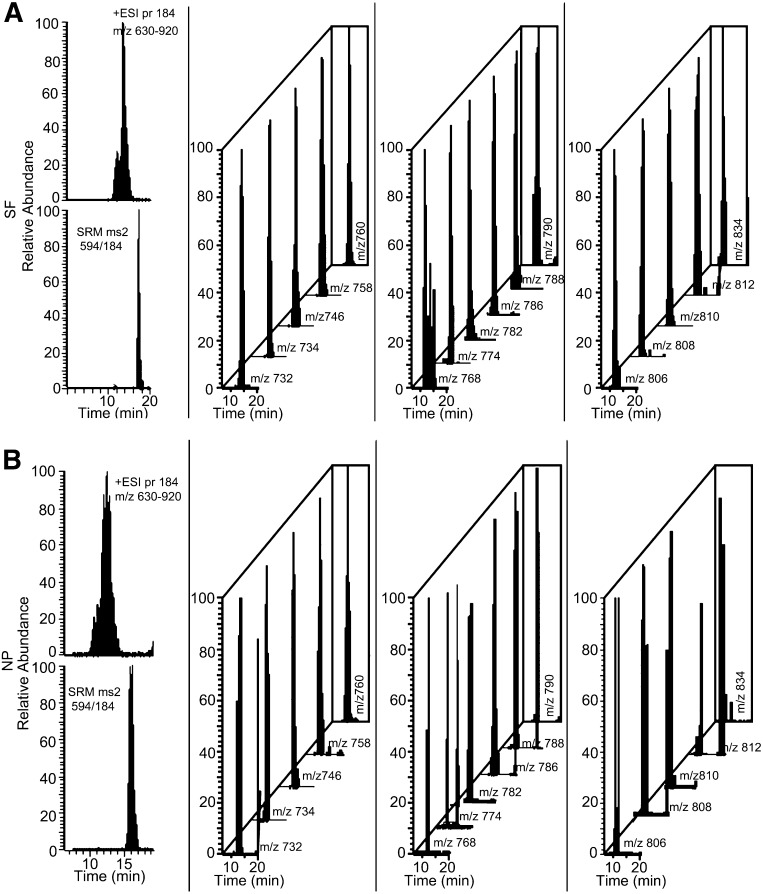
The high expression of PC in CSF allowed us to examine its molecular species in detail. Examination of PC spectrum in SF or NP showed several clusters of peaks with major m/z at 734, 760, 786, 810, and 834 (Fig. 3). These likely represent species with different carbon number due to the attachment of different fatty acids at the sn-1 (radyl-linked) or sn-2 (acyl-linked) position of glycerol. Thus, the main clusters corresponded to 32a, 34a, 36a, 38a, and 40a species, respectively. For most samples, smaller clusters of peaks also occurred at ∼706, 722, 746, 772, 796, 818, 850, and 874, likely corresponding to 1-ether-linked or 1-plasmologen-linked PC species (Fig. 3). For these clusters, we examined masses and identified at least 42 species that were not burdened by isobaric interference in CSF from CH subjects [Fig. 1 and supplementary Table I (data)]. The distribution of these species in SF showed diversity in composition, with different 1-acyl and 1-ether/1-plasmalogen species (Fig. 4A). Examination of PC molecular species in NP reveals a similar diversity as in SF (Fig. 4B).
Fig. 3.
PC spectra showing the major clusters in SF and NP. PC from LC-MS/MS was processed using the spectral feature of Qual Browser software. Shown are the PC spectra for SF (A) and NP (B). These data are representative of 70 SF and 67 NP injections and show major clusters of 1-acyl-linked, 1-ether-linked, and 1-plasmalogen-linked species in both SF and NP.
Fig. 4.
EICs of PC molecular species. The major PC molecular species were identified using a Lipid Maps algorithm. The most intense molecular species not influenced by isobars were extracted from LC-MS/MS chromatograph of SF and NP. Shown are the TIC, SRM of PC(11:0/11:0) internal standard, and EIC of PC species in SF (A) and NP (B). These data are representative of injections from 70 and 67 SF and NP, respectively.
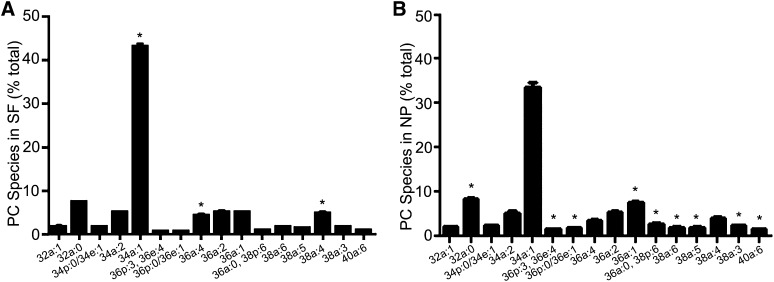
To compare levels of PC species between the SF and NP fractions, the mean of each species was expressed as a percentage of the total (Fig. 5). The major molecular species (m/z = 760.58, 34a:1) accounted for 43.2 ± 0.6% (n = 70) and 33.7 ± 1.1% (n = 61) for SF and NP, respectively. Proportions of some PC species were similar in both fractions (32a:1, 34p:0/34e:1, 34a:2, 36a:2); some PCs were higher in SF than NP (34a:1, 36a:4, 38a:4); others were higher in NP (32a:0, 36p:3/36e:4, 36p:0/36e:1, 36a:1, 36a:0/38p:6, 38a:6, 38a:5, 38a:3, 40a:6) (Fig. 5). The ratio of combined plasmalogen and ether-PC species to 1-acyl species was higher in NP (2.0 ± 0.2, n = 5) than in SF (1.2 ± 0.1, n = 15) (P < 0.05).
Fig. 5.
Distribution of selected PC species in SF and NP. After LC-MS/MS of SF and NP, selected PC species not encumbered by isobaric interference were identified using a Lipid Maps algorithm. These PC species were extracted and their intensities normalized to PC(11:0/11:0) as an internal standard. Amounts of each molecular species were determined and expressed as a percentage of total in each CSF fraction. These data are the mean ± SEM for SF (A) (n = 70), and NP (B) (n = 67). The P values were obtained using a paired t-test. (A) *P < 0.05 for three PC species whose proportion is higher in SF than in NP. (B) *P < 0.05 for nine PC species whose proportion is higher in NP than in SF, while the proportion of the four unmarked species are similar in both fractions (P > 0.05).
Targeted analyses of PC molecular species in SF and NP
With the availability of lipid databases (www.lipidmaps.org) and published data for GP molecular species (29), we used the more sensitive MRM to identify PC species in SF and NP. In agreement with the extracted ion chromatograph (EIC) study, we showed that SF and NP fractions [supplementary Fig. II (data)] are composed of several PC species. An interesting feature of our study is the resolution of some PC species into several peaks, indicating wide heterogeneity in GP composition of CSF lipids.
PE and PS molecular species in SF
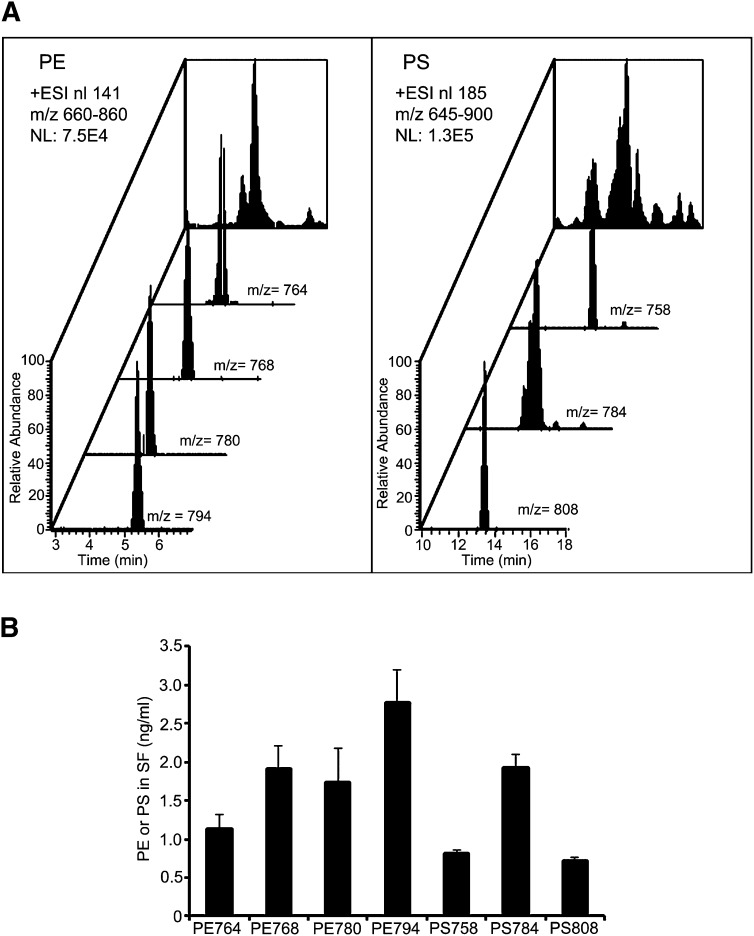
The high expression of some PE and PS molecular species in SF (Fig. 2) allowed us to examine these in more detail, whereas the much smaller amount available in NP prevented such analysis. EIC confirmed the presence of four PE and three PS species in SF (Fig. 6A). Fig. 6B shows the estimated levels of these species in SF.
Fig. 6.
Distribution of the top PE and PS molecular species in SF. After LC-MS/MS of SF, the four most intense PE and 3 PS molecular species were identified using a Lipid Maps algorithm (A). PE and PS molecular species were extracted, their intensities were normalized to PC(11:0/11:0) as an internal standard, and the levels were determined from standards curves (B). Data are the mean ± SEM (n = 70).
GPs in MCI and LOAD
After identifying GPs in CSF fractions from CH participants, we compared these to CSF fractions from age-matched study participants classified as MCI or LOAD in order to investigate the role of GP metabolism in neurocognitive decline.
Alteration in glycerophosphocholine-containing lipids in LOAD.
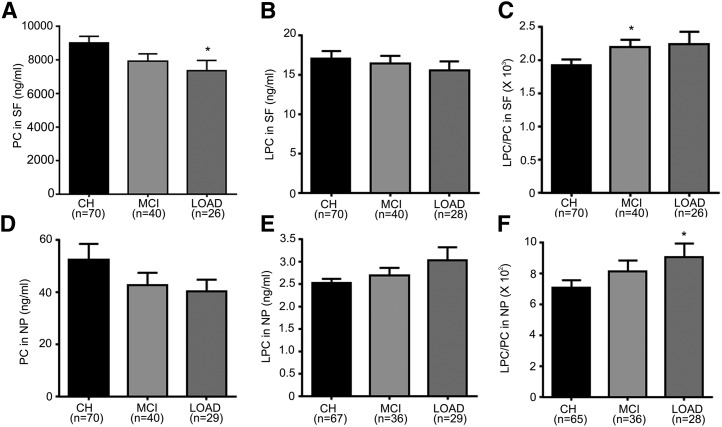
In the SF fractions, PC levels decrease in MCI (−12.3%) and LOAD (−18.3%, P < 0.05) compared with CH (Fig. 7A). Levels of LPC were not altered in MCI and LOAD compared with CH (Fig. 7B). However, the ratio LPC/PC was higher in MCI (14.6%, P < 0.05) and AD (16.7%) (Fig. 7C), and the total content of glycerophosphocholine (GPC) lipids (PC + LPC + PAF_LL) was significantly lower (P < 0.05) in LOAD (7.4 ± 0.6 μg/ml) compared with CH (9.1 ± 0.4 μg/ml).
Fig. 7.
GPC lipids change in LOAD. The levels of GPC lipids (PC, LPC, PAF_LL) in SF or NP were determined using LC-MS/MS. (A–C) Levels of PC, LPC, and LPC/PC, respectively, in SF for CH, MCI, and LOAD subjects. (D–F) Levels of PC, LPC, and LPC/PC, respectively, in NP for CH, MCI, and LOAD subjects. The number of samples for each group (n) is indicated for each group, and the bar is the mean ± SEM. Group comparisons were performed using Kruskal-Wallis test and comparisons using Mann-Whitney test. *P < 0.05.
In the NP fraction, PC decreased in MCI (−18.6%) and LOAD (−23.2%) compared with CH (Fig. 7D). In contrast, LPC increased in MCI (6.5%) and LOAD (20%) compared with CH (Fig. 7E). This resulted in a significant increase in the ratio LPC/PC in NP (Kruskal-Wallis P < 0.05) (Fig. 7F) of LOAD. Dunn's multiple comparison tests and Mann-Whitney test (P < 0.05) showed that the PC decrease with a concomitant increase in LPC levels in LOAD samples compared with CH accounted for the group difference in the ratio LPC/PC. Levels of PAF_LL decreased in MCI (−21.1%) and increased in LOAD (12.3%) but did not attain statistical significance (data not shown).
PC species levels were lower in LOAD.
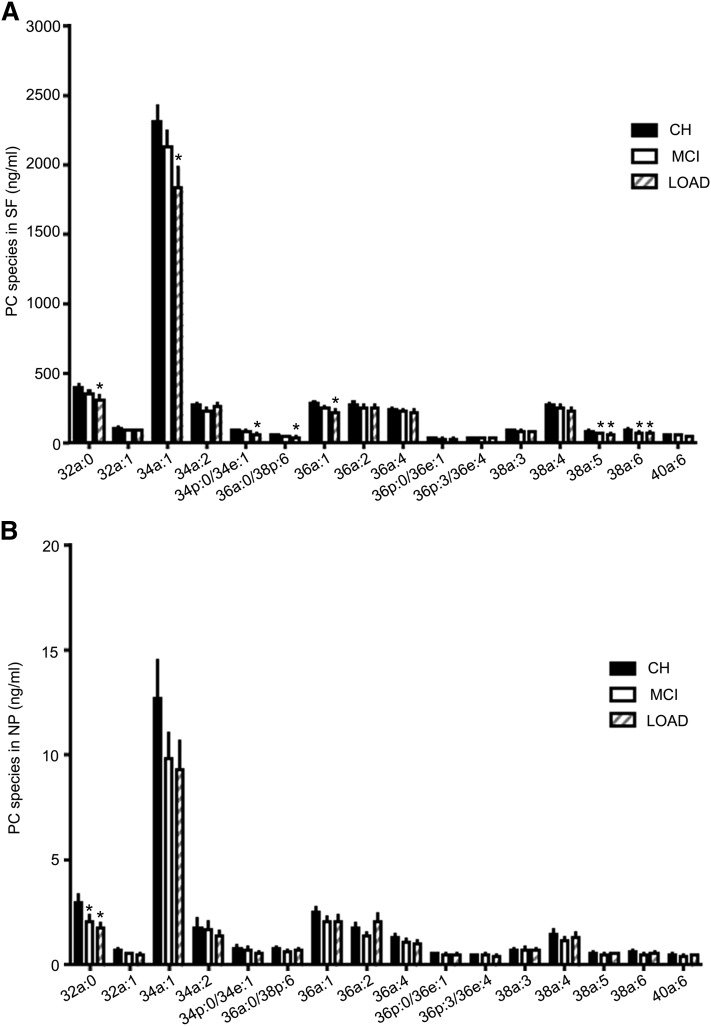
In SF, a Kruskal-Wallis test showed significant group differences in several PC species: PC(32a:0), PC(34p:0/34e:1), PC(34a:1), PC(34a:0), PC(36a:1), and PC(38a:5). For these PC species, a post-hoc analysis using Dunn's multiple comparison test showed significant differences between CH and LOAD (P < 0.05) but not between CH and MCI (Fig. 8A). Mann Whitney tests without correction confirmed the significant differences between CH and LOAD. Although no group differences were observed for PC(36a:0/38p:6) and PC(38a:6), direct comparison showed differences between CH and LOAD. Levels of PC(38a:5) and PC(38a:6) were also lower in MCI compared with CH (Fig. 8A).
Fig. 8.
PC species change in LOAD. Levels of selected PC species in SF or NP were determined using LC-MS/MS. (A) Levels of PC species in SF for CH, MCI, and LOAD subjects. (B) Levels of PC species in NP for CH, MCI, and LOAD subjects (mean ± SEM). Group comparisons were performed using Kruskal-Wallis test and comparisons using Mann-Whitney test. *P < 0.05 compared with CH.
For PC species in NP, Kruskal-Wallis test showed significant group differences in PC(32a:0), and Dunn's multiple comparisons test indicated that the decrease in AD compared with CH accounted for this difference (Fig. 8B). Mann-Whitney test showed a significant decrease in PC(32a:0) in MCI and AD compared with CH. Although most of the other PC species decreased in MCI and AD compared with CH, these changes did not attain statistical significance.
PE and PS differed in LOAD.
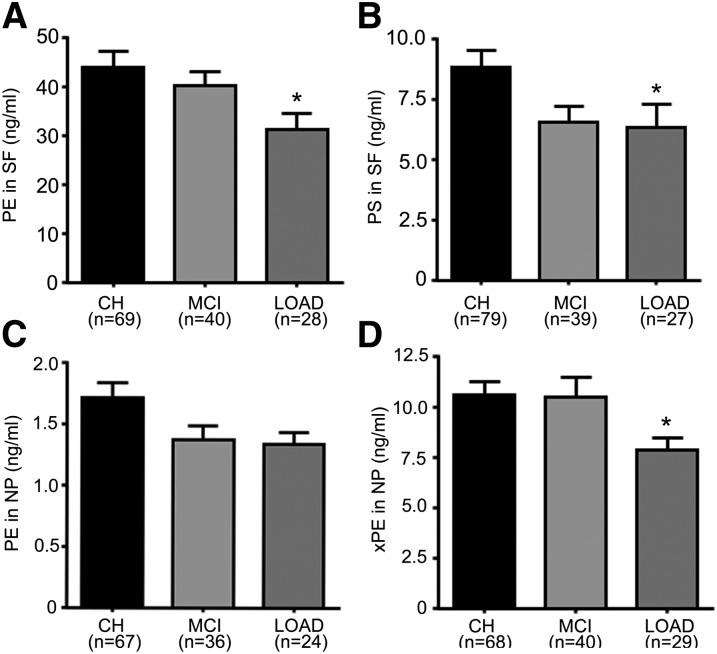
In SF, PE levels decreased in MCI (−4.3%) and LOAD (−25.4%, P < 0.05) compared with CH (Fig. 9A). Similarly, PS levels decreased in MCI (−25.8%) and LOAD (−28.1%, P < 0.05) compared with CH (Fig. 9B). In contrast, the levels of other PE lipids (xPE and NAPE) were not altered in SF of MCI or LOAD compared with CH (data not shown). In NP, PE levels were lower in MCI (−20%) and LOAD (−21.8%) compared with CH (Fig. 9C). Compared with CH, xPE levels in NP decreased more in LOAD (−25.5%, P < 0.05) than in MCI (−0.7%) (Fig. 9D).
Fig. 9.
PE and PS decrease in LOAD. Levels of PE and PS in SF and PE and xPE in NP were determined using LC-MS/MS. (A, B) Levels of PE and PS, respectively, in SF for CH, MCI, and LOAD subjects. (C, D) Levels of PE and xPE, respectively, in NP for CH, MCI, and LOAD subjects. The number of samples for each group (n) is indicated for each group, and the bar is the mean ± SEM. Group comparisons were performed using Kruskal-Wallis test and comparisons using Mann-Whitney. *P < 0.05 compared with CH.
PE and PS species levels were lower in LOAD.
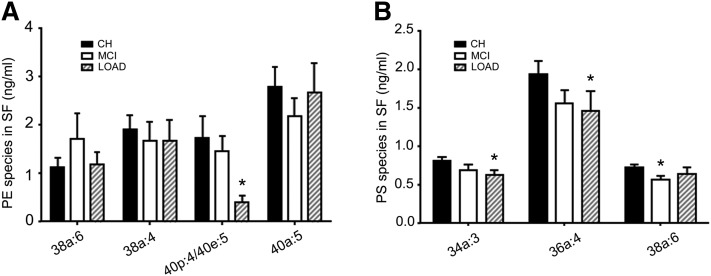
In the SF fractions, levels of PE species with m/z = 780 [PE(40p:4/40e:5)] decreased in MCI (−15.4) and LOAD (−76.2%, P < 0.05) compared with CH (Fig. 10A). Levels of other PE species with diacyl-linked fatty acids did not change in MCI/LOAD compared with CH (Fig. 10A). Compared with CH, levels of PS(34a:3) and PS(36a:4) decreased in LOAD by 26.5% (P < 0.05) and 36.6% (P < 0.05), respectively, whereas only the level of PS(38a:6) was reduced in MCI (−20.5%, P < 0.05) (Fig. 10B).
Fig. 10.
PE and PS species change in LOAD. Levels of PE (A) and PS (B) species in SF were determined using LC-MS/MS. Data are the mean ± SEM. Group comparisons were performed using Kruskal-Wallis test and comparisons using Mann-Whitney test. *P < 0.05 compared with CH.
PLA2 activity contributed to GP lipolysis in LOAD
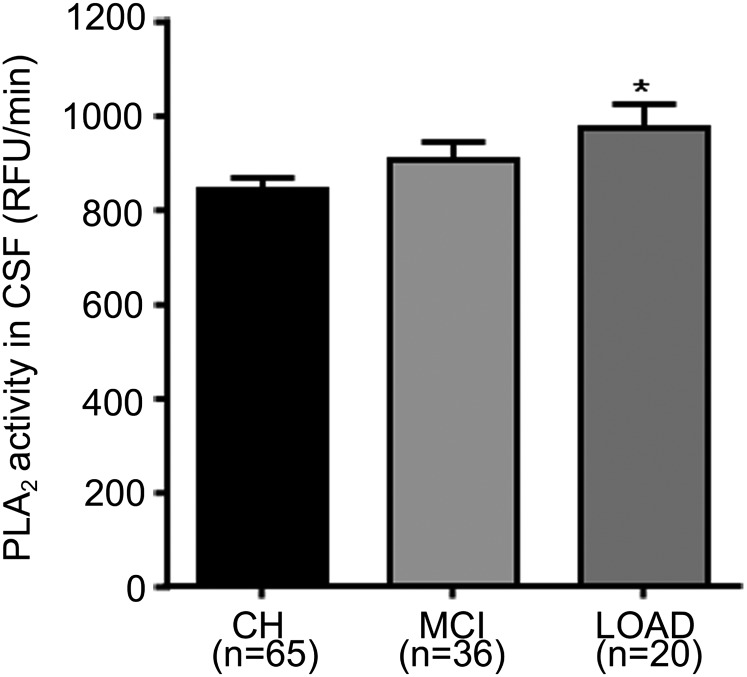
The decrease in GPs (Figs. 7 and 9) and the increase in LPC/PC in LOAD (Fig. 7) may arise from enzymatic or nonenzymatic processes. To examine the former, we measured PLA2 activity in CSF from CH, MCI, and LOAD, and we found that PLA2 activity was higher in MCI (7.6%) and LOAD (15.36%) (P < 0.05) (Fig. 11). These data demonstrate that decreased GP levels found in SF and NP fractions from LOAD participants resulted at least partly from increased PLA2 activity.
Fig. 11.
PLA2 activity increases in LOAD. PLA2 activity in CSF (10 μg protein per assay) was determined using a fluorescent assay. Data are expressed as the RFU per min for different clinical groups. Data are the mean ± SEM for CH, MCI, and LOAD. *P < 0.05 compared with CH.
DISCUSSION
CSF bathes and transports metabolites around the brain, and thus, its constituents reflect in vivo brain metabolism (33). Nanoparticles that we recently described in CSF have signaling functions and are likely derived from brain cells by exocytosis or autophagy (24). Here, our data showed compartmentalization of GPs between SF and NP fractions in support of their differential origins and/or metabolism. The GP composition in these fractions was altered as neurodegeneration progressed and corresponded to increases in PLA2 activity.
GP components of SF and NP from older CH adults
Both fractions of the CSF are rich in GPs, particularly in the NP fractions that are composed mainly of a heterogeneous group of 30–200 nm-sized particles (24). The SF components may represent metabolism in the interstitial fluids (CSF), whereas the NP is likely derived from brain cell membranes via exocytosis and may represent metabolism within the brain. Using LC-MS/MS, we present data of CSF GP composition of SF and membrane-rich NP fractions. LC-MS/MS is an attractive and complementary substitute for the often-used shotgun lipidomics approaches (34, 35). Using LC rather than direct infusion allows the measure of several lipid classes in the same analysis (36), especially important when sample availability is limited. This approach can be used for discovery of modified GP molecular species (37) as well as targeted MRM studies within a single analysis.
The amount of lipids recovered in the CSF fractions was markedly different. While the lipid/protein content was higher in NP, significantly lower amounts of lipids were recovered from NP compared with SF. For example, whereas SF yielded 9,030 ng/ml PC, only 52 ng per ml equivalent was recovered in NP (Tables 2 and 3). We would expect to identify many more GP molecular species in the NP fractions if a greater quantity was prepared. However, the choice of limiting the source CSF to 4 ml was based on enabling this analysis from most (67/70) of our study participants.
The differences in the distribution of detected GPs in SF using positive ion ESI compared with NP may have structural and functional importance. Whereas PC is the major GP in both fractions, higher PC in SF compared with NP and the presence of more plasmalogen/ether lipids in NP suggests compartmentalization of lipid metabolism. NAPE is known to have antioxidant capacity, is a precursor of endocannabinoid (38–40), and is enriched in NP compared with SF. Furthermore, higher proportions of PUFAs exist in certain GP pools, and the plasmalogen/ether lipids and NAPE we found in NPs may reflect efforts to protect brain PUFAs from oxidation. These differences in GP composition of SF compared with NP support the notion that GPs in these fractions may be regulated differently.
GPs differed in LOAD
The richness and diversity of CSF GPs with their known important biological roles and their compartmentalization in NPs versus SFs justified further study to examine CSF fluid and membrane preparations from different disease groups. Here, we investigated whether the GPs measured were different between age-matched CH, MCI, and LOAD participants. We found that GP levels decreased progressively from CH to MCI, and from MCI to AD, with PC, PE, and PS values in LOAD decreasing the most in SF. In contrast, LPC levels in NP and the ratio LPC/PC in both SF and NP increased in LOAD compared with CH.
Measurement of the most abundant PC species in CSF indicated a major decrease in SF compared with NP fractions. There was no substrate-specific decrease, with unsaturated, monounsaturated, polyunsaturated, and diradyl-linked PC species decreasing in SF. In contrast to PC, a PE species (putatively identified as plasmalogen PE) was drastically reduced in SF. Together, our data in this cross-sectional study show that GP composition of CSF nanoparticles and fluid fractions differ between healthy people and those with LOAD, whereas the CSF GPs from people with MCI are intermediate.
PLA2 activity contributed to LOAD
The decrease in PC in both CSF fractions accompanied by an increase LPC in NP suggests that a PLA2 activity may be involved in GP lipolysis, a process that may contribute to LOAD pathology. A slight increase in PLA2 activity in MCI and a significant increase in PLA2 activity in LOAD are evidence that PLA2 is involved in LOAD pathology. Several important characteristics of PLA2 activity in CSF are evident from our study. First, the decrease in GPs is found in both SF and NP, suggesting that cytosolic or membrane-bound enzymes may be involved. Second, several GP substrates are hydrolyzed, suggesting nonsubstrate specificity or involvement of different PLA2 isoforms in LOAD. Studies support the role of different PLA2 isoforms in AD (20, 23, 41). Third, whereas different subclasses of PC are hydrolyzed in LOAD, the biggest decrease in any GP species is the greater than 75% decrease in PE (m/z 780) that corresponds to PE(40p:4/40e:5). A plasmalogen-specific PLA2 is implicated in AD pathology and may be responsible for the depletion of brain plasmalogen in AD (20). These data show more specificity in the degradation of PE plasmalogen but not PC and PS species in LOAD compared with CH.
Increased expression or activation of PLA2 contributes to the digestion of GPs. Hydrolysis of GPs can perturb membrane structures, exposing membrane-bound amyloid precursor proteins to abnormal digestion and production of toxic peptides, consistent with reports of colocalization of PLA2 with amyloid plaques (23). Disturbance of membrane structures can also impede the transport and clearance of neurotoxic amyloid peptides (42, 43). PLA2 products have inflammatory properties that can exacerbate the damage to brain tissues (44, 45). Thus, the increase in PLA2 activity that we measured in CSF may be expected to worsen LOAD pathophysiology by destroying cell membranes or by generating inflammatory molecules.
Role of GP metabolism in clinical groups
Overall, our studies show that GPs, PLA2, and amyloid peptides are involved in LOAD pathology. It is difficult to determine the relationship between these major molecules in the context of a complex organ such as the brain, but several links can be proposed in the three different clinical groups, CH, MCI, and LOAD. Differences that we measured in CSF fractions and clinical groups are summarized in Table 4.
TABLE 4.
Summary of GPs in CSF fractions and their alteration in clinical groups
| CSF | CH (n = 70) | MCI (n = 40) | LOAD (n = 29) |
| SF fraction | PC >>> PE > LPC > NAPE > PS > PAF_LL > xPE | PC (↓) | PC (↓↓) |
| LPC/PC (↑↑) | PE (↓↓) | ||
| PE and PS enriched with PUFA | PC(38a:5) (↓↓) | PS (↓↓) | |
| PC(38a:6) (↓↓) | LPC/PC (↑) | ||
| PS(38a:6) (↓↓) | 7 PC speciesa (↓↓) | ||
| PE (40p:4/40e:5) (↓↓) | |||
| NP fraction | PC >> xPE > NAPE> LPC > PE > PAF_LL, [PS(ND)] | PC and PE (↓) | LPC (↑) |
| Lipid enriched with SAFA, MUFA, PUFA | PC(32a:0) (↓↓) | xPE coelutes with NAPE (↑↑) | |
| PLA2 activity | Increased (↑) | Increased (↑↑) | |
| Interpretation | i) NP and SF rich in GPs that differ in distribution between these fractions | i) Increased GP lipolysis and oxidation | i) Breakdown of lipids, |
| ii) Reflects interstitial fluid and membrane metabolism in normal aging | ii) Early evidence of neuroinflammation | ii) Enzymatic lipolysis | |
| iii) Evidence of extensive inflammation |
We recruited CH, MCI, and LOAD study participants and fractionated their lumbar CSF into SF and NP fractions. Levels of GP were reliably detected using positive ion ESI and were quantified for the CH population (PI, PG, PA were not measured). Their direction of alterations within clinical groups and pathological significance in each clinical group are shown. Labels for GP levels in CSF fractions and the alterations in GPs and PLA2 activity in clinical groups: >, greater than; >> much greater than; >>> much more greater than; ↑, increased compared with CH; ↑↑, significantly increased compared with CH; ↓, decreased compared with CH; ↓↓ significantly decreased compared with CH. SAFA, saturated fatty acid; MUFA, monounsaturated fatty acid; ND, not determined.
Seven PC species include 32a:0, 34a:1, 34p:0/34e:1, 36a:0/38p:6, 36a:1, 38a:5, and 38a:6.
Normal aging is accompanied by a gradual decrease and change in brain lipid composition (18), and in our CH population, there was normal GP turnover with homeostatic control of inflammatory lipid levels in the SF and NP fractions. Under these conditions, processing of amyloid precursor protein and lipid-associated clearance of neurotoxic peptides are not hindered, PLA2 activity is at a ‘normal level,” and neuroinflammation is controlled, resulting in slower neurodegeneration.
In the MCI population, demographic, clinical, and genetic factors linked to the transport of lipids do not contribute to the changes in GPs compared with CH. But in MCI, there is mild disturbance in GP metabolism shown by a slight increase in PLA2 activity in CSF that accompanies a decrease in GPs in SF and NP fractions compared with CH. The increase in PLA2 activity in MCI is consistent with the increase in the product (LPC) to substrate (PC) ratio in both SF and NP fractions. This might result in mild neuroinflammation that is independent of Aβ42 formation in MCI. Interestingly, in the SF fraction from MCI participants, only three GP species containing PUFAs [PC(38a:5), PC(38a:6), and PS(38a:6)] were significantly decreased compared with CH. Given studies suggesting that omega-3 PUFAs, such as eicosapentaenoic acid (EPA) and docosahexaenoic acid (DHA), are important in cognitive function and memory (46), the decrease we observed in CSF may indicate early evidence of metabolic dysfunction in omega-3 PUFA metabolism. Oxidative stress linked to PUFA degradation in addition to increased PLA2 activity may also contribute to the increased LPC/PC ratio that we reported. Regardless of the mechanisms that account for altering GP levels, the decrease in PUFAs in MCI compared with CH may impair neuronal function. These potential mechanisms become important when considering the prevention of cognitive impairment in an elderly population. Our study contributes to the scientific basis for using anti-inflammatory or antioxidant agents in the MCI population to delay its progression to LOAD (47, 48). Moreover, the altered GP species we reported in CSF from the particulate and SF fractions can be measured to estimate the efficacy of these therapies on inflammatory and oxidative damage in patients.
In the LOAD population, widespread disturbance in GP metabolism is shown by a significant decrease in PC, PE, and PS in the SF fraction and by the increase in LPC/PC in both SF and NP fractions. These modifications in GP compositions may change cell membrane fluidity, alter amyloid precursor protein processing, and influence the release of neurotoxic Aβ42 (49, 50). An increase in PLA2 activity combined with the higher LPC/PC in CSF is evidence of neuroinflammation in LOAD. Given studies showing that NAPE and plasmalogens have antioxidant properties (51), our results showing a decrease in a phosphoethanolamine-containing lipid that coelutes with NAPE in NP and in a plasmalogen-PE in SF of LOAD, suggest decreased antioxidant capacity in LOAD compared with CH. These differences in CSF lipids in both fluid and membrane fractions reflect major changes in the brain of LOAD participants.
Conclusion
Our studies, summarized in Table 4, show GP composition that differs between CSF particulate and SFs from CH study participants and that are further altered in MCI and LOAD with the involvement of PLA2 activity. However, much more research is required to understand the roles of GPs and PLA2 in LOAD. Studies that identify the involvement of specific PLA2 isoforms or testing inhibitors of PLA2 may reveal biomarkers or means of preventing the disturbance of GP metabolism in MCI and LOAD (52, 53). We propose that an integrated treatment strategy involving anti-inflammatory and antioxidant agents that stabilize GP composition in MCI subjects may be important in preventing the pathological consequences of altered GP metabolism (47, 48).
Supplementary Material
Acknowledgments
The authors thank all study participants for their time and for donating CSF. The authors are grateful to the faculty and students of Fuller Seminary Neuropsychology Program for assisting in classifying the study participants. The authors thank Sherri Lee and Elizabeth Trejo for help in CSF collection and managing study participants.
Footnotes
Abbreviations:
- AD
- Alzheimer's disease
- CSF
- cerebrospinal fluid
- CH
- cognitively healthy
- CSF
- cerebrospinal fluid
- EIC
- extracted ion chromatograph
- GP
- glycerophospholipid
- GPC
- glycerophosphocholine
- HILIC
- hydrophilic interaction liquid chromatography
- IS
- internal standard
- LOAD
- late onset Alzheimer's disease
- LPC
- lysophosphatidylcholine
- MCI
- minimally cognitively impaired
- MRM
- multiple reaction monitoring
- NAPE
- N-acyl phosphatidylethanolamine
- NP
- nanoparticle
- PAF_LL
- platelet-activating factor-like lipids
- PC
- 1-radyl-2-acyl-sn-glycerophosphocholine
- PE
- 1-radyl-2-acyl-sn-glycerophosphoethanolamine
- PS
- 1,2-diacyl-sn-glycerophosphoserine
- RFU
- relative fluorescent unit
- SF
- supernatant fluid
- SRM
- selected reaction monitoring
- TIC
- total ion current
- xPE
- unknown lipid containing phosphoethanolamine
This work was supported by the L.K. Whittier Foundation and the Helen Posthuma Foundation.
The online version of this article (available at http://www.jlr.org) contains supplementary data in the form of one table (data), two figures (data) and two figures (methods).
REFERENCES
- 1.Fahy E., Subramaniam S., Murphy R. C., Nishijima M., Raetz C. R., Shimizu T., Spener F., van Meer G., Wakelam M. J., Dennis E. A. 2009. Update of the LIPID MAPS comprehensive classification system for lipids. J. Lipid Res. 50(Suppl.): S9–S14 [DOI] [PMC free article] [PubMed] [Google Scholar]
- 2.Adibhatla R. M., Hatcher J. F. 2008. Altered lipid metabolism in brain injury and disorders. Subcell. Biochem. 49: 241–268 [DOI] [PMC free article] [PubMed] [Google Scholar]
- 3.Bazan N. G. 2005. Lipid signaling in neural plasticity, brain repair, and neuroprotection. Mol. Neurobiol. 32: 89–103 [DOI] [PubMed] [Google Scholar]
- 4.Fonteh A. N., Harrington R. J., Huhmer A. F., Biringer R. G., Riggins J. N., Harrington M. G. 2006. Identification of disease markers in human cerebrospinal fluid using lipidomic and proteomic methods. Dis. Markers. 22: 39–64 [DOI] [PMC free article] [PubMed] [Google Scholar]
- 5.Piomelli D., Astarita G., Rapaka R. 2007. A neuroscientist's guide to lipidomics. Nat. Rev. Neurosci. 8: 743–754 [DOI] [PubMed] [Google Scholar]
- 6.Rapoport S. I. 2001. In vivo fatty acid incorporation into brain phosholipids in relation to plasma availability, signal transduction and membrane remodeling. J. Mol. Neurosci. 16: 243–261 [DOI] [PubMed] [Google Scholar]
- 7.Kramer R. M., Jakubowski J. A., Deykin D. 1988. Hydrolysis of 1-alkyl-2-arachidonoyl-sn-glycero-3-phosphocholine, a common precursor of platelet-activating factor and eicosanoids, by human platelet phospholipase A2. Biochim. Biophys. Acta. 959: 269–279 [DOI] [PubMed] [Google Scholar]
- 8.Farooqui A. A., Horrocks L. A. 2004. Brain phospholipases A2: a perspective on the history. Prostaglandins Leukot. Essent. Fatty Acids. 71: 161–169 [DOI] [PubMed] [Google Scholar]
- 9.Six D. A., Dennis E. A. 2000. The expanding superfamily of phospholipase A(2) enzymes: classification and characterization. Biochim. Biophys. Acta. 1488: 1–19 [DOI] [PubMed] [Google Scholar]
- 10.Khaselev N., Murphy R. C. 1999. Susceptibility of plasmenyl glycerophosphoethanolamine lipids containing arachidonate to oxidative degradation. Free Radic. Biol. Med. 26: 275–284 [DOI] [PubMed] [Google Scholar]
- 11.Jonas A. 2000. Lecithin cholesterol acyltransferase. Molecular and Cell Biology of Lipids. 1529: 245–256 [DOI] [PubMed] [Google Scholar]
- 12.Astarita G., Piomelli D. 2009. Lipidomic analysis of endocannabinoid metabolism in biological samples. J. Chromatogr. B Analyt. Technol. Biomed. Life Sci. 877: 2755–2767 [DOI] [PMC free article] [PubMed] [Google Scholar]
- 13.Basavarajappa B. S. 2007. Critical enzymes involved in endocannabinoid metabolism. Protein Pept. Lett. 14: 237–246 [DOI] [PMC free article] [PubMed] [Google Scholar]
- 14.Piomelli D., Giuffrida A., Calignano A., Rodriguez De F. F. 2000. The endocannabinoid system as a target for therapeutic drugs. Trends Pharmacol. Sci. 21: 218–224 [DOI] [PubMed] [Google Scholar]
- 15.Wang J., Ueda N. 2009. Biology of endocannabinoid synthesis system. Prostaglandins Other Lipid Mediat. 89: 112–119 [DOI] [PubMed] [Google Scholar]
- 16.Tyurina Y. Y., Shvedova A., Kawai K., Tyurin V. A., Kommineni C., Quinn P., Schor N., Fabisiak J., Kagan V. 2000. Phospholipid signaling in apoptosis: peroxidation and externalization of phosphatidylserine. Toxicology. 148: 93–101 [DOI] [PubMed] [Google Scholar]
- 17.Farooqui A. A., Liss L., Horrocks L. A. 1988. Neurochemical aspects of Alzheimer's disease: involvement of membrane phospholipids. Metab. Brain Dis. 3: 19–35 [DOI] [PubMed] [Google Scholar]
- 18.Kosicek M., Hecimovic S. 2013. Phospholipids and Alzheimer's disease: alterations, mechanisms and potential biomarkers. Int. J. Mol. Sci. 14: 1310–1322 [DOI] [PMC free article] [PubMed] [Google Scholar]
- 19.Söderberg M., Edlund C., Kristensson K., Dallner G. 1991. Fatty acid composition of brain phospholipids in aging and in Alzheimer's disease. Lipids. 26: 421–425 [DOI] [PubMed] [Google Scholar]
- 20.Farooqui A. A., Horrocks L. A. 1998. Plasmalogen-selective phospholipase A2 and its involvement in Alzheimer's disease. Biochem. Soc. Trans. 26: 243–246 [DOI] [PubMed] [Google Scholar]
- 21.Gattaz W. F., Forlenza O. V., Talib L. L., Barbosa N. R., Bottino C. M. 2004. Platelet phospholipase A2 activity in Alzheimer's disease and mild cognitive impairment. J. Neural Transm. 111: 591–601 [DOI] [PubMed] [Google Scholar]
- 22.Ross B. M., Moszczynska A., Erlich J., Kish S. J. 1998. Phospholipid-metabolizing enzymes in Alzheimer's disease: increased lysophospholipid acyltransferase activity and decreased phospholipase A2 activity. J. Neurochem. 70: 786–793 [DOI] [PubMed] [Google Scholar]
- 23.Stephenson D. T., Lemere C. A., Selkoe D. J., Clemens J. A. 1996. Cytosolic phospholipase A2 (cPLA2) immunoreactivity is elevated in Alzheimer's disease brain. Neurobiol. Dis. 3: 51–63 [DOI] [PubMed] [Google Scholar]
- 24.Harrington M. G., Fonteh A. N., Oborina E., Liao P., Cowan R. P., McComb G., Chavez J. N., Rush J., Biringer R. G., Huhmer A. F. 2009. The morphology and biochemistry of nanostructures provide evidence for synthesis and signaling functions in human cerebrospinal fluid. Cerebrospinal Fluid Res. 6: 10. [DOI] [PMC free article] [PubMed] [Google Scholar]
- 25.McKhann G. M., Knopman D. S., Chertkow H., Hyman B. T., Jack C. R., Jr, Kawas C. H., Klunk W. E., Koroshetz W. J., Manly J. J., Mayeux R., et al. 2011. The diagnosis of dementia due to Alzheimer's disease: recommendation from the National Institute on Aging Alzheimer's Association workgroups on diagnostic guidelines for Alzheimer's disease. Alzheimer's Dement. 77: 263–269 [DOI] [PMC free article] [PubMed] [Google Scholar]
- 26.Morris J. C. 1997. Clinical dementia rating: a reliable and valid diagnostic and staging measure for dementia of the Alzheimer type. Int. Psychogeriatr. 9(Suppl. 1): 173–176 [DOI] [PubMed] [Google Scholar]
- 27.Petersen R. C. 2004. Mild cognitive impairment as a diagnostic entity. J. Intern. Med. 256: 183–194 [DOI] [PubMed] [Google Scholar]
- 28.Bligh E. G., Dyer W. J. 1959. A rapid method of total lipid extraction and purification. Can. J. Biochem. Physiol. 37: 911–917 [DOI] [PubMed] [Google Scholar]
- 29.Murphy R. C. 2002. Mass Spectrometry of Phospholipids: Tables of Molecular and Product Ions. Illuminati Press, Denver, CO [Google Scholar]
- 30.Harrison K. A., Davies S. S., Marathe G. K., McIntyre T., Prescott S., Reddy K. M., Falck J. R., Murphy R. C. 2000. Analysis of oxidized glycerophosphocholine lipids using electrospray ionization mass spectrometry and microderivatization techniques. J. Mass Spectrom. 35: 224–236 [DOI] [PubMed] [Google Scholar]
- 31.Marathe G. K., Prescott S. M., Zimmerman G. A., McIntyre T. M. 2001. Oxidized LDL contains inflammatory PAF-like phospholipids. Trends Cardiovasc. Med. 11: 139–142 [DOI] [PubMed] [Google Scholar]
- 32.Huang Z., Laliberte F., Tremblay N. M., Weech P. K., Street I. P. 1994. A continuous fluorescence-based assay for the human high-molecular- weight cytosolic phospholipase A2. Anal. Biochem. 222: 110–115 [DOI] [PubMed] [Google Scholar]
- 33.Huhmer A. F., Biringer R. G., Amato H., Fonteh A. N., Harrington M. G. 2006. Protein analysis in human cerebrospinal fluid: physiological aspects, current progress and future challenges. Dis. Markers. 22: 3–26 [DOI] [PMC free article] [PubMed] [Google Scholar]
- 34.Han X., Gross R. W. 2005. Shotgun lipidomics: electrospray ionization mass spectrometric analysis and quantitation of cellular lipidomes directly from crude extracts of biological samples. Mass Spectrom. Rev. 24: 367–412 [DOI] [PubMed] [Google Scholar]
- 35.Milne S., Ivanova P., Forrester J., Alex B. H. 2006. Lipidomics: an analysis of cellular lipids by ESI-MS. Methods. 39: 92–103 [DOI] [PubMed] [Google Scholar]
- 36.Zhao Y. Y., Xiong Y., Curtis J. M. 2011. Measurement of phospholipids by hydrophilic interaction liquid chromatography coupled to tandem mass spectrometry: the determination of choline containing compounds in foods. J. Chromatogr. A. 1218: 5470–5479 [DOI] [PubMed] [Google Scholar]
- 37.Reis A., Spickett C. M. 2012. Chemistry of phospholipid oxidation. Biochim. Biophys. Acta. 1818: 2374–2387 [DOI] [PubMed] [Google Scholar]
- 38.Wellner N., Diep T. A., Janfelt C., Hansen H. S. 2013. N-acylation of phosphatidylethanolamine and its biological functions in mammals. Biochim. Biophys. Acta. 1831: 652–662 [DOI] [PubMed] [Google Scholar]
- 39.Ueda N., Tsuboi K., Uyama T. 2010. Enzymological studies on the biosynthesis of N-acylethanolamines. Biochim. Biophys. Acta. 1801: 1274–1285 [DOI] [PubMed] [Google Scholar]
- 40.Simon G. M., Cravatt B. F. 2006. Endocannabinoid biosynthesis proceeding through glycerophospho-N-acyl ethanolamine and a role for alpha/beta-hydrolase 4 in this pathway. J. Biol. Chem. 281: 26465–26472 [DOI] [PubMed] [Google Scholar]
- 41.Davidson J. E., Lockhart A., Amos L., Stirnadel-Farrant H. A., Mooser V., Sollberger M., Regeniter A., Monsch A. U., Irizarry M. C. 2012. Plasma lipoprotein-associated phospholipase A2 activity in Alzheimer's disease, amnestic mild cognitive impairment, and cognitively healthy elderly subjects: a cross-sectional study. Alzheimers Res. Ther. 4: 51. [DOI] [PMC free article] [PubMed] [Google Scholar]
- 42.Amtul Z., Uhrig M., Supino R., Beyreuther K. 2010. Phospholipids and a phospholipid-rich diet alter the in vitro amyloid-beta peptide levels and amyloid-beta 42/40 ratios. Neurosci. Lett. 481: 73–77 [DOI] [PubMed] [Google Scholar]
- 43.Grimm M. O., Haupenthal V. J., Rothhaar T. L., Zimmer V. C., Grosgen S., Hundsdorfer B., Lehmann J., Grimm H. S., Hartmann T. 2013. Effect of different phospholipids on alpha-secretase activity in the non-amyloidogenic pathway of Alzheimer's disease. Int. J. Mol. Sci. 14: 5879–5898 [DOI] [PMC free article] [PubMed] [Google Scholar]
- 44.Sundaram J. R., Chan E. S., Poore C. P., Pareek T. K., Cheong W. F., Shui G., Tang N., Low C. M., Wenk M. R., Kesavapany S. 2012. Cdk5/p25-induced cytosolic PLA2-mediated lysophosphatidylcholine production regulates neuroinflammation and triggers neurodegeneration. J. Neurosci. 32: 1020–1034 [DOI] [PMC free article] [PubMed] [Google Scholar]
- 45.Desbène C., Malaplate-Armand C., Youssef I., Garcia P., Stenger C., Sauvee M., Fischer N., Rimet D., Koziel V., Escanye M. C., et al. 2012. Critical role of cPLA2 in Abeta oligomer-induced neurodegeneration and memory deficit. Neurobiol. Aging. 33: 1123.e17–1129.e29 [DOI] [PubMed] [Google Scholar]
- 46.Bazan N. G., Molina M. F., Gordon W. C. 2011. Docosahexaenoic acid signalolipidomics in nutrition: significance in aging, neuroinflammation, macular degeneration, Alzheimer's, and other neurodegenerative diseases. Annu. Rev. Nutr. 31: 321–351 [DOI] [PMC free article] [PubMed] [Google Scholar]
- 47.Cummings J. L. 2001. Treatment of Alzheimer's disease. Clin. Cornerstone. 3: 27–39 [DOI] [PubMed] [Google Scholar]
- 48.Kidd P. M. 2008. Alzheimer's disease, amnestic mild cognitive impairment, and age-associated memory impairment: current understanding and progress toward integrative prevention. Altern. Med. Rev. 13: 85–115 [PubMed] [Google Scholar]
- 49.Lemkul J. A., Bevan D. R. 2011. Lipid composition influences the release of Alzheimer's amyloid beta-peptide from membranes. Protein Sci. 20: 1530–1545 [DOI] [PMC free article] [PubMed] [Google Scholar]
- 50.Yang X., Sheng W., He Y., Cui J., Haidekker M. A., Sun G. Y., Lee J. C. 2010. Secretory phospholipase A2 type III enhances alpha-secretase-dependent amyloid precursor protein processing through alterations in membrane fluidity. J. Lipid Res. 51: 957–966 [DOI] [PMC free article] [PubMed] [Google Scholar]
- 51.Coulon D., Faure L., Salmon M., Wattelet V., Bessoule J. J. 2012. Occurrence, biosynthesis and functions of N-acylphosphatidylethanolamines (NAPE): not just precursors of N-acylethanolamines (NAE). Biochimie. 94: 75–85 [DOI] [PubMed] [Google Scholar]
- 52.Farooqui A. A., Litsky M. L., Farooqui T., Horrocks L. A. 1999. Inhibitors of intracellular phospholipase A2 activity: their neurochemical effects and therapeutical importance for neurological disorders. Brain Res. Bull. 49: 139–153 [DOI] [PubMed] [Google Scholar]
- 53.Farooqui A. A., Ong W. Y., Horrocks L. A. 2004. Neuroprotection abilities of cytosolic phospholipase A2 inhibitors in kainic acid-induced neurodegeneration. Curr. Drug Targets Cardiovasc. Haematol. Disord. 4: 85–96 [DOI] [PubMed] [Google Scholar]
Associated Data
This section collects any data citations, data availability statements, or supplementary materials included in this article.


