Abstract
The phasor global analysis algorithm is common for fluorescence lifetime applications, but has only been recently proposed for spectral analysis. Here the phasor representation and fingerprinting is exploited in its second harmonic to determine the number and spectra of photo-activated states as well as their conversion dynamics. We follow the sequence of photo-activation of proteins over time by rapidly collecting multiple spectral images. The phasor representation of the cumulative images provides easy identification of the spectral signatures of each photo-activatable protein.
Introduction
The phasors approach to fluorescence lifetime imaging microscopy (FLIM) (Digman and others, 2008) is gaining widespread use in the microscopy and spectroscopy community. This powerful technique overcomes the complication of exponential component analysis in FLIM by introducing a fit-free approach. Traditional FLIM analysis uses global fitting procedures which could be difficult to interpret when many exponential components are present. Instead, the phasor approach produces instantaneous, global and quantitative results. In other words phasors provide a simplified representation of the data, leading to a logical easy graphical interpretation of the various fluorescent species without a priori assumptions about their number and spectra.
Applications of the FLIM phasor approach to live cells span from calcium gradient measurement (Celli and others, 2010; Sanchez and others, 2011) to Na-dependent phosphate transporter (Giral and others, 2012; Giral and others, 2011) and Förster resonance energy transfer detection in biosensors (Hinde and others, 2012). The work of Stringari (Stringari and others, 2011; Stringari and others, 2012) further exploits this approach by fingerprinting a large number of optical biomarkers with a unique lifetime phasor locations. The wide range of applications here listed underlines the usefulness of the method.
The potential of phasors method was further expanded by the recent work of Fereidouni (Fereidouni and others, 2012). This work describes the use of phasors for (hyper-) spectral imaging, hence translating the simplified representation of the phasor plot from the lifetime domain to the wavelength representation. The recent availability of hyper-spectral cameras and the implementation of spectral scan in confocal microscopes could increase datasets size n-fold, with n equal to the number of spectral channels available. This larger data necessitates a practical representation method capable of resolving the complexity of multispectral analysis with a simple logical interpretation. Spectral phasors are one appealing solution to this issue.
In this work we apply the spectral phasor approach to follow the dynamics of photo-activatable fluorescent proteins (FPs). This field of application is particularly important because the number and the spectra of the various states that can be obtained by photo activation are not necessarily known. Of course there are several methods based on spectral demixing and principal component analysis that can deal with this situation, but the spectral phasor approach provides a particularly simple, visual and fit-free approach for large datasets while maintaining commercial microscopes compatibility. The recent development of molecular reporters including genetically encoded proteins started with the introduction of the Green Fluorescent Protein (GFP). Because of the efforts of multiple laboratories, identification, development and enhancement of novel proteins covering the entire visible spectra has been achieved. The development of photo-activatable fluorescent proteins (PA-FPs) adds color switching capability to the probes opening the path to super-resolution techniques such as Photo-Activated Localization Microscopy (Betzig and others, 2006).
PA-FPs are particular FPs that can change spectral properties upon irradiation with a specific wavelength. This change in color can be irreversible or reversible (Chudakov and others, 2010). Kaede (Ando and others, 2002) belongs to the class of irreversible PA-FPs. It switches from green to red when illuminated with UV light, shifting the emission maxima from 518nm to 582nm. In the same class is Kikume Green-Red (KikGR) (Tsutsui and others, 2005) converting from green form at 517nm to red at 593nm with UV photo-conversion.
Dronpa (Ando and others, 2004; Habuchi and others, 2005; Habuchi and others, 2006) is a reversible photo-switchable protein that goes from a mature state of green fluorescence (518nm) to a dark state. The emission at 518nm can be evoked using UV light (405nm) and reverted to the ‘dark’ state by continuous excitation with 488nm laser.
Here we present an approach to photo-activatable fluorescent proteins mapping using the spectral phasor approach. To demonstrate our approach we use a large NiT agarose bead uniformly coated with the PA-FP. We then photo-activate different regions of the bead to form an image of regions with different levels of photoconversion. We follow the conversion in time of the various regions. The results are presented as sequence of images. The spectrum in each pixel of the image is analyzed using the spectral phasor method. Using this method we can clearly distinguish the various regions of activation and quantify the activation kinetics. For all proteins investigated we detected only two states. We then mixed PA-FPs and we show that we can quantitatively follow the simultaneous activation of proteins in a mixture. In the case of proteins with multiple intermediate steps, this method could allow the separation of these states and to quantify their relative amount. If in the cell there are regions in which the photoconversion can be altered by the cell environment, we could directly map where these processes occur. These intermediate steps or altered states of conversion would not belong to the linear combinations of PA-FPs green-red states, showing up in the spectral phasor plot as vertexes outside the line connecting two colors.
Material and Methods
Protein expression, purification and sample preparation
Kaede, KikGR and Dronpa plasmids were expressed in Escherichia Coli BL21(DE3) bacterial cultures with pRSET vector. A selected bacterial colony was inoculated overnight at 37°C at 250rpm in Luria Broth with 100μg/ml ampicillin until reaching optical density 0.8. 0.5mM IPTG (Isopropyl beta-D-1-thiogalactopyranoside) was added to induce protein expression. The solution was incubated for 4 hours at 37°C, 250rpm and cells were harvested by centrifugation at 4100rpm 4°C for 15 minutes. Harvested cells were resuspended using a lysis buffer (20mM TRIS, 1% Triton, 1mM PMSF (phenylmethanesulfonylfluoride) and 10μg/ml Leupeptin). Cells were subsequently sonicated for 10 cycles 10 seconds on and 50 seconds off incubated on ice, ultracentrifuged at 20000 rpm and 4°C for 30 minutes and filtered with syringe driven filtering unit (Millex GP filter unit 0.22μm, Merck Millipore Ltd, Darmstadt, Germany). Filtrate was incubated in ice for 1 hour at 100rpm with 1ml Ni-NTA agarose gel (Quiagen, Hilden, Germany) and run through purification columns (Illustra NAP-5 columns Sephadex G-25, GE Healthcare, Buckinghamshire, UK) previously equilibrated with buffer (20mM Tris, 0.5M NaCl). Column was washed with 10ml washing buffer (20mM Tris, 300mM NaCl, 20mM Imidazole, 50mM KH2PO4 Potassium phosphate monobasic) and subsequently eluted (20mM Tris, 300mM NaCl, 300mM Imidazole, 50mM KH2PO4 potassium phosphate monobasic). The elute was washed with 20ml 20mM Tris and concentrated in centrifugal filter (Amicon Ultra-15 centrifugal filters, Merck Millipore Ltd, Darmstadt, Germany).
Samples were prepared by selecting a region of interest of approximately 20×25mm on a coverslip using a Liquid Blocker Super Pap pen (Daido Sangyo, Saitama, Japan). 1μl Ni-NTA agarose beads (Quiagen, Hilden, Germany), previously washed with 20mM Tris buffer was added in the center of the delimited region. 1μl of protein solution was added on top. A 24×30mm cover glass is used to cover the sample and sealing is performed using nail polish. Contact between acetone contained in the sealer and the liquid blocker region was carefully avoided, preserving the protein contained in the center of the slide from chemical alteration and desiccation.
Imaging
Samples were imaged using LSM 710 Meta (Zeiss, Jena, Germany) with standard OEM diode lasers 405nm and 561nm respectively yielding 5.25μW and 111.4μW maximum power at the sample. We used a 488nm Lasos RMC 7812 Z1 (Lasos Lasertechnik Gmbh, Jena, Germany) Arg-ion laser with 6.02μW power at the sample. The laser power was measured on the objective using a standard powermeter. The duty cycle of illumination was determined by a fast photo-diode and included in the calculation of the laser power. The objective used was Plan-Apochromat 63x/1.40 Oil DIC M27 (Zeiss, Jena, Germany). The images were acquired in spectral mode of the Zeiss 710 using 32 channels covering the spectrum from 416.32nm to 727.65nm with 9.73nm bandwidth per channel. All images were acquired using a pixel dwell time of 12.6μs and 256×256 pixel size frames. After focusing on one of the protein-bound agarose bead, three regions of interest (ROIs) were selected on the bead, approximately of the same size. These regions were photoactivated with different laser intensities over time. After each photo activation step, one spectral image was acquired. This method allows for a step-by-step photoconversion monitoring with time resolution that depends on the amount of energy deployed on the ROI. Software used for the photo activation is Zen 2009 selecting “Bleaching” mode in parallel with “Time Series” and “Regions”. Spectra were collected at 1 frame/s.
Spectral Phasors calculation
Spectral phasors were calculated starting from the equations for the phasor transformation published by (Digman and others, 2008) and recently adapted to the spectral phasors by Fereidouni (Fereidouni and others, 2012). The equations of Gi(λ) and Si(λ) for each image i were modified for a discrete case as follows:
| (1) |
| (2) |
where λS and λf are the starting wavelength and the final wavelength of the spectrum, n is the harmonic number, ω = 2πf with the frequency f = (n · spectral channels)−1. The datasets acquired are spectral images of 32 channels over time. A cumulative plot of all the Gi(λ) and Si(λ) coordinates provides an overall visualization of spectral changes in time. Therefore:
| (3) |
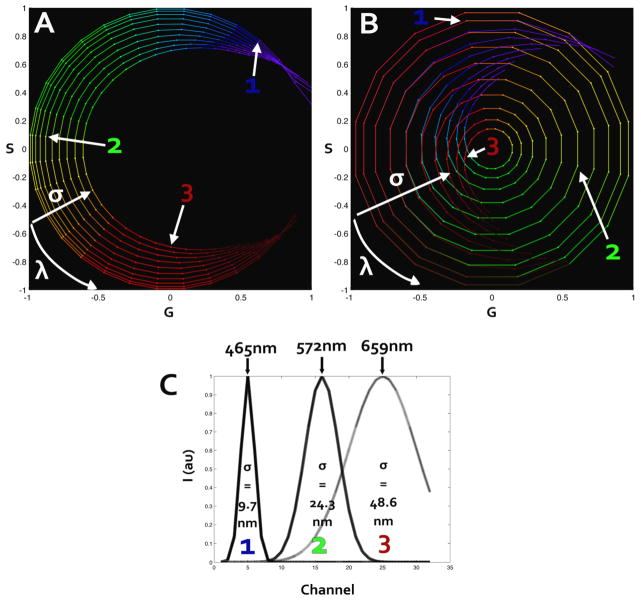
In words, the phasor plot used in this paper is the sum of the (Gi(λ), Si(λ)) histograms of pixel of each spectral image belonging to the time series acquisition. Data analysis was performed using the SimFCS program (www.lfd.uci.edu). As shown in equations 1 and 2, the spectral transformation can be done at a harmonic number n. An example of first and second harmonic spectral phasor is illustrated in Figure 1. We simulated an acquisition with 32 channels covering the spectra from 416nm to 727nm and plotted a color coded graph representative of the wavelength simulated. The same dataset is used to calculate first and second harmonic. In a simple comparison, it can be noted that first harmonic covers an angle of ¾π radians. Second harmonic, instead, circles over 4π radians, overlapping from the orange region (580.9nm) to the deep red (720nm). As a consequence data is more distributed and linearly positioned compared to first harmonic. The overlap does not affect the analysis since spectral phasor properties of linearity and orthogonality are still respected at all harmonics. The utility of the spectral phasor approach is greatly expanded by the use of second harmonic. The wider range and increased linearity facilitate the understanding of the dataset. Furthermore the higher harmonic allows a marked distinction between two peaks in the spectra, matching the typology of data from photo-activatable proteins. This higher sensitivity arise from equations 1 and 2 where the shorter period of sine and cosine amplifies differences in the spectrum.
Figure 1.
First harmonic (A) and second harmonic (B) spectral phasor. The dataset used was simulated using 32 wavelength channels and a Gaussian spectrum changing both in position and width. Color coding is representative of the corresponding wavelength. Panel (C) represents three of the simulated spectra used for calculating (A) and (B). The corresponding points in spectral phasor plot are marked both in first and second harmonic. The change in wavelength peak changes the position counterclockwise on the spectral plot. An increase in the width of the spectrum will shift the point toward the origin of the axes.
Results and Discussion
The application of spectral phasors in this work makes use of three commonly used PA-FPs, Dronpa, Kaede and KikGR. We acquired spectral sequences of photo-activation for each single protein and calculated the resulting cumulative spectral phasor.
DRONPA
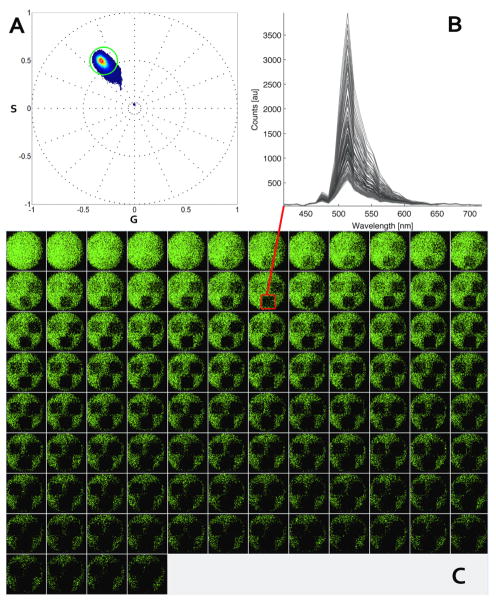
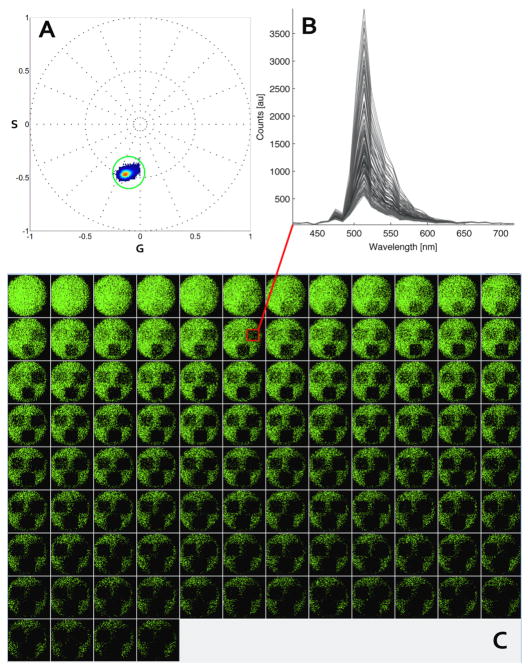
We added Dronpa at a concentration of 30.3mg/mL to the Ni-NTA beads until saturation of the binding sites. Imaging of Dronpa started from the fluorescent state sequentially inactivating the protein in three ROIs with different 488nm laser powers. The spectral phasor of 60 images for first and second harmonic is shown in Figure 2. First harmonic analysis provides a neat separation of Dronpa in active state (green), intermediate (blue, seen only in the spectrum plot) and inactive state which is the dot at the center of the phasor plot and in red in the spectrum panel. Dronpa “dark” state is located in the central position of the plot as expected from equations (1) and (2). The dark spectrum has no particular phase and it is not modulated (very broad). We cannot distinguish the “dark” state of the protein from the background. A circle-shaped cursor is used to select areas of interest on the spectral phasor plot. The points selected are colored with the same color of the cursor in the image. The color of the cursor (green) is used to paint all pixels in the image that have their phasor positions selected by the cursor. Second harmonic analysis provides visually complete information of the photo-activation pattern. The major phasor cluster selected by the green cursor highlights the green state of the PA-FP (green). The pixels undergoing photo activation move to dark state values becoming undistinguishable from the background. When some proteins reach the dark state, phasors are shifted toward the center of the phasor plot depending on the fraction of dark and fluorescent proteins in a pixel. We show the complete set of intensity images for Dronpa to underline the progression and completeness of photo-conversion. The spectral graphs in Figure 2 and Figure 3 show the evolution of the signal over time in one of the regions of interest beginning from the green cursor selected points (in green) to progressively darker values (blue and red spectra). The decrease of the intensity and broadening of the full width at half maximum of the spectra correspond to points in the spectral phasor plot increasingly closer to the origin. These points correspond to the dark background and are not represented.
Figure 2.
Dronpa converts from fluorescent (511nm) to dark upon photo-activation. First harmonic spectral phasor analysis (A). Three ROIs are selected on the bead on areas of 68×70 pixels. Laser power at 488nm is set respectively at 1.42 μW (left ROI), 2.66 μW (right ROI) and 4.38 μW (bottom ROI) for the ROIs. Zoom is set at 2.2 with a frame size of 61.10μm. 100 frames are acquired using 488nm wavelength at 1 second per frame. The points selected by the cursor in the phasor plot A are colored with the cursor color (C). One ROI with 4.38μW 488nm laser photo-activation is selected for the entire sequence to produce the spectral graph (B) where time series is represented in grayscale.
Figure 3.
Dronpa converts from fluorescent to dark upon illumination. Second harmonic spectral phasor analysis (A). The same dataset used in figure 1 is analyzed using second spectral harmonic. The points selected by the cursor in the phasor plot A are colored with the cursor color on a grayscale image sequence (C). The ROI with 2.66 μW 488nm laser photo-activation is selected on all frames for producing the spectral graph (B).
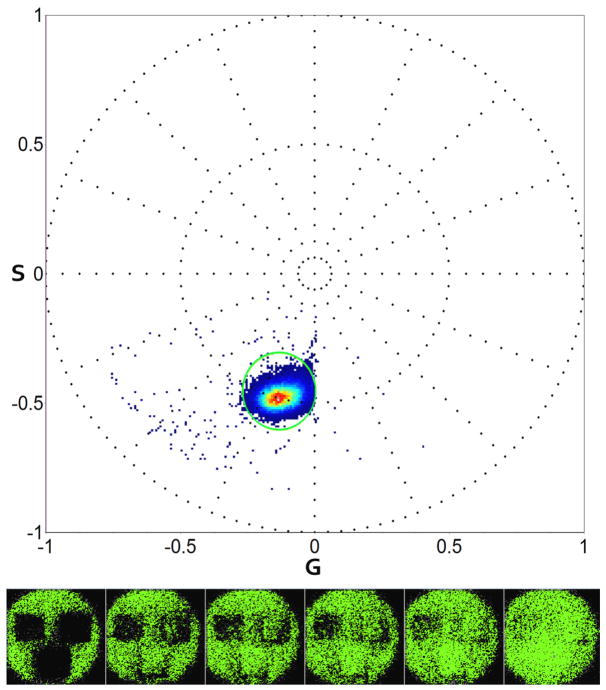
The same sample of Figure 2 is also used for imaging the kindling property of Dronpa. The same three ROIs are illuminated with the 405nm laser and imaged at 488nm to observe the conversion from “dark” state to fluorescent state. As expected from equation (1) and (2) the spectral phasor plot is analogous to inactivation shown in figure 2. This demonstrates the capability of spectral phasors to fingerprint the activation state of photochromic proteins.
Kaede
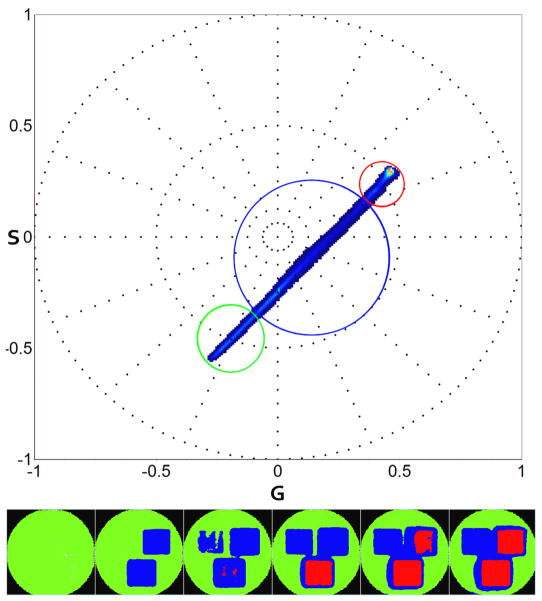
Kaede at 29.09mg/mL concentration is imaged using 488nm and 561nm laser for exciting the green and red state respectively. Conversion is performed on three ROIs using 405nm laser at 3 different intensities. The second harmonic analysis of 100 spectral images time series is shown in Figure 5. Green and red states are identified at the extremes of the plot and marked using the matching color cursor. The linear combination pixels are marked in blue.
Figure 5.
Kaede green to red photo-activation second harmonic spectral phasor analysis (top). Three ROIs are selected on the bead (53×48 pixels). Laser power at 405nm is set respectively at 0.04μW (left ROI), 1.33 μW (right ROI) and 2.69 μW (bottom ROI) for the ROIs. Zoom is set at 3.1 with a frame size of 43.06umx43.06um. 100 frames are acquired using 488nm and 561nm wavelength. Green cursor on spectral phasor plot (top) is used to select the green state, red cursor for red state. Blue selection outlines the linear combination between green and red in the same pixel. In the image, pixels are colored according to the cursor color. We show 6 out of 100 frames acquired.
KikGR
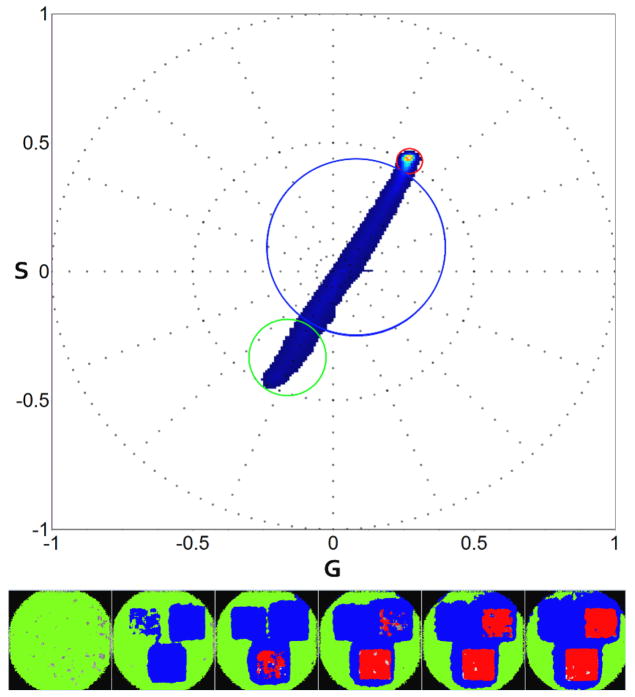
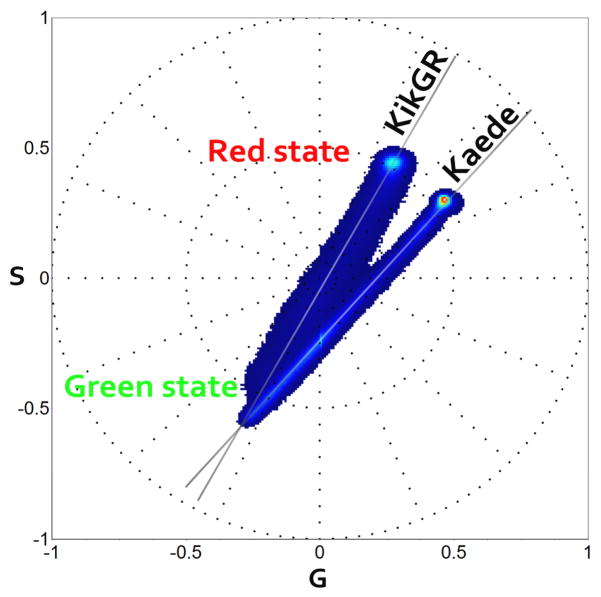
Following the same protocol, we imaged Kikume Green-Red at a concentration of 2.11mg/mL. Photo-activation is mapped during 50 frames. Similarly to Kaede, the second harmonic phasor plot of KikGR (figure 6) shows points distributed along the linear combination of green and red states. The red state of KikGR peaks at 593nm whereas for Kaede is at 582nm. Given the resolution attainable with the spectral phasor approach, which is few nanometers, we could not expect to distinguish KikGR phasor location from Kaede. Figure 7 shows the two PA-FPs phasor distributions on the same plot. The two green states are too close one to the other as reported in the literature, with values of green state for Kaede, 518nm (Ando and others, 2002) and for KikGR, 517nm (Tsutsui and others, 2005). Instead, the red state is well separated on the second harmonic phasor plot (Figure 7). KikGR photo-active state is located at higher wavelength compared to Kaede, reflecting the values reported in the literature of 593nm for KikGR (Tsutsui and others, 2005) and 582nm for Kaede (Ando and others, 2002).
Figure 6.
KikGR green to red photo-activation second harmonic spectral phasor analysis (top). Three ROIs are selected on the bead yielding 65×68 pixels. Laser power at 405nm is set respectively at 0.04 μW (left ROI), 1.33 μW (right ROI) and 2.69 μW (bottom ROI) for the ROIs. Zoom is set at 2.0 with a frame size of 66.10um ×66.10um. 50 frames are acquired using 488nm and 561nm wavelength. Green cursor on spectral phasor plot (top) is used to select the green state, red cursor for red state. Blue selection outlines the linear combination between green and red. Corresponding frame pixels are colored according to the cursor color (bottom). For clarity we show 6 out of 50 frames acquired.
Figure 7.
Second harmonic spectral phasor plot overlapping Kaede and KikGR distributions. The datasets used in figure 5 and 6 are here represented on the same phasor for comparison. The green state of both proteins originates from a similar emission wavelength as reported in the literature (Kaede/KikGR 518nm/517nm). The red state instead has different emission wavelengths for the two proteins.
Mixture of PA-FPs
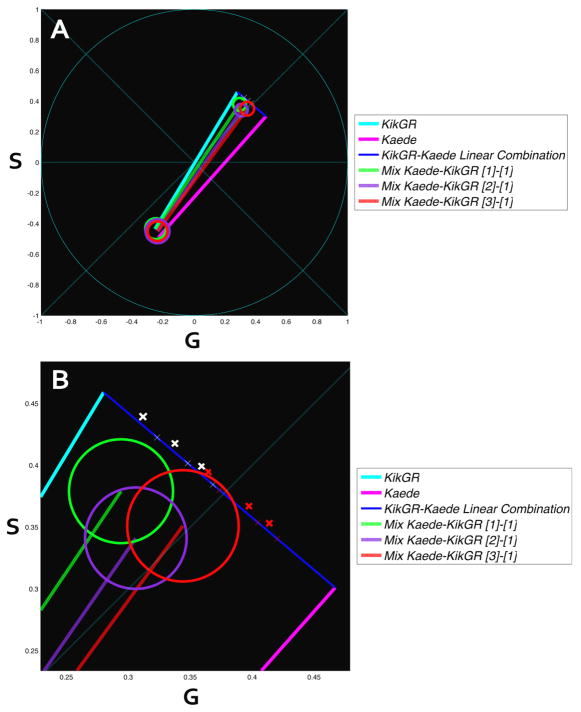
Next we exploit diversity of two PA-FPs spectral phasor distributions to resolve a mixture of photo activatable proteins and to determine the relative molecular brightness of the different species. We diluted the protein solution 5 times and prepared three samples by mixing Kaede-KikGR first and adding the Ni-NTA agarose beads afterward. The three samples yielded a concentration ratio of Kaede-KikGR of respectively 3:1, 2:1 and 1:1. The resulting spectral phasor plots are shown in figure 8.
Figure 8.
Second harmonic representation of three mixed samples Kaede-KikGR with concentration ratio 1:1 (green), 2:1 (purple) and 3:1 (red). Three sets of images were acquired using 488nm and 561nm laser lines. Each set has had selection of 3 ROIs yielding approximately 63×61 pixels. 50 images per sample were used for analysis. Cursors were placed selecting at least 90% of the pixels belonging to the specific state. KikGR (light blue) and Kaede (violet) are represented (A). in B We show a magnification of the A plot. Linear combination of red Kaede (violet) and KikGR (light blue) of mixtures with relative brightness of 1 (red crosses) are shown in the line connecting the phasor of Kaede and KikGR. The measured intersections are shown in the white crosses on the same lines.
The three ratios overlap in the green state and separate in the red state. For reference we superimposed the spectral position of Kaede and KikGR. The mixed sample with 3:1 concentration is shifted toward the position of Kaede while the 1:1 is closer to KikGR position. However, the mixed samples are not simply the linear combination of the red spectrum of the Kaede and KikGR. According to the linear combination rule for phasors, the only explanation of this effect is that there is an interaction between the two proteins or a third component that contributes to the mixture. One obvious candidate for this third component is a green component due to a non complete conversion from green to red. Using the linear combination law of phasors we can determine the amount of unconverted protein.
The equations describing the system (linear combination of 3 phasors) are given below (equation 4). In these equations we use the vector law of addition separately on the g and s coordinates of the mixtures. There are 9 unknowns, the fraction of the two proteins in the 3 mixtures and the fraction of unconverted protein which we assume is the same for all samples. The values found for the unknown are given in Table 1. The cumulative percentage of unconverted protein, mixed Kaede and KikGR, results 4%, 7%, 5% for respectively 1:1, 2:1 and 3:1 ratios.
Table 1.
Kaede-KikGR mixed sample fractional values from equation system (4). The relative brightness (RB) of the two proteins for each mixture is reported. The excitation wavelength is 561nm. Emission is collected with the Zeiss 32 channel detector.
| Fraction | Kaede | KikGR | Unconverted | Relative brightness |
|---|---|---|---|---|
| f1 | 0.210 | 0.740 | 0.050 | 3.51 |
| f2 | 0.330 | 0.600 | 0.070 | 3.63 |
| f3 | 0.449 | 0.511 | 0.040 | 3.41 |
| (4) |
The same linear combination rule excludes, in this case, the presence of an intermediate state. To demonstrate this we simulate two sets of data where an intermediate state appears. The resulting second harmonic spectral phasor plots are reported in figure 9. The first simulation (figure 9.A) shows a first state at 503nm, an intermediate state at 533nm and an activated state at 591nm. Second simulation shows an intermediate state close to the activated state, starting at 523nm, intermediate state at 571nm and final state at 581nm. The hypothesis in these simulations is a complete conversion and an obligatory intermediate state before reaching the final activation. The resulting plot differs from the one obtained experimentally in figure 8, excluding the presence of intermediate states in our sample.
Figure 9.
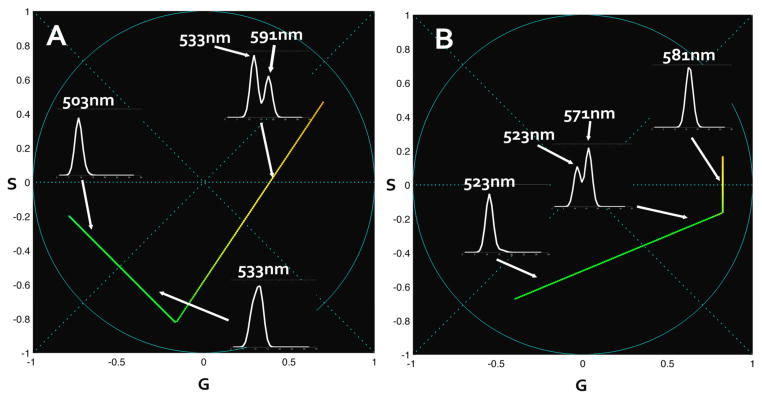
Second harmonic spectral phasor of intermediate-state simulated data. In these simulations we consider 100% conversion and an obligatory conversion to intermediate state before reaching the final wavelength. Two sets are represented. First set (A) shows a first state at 503nm, intermediate at 533nm and activated at 591nm. Second set (B) shows an initial state at 523nm, intermediate state at 571nm and final state at 581nm. Spectra plot are reported on the image with an arrow indicating the corresponding position on the spectral phasor plot. Colorscale in use associates the real color to the wavelength.
The linear combination rule of phasors provides also information on the brightness ratio between the red states of the two proteins. To use the set of linear equations, we measured the coordinates of the center of the distribution corresponding to Kaede and KikGR species from figures 5, 6 and for the mixtures in figure 8. Solving the systems of linear equations provides the 9 unknown values reported in table 1.
Note that in the equations above the fractions are fractional intensities, i.e., how much each species contribute to the spectral intensity. We are interested in comparing these values with the molar fractions of our preparations, so that we can obtain the relative molecular brightness of the various species. To solve this problem we need to know the molar fraction of the two proteins. We re-measure the diluted concentrations with Bradford assay method obtaining 1.27mg/mL, 0.85mg/mL, 0.42mg/mL for Kaede. KikGR concentration was constant in the samples at 0.42mg/mL. Applying the above values to the three ratio samples shows that KikGR has a higher brightness than Kaede. We calculate the relative molecular brightness as:
| (5) |
where C is the concentration and fractions fnKaede and fnKikGR are obtained by solving system (4).
The resulting average brightness ratio for the red state of KikGR-Kaede mixture is 3.52. The value itself is different from the literature (Tsutsui and others, 2005). However in our case two points need to be noted.
First, the excitation wavelength used for red channel is 561nm for both proteins. This wavelength differs from the excitation peak of Kaede (572nm) (Ando and others, 2002) and KikGR (583nm) (Tsutsui and others, 2005) and provides respectively 65.4% and 43.1% excitation efficiency.
Second, the Zeiss multispectral detector has not been corrected for different wavelength efficiencies.
These factors have a role in the measured brightness ratio and could explain the difference from literature.
Conclusion
In this work we present an application of the spectral phasor approach to photo-activatable proteins using second harmonic. The proteins chosen for this application are Dronpa, Kaede and Kikume Green-Red representing a range of reversible photo-switchable and irreversible photo-activatable proteins. Our results demonstrate the possibility to distinguish PA-FPs during their photo-conversion by their distribution in the phasor plot. We can easily determine in the phasor plot the initial and final state of the protein. Intermediate points are linear combination of these states and therefore located on the line connecting base- to photo-activated-state.
We show the spectral phasor plot of mixed Kaede-KikGR samples with known concentration ratio. We can expect, in general, that if at least one of the states of the proteins is separated from the other by few nanometers, the second harmonic analysis will distinguish different concentration ratios of these samples. Using simple linear algebra we can calculate the relative brightness ratio of the two proteins under these specific acquisition conditions.
The spectral phasor approach is ideal for imaging applications. The spectral phasor analysis proves to be a robust method for analysis of large datasets. The images sets here acquired reach 100 units with 32 channels, hence 3200 spectral frames carrying information. Calculating the spectral phasor is relatively fast and the result displayed in the phasor plot convey graphical information about the number of states (including intermediate states). Analysis is simplified and interpretation requires no particular expertise. A main advantage of this method resides in the global analysis: one single phasor plot could represent a large number of spectral images.
Figure 4.
Dronpa dark-to-fluorescent photo-activation (top). After converting Dronpa to the “dark” state in figure 2 and 3 the same sample is used for measuring reversible photo-conversion. A 405nm laser is used for converting the same three ROIs previously activated. The laser powers are respectively 0.02μW, 0.04uW and 0.35uW. 60 frames were acquired. For simplicity only 6 frames are shown (bottom) with the respective color selection indicated in the spectral phasor plot.
Acknowledgments
The authors would like to acknowledge Atsushi Miyawaki from Laboratory for Cell Function Dynamics Brain Science Institute, RIKEN for providing the plasmids of Dronpa, Kikume Green-Red and Kaede. Andrea Anzalone and Milka Stakic from Laboratory for Fluorescence Dynamics, University of California Irvine for helping optimizing the protein purification protocol. This work was supported by grant numbers: NIH-P41-RRO3155, P41-GM103540 and P50-GM076516.
References
- Ando R, Hama H, Yamamoto-Hino M, Mizuno H, Miyawaki A. An optical marker based on the UV-induced green-to-red photoconversion of a fluorescent protein. Proceedings of the National Academy of Sciences of the United States of America. 2002;99(20):12651–12656. doi: 10.1073/pnas.202320599. [DOI] [PMC free article] [PubMed] [Google Scholar]
- Ando R, Mizuno H, Miyawaki A. Regulated fast nucleocytoplasmic shuttling observed by reversible protein highlighting. Science. 2004;306(5700):1370–3. doi: 10.1126/science.1102506. [DOI] [PubMed] [Google Scholar]
- Betzig E, Patterson GH, Sougrat R, Lindwasser OW, Olenych S, Bonifacino JS, Davidson MW, Lippincott-Schwartz J, Hess HF. Imaging intracellular fluorescent proteins at nanometer resolution. Science. 2006;313(5793):1642–5. doi: 10.1126/science.1127344. [DOI] [PubMed] [Google Scholar]
- Celli A, Sanchez S, Behne M, Hazlett T, Gratton E, Mauro T. The epidermal Ca(2+) gradient: Measurement using the phasor representation of fluorescent lifetime imaging. Biophys J. 2010;98(5):911–21. doi: 10.1016/j.bpj.2009.10.055. [DOI] [PMC free article] [PubMed] [Google Scholar]
- Chudakov DM, Matz MV, Lukyanov S, Lukyanov KA. Fluorescent proteins and their applications in imaging living cells and tissues. Physiol Rev. 2010;90(3):1103–63. doi: 10.1152/physrev.00038.2009. [DOI] [PubMed] [Google Scholar]
- Digman MA, Caiolfa VR, Zamai M, Gratton E. The phasor approach to fluorescence lifetime imaging analysis. Biophys J. 2008;94(2):L14–6. doi: 10.1529/biophysj.107.120154. [DOI] [PMC free article] [PubMed] [Google Scholar]
- Fereidouni F, Bader AN, Gerritsen HC. Spectral phasor analysis allows rapid and reliable unmixing of fluorescence microscopy spectral images. Optics express. 2012;20(12):12729–12741. doi: 10.1364/OE.20.012729. [DOI] [PubMed] [Google Scholar]
- Giral H, Cranston D, Lanzano L, Caldas Y, Sutherland E, Rachelson J, Dobrinskikh E, Weinman EJ, Doctor RB, Gratton E, Levi M. NHE3 Regulatory Factor 1 (NHERF1) Modulates Intestinal Sodium-dependent Phosphate Transporter (NaPi-2b) Expression in Apical Microvilli. J Biol Chem. 2012;287(42):35047–56. doi: 10.1074/jbc.M112.392415. [DOI] [PMC free article] [PubMed] [Google Scholar]
- Giral H, Lanzano L, Caldas Y, Blaine J, Verlander JW, Lei T, Gratton E, Levi M. Role of PDZK1 protein in apical membrane expression of renal sodium-coupled phosphate transporters. J Biol Chem. 2011;286(17):15032–42. doi: 10.1074/jbc.M110.199752. [DOI] [PMC free article] [PubMed] [Google Scholar]
- Habuchi S, Ando R, Dedecker P, Verheijen W, Mizuno H, Miyawaki A, Hofkens J. Reversible single-molecule photoswitching in the GFP-like fluorescent protein Dronpa. Proc Natl Acad Sci U S A. 2005;102(27):9511–6. doi: 10.1073/pnas.0500489102. [DOI] [PMC free article] [PubMed] [Google Scholar]
- Habuchi S, Dedecker P, Hotta J, Flors C, Ando R, Mizuno H, Miyawaki A, Hofkens J. Photo-induced protonation/deprotonation in the GFP-like fluorescent protein Dronpa: mechanism responsible for the reversible photoswitching. Photochem Photobiol Sci. 2006;5(6):567–76. doi: 10.1039/b516339k. [DOI] [PubMed] [Google Scholar]
- Hinde E, Digman MA, Welch C, Hahn KM, Gratton E. Biosensor Forster resonance energy transfer detection by the phasor approach to fluorescence lifetime imaging microscopy. Microsc Res Tech. 2012;75(3):271–81. doi: 10.1002/jemt.21054. [DOI] [PMC free article] [PubMed] [Google Scholar]
- Sanchez S, Bakas L, Gratton E, Herlax V. Alpha hemolysin induces an increase of erythrocytes calcium: a FLIM 2-photon phasor analysis approach. PloS one. 2011;6(6):e21127. doi: 10.1371/journal.pone.0021127. [DOI] [PMC free article] [PubMed] [Google Scholar]
- Stringari C, Cinquin A, Cinquin O, Digman MA, Donovan PJ, Gratton E. Phasor approach to fluorescence lifetime microscopy distinguishes different metabolic states of germ cells in a live tissue. Proc Natl Acad Sci U S A. 2011;108(33):13582–7. doi: 10.1073/pnas.1108161108. [DOI] [PMC free article] [PubMed] [Google Scholar]
- Stringari C, Sierra R, Donovan PJ, Gratton E. Label-free separation of human embryonic stem cells and their differentiating progenies by phasor fluorescence lifetime microscopy. J Biomed Opt. 2012;17(4):046012. doi: 10.1117/1.JBO.17.4.046012. [DOI] [PMC free article] [PubMed] [Google Scholar]
- Tsutsui H, Karasawa S, Shimizu H, Nukina N, Miyawaki A. Semi-rational engineering of a coral fluorescent protein into an efficient highlighter. EMBO reports. 2005;6(3):233–238. doi: 10.1038/sj.embor.7400361. [DOI] [PMC free article] [PubMed] [Google Scholar]


