Abstract
Current single-molecule techniques do not permit the real-time observation of multiple proteins interacting closely with each other. We here report an approach enabling us to determine the single-molecule FRET kinetics of multiple protein-heterodimer interactions occurring far below the diffraction limit. We observed a strongly cooperative formation of multimeric SNARE complexes, which suggests that formation of the first SNARE complex triggers a cascade of SNARE complex formation.
The current single-molecule FRET (fluorescence resonance energy transfer) technique provides a unique opportunity to dissect the behavioral dynamics of individual molecules1. This technique, however, has only been able to track single molecules under molecularly sparse conditions. The current paradigm is to separate each molecule farther than the diffraction limit, which in turn permits reading of the fluorescence signal of each molecule with minimal overlap in measurements1. However, to bring about high cooperativity necessary for their function, for example, membrane proteins do interact with each other via close molecular contacts on a two-dimensional membrane2,3. Under such high local concentrations, the signals from individual proteins will severely overlap with each other due to the diffraction limit, precluding the observation of isolated single molecules. Counting with fluorophore photobleaching can determine the number and conformation of molecules of interest, but this method does not allow real-time measurement that reveals kinetic pictures4. Thus, there is an obvious need for a technique, which permits the single-molecule observation of multiple proteins, crowded on a spatial scale smaller than the optical diffraction limit. This would unveil the kinetic details of multimeric protein-protein interactions, which are inaccessible with current biochemistry and biophysics tools.
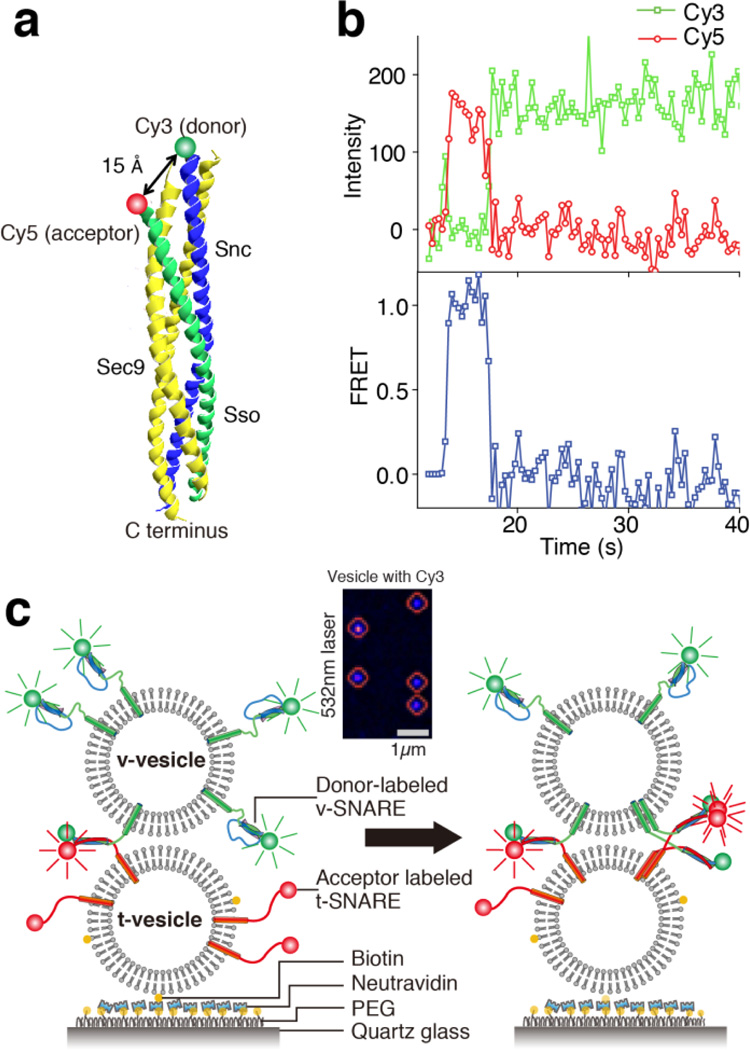
We chose to study yeast SNARE (soluble N-ethylmaleimide-sensitive factor attachment protein receptor) proteins, which are involved in membrane trafficking from the Golgi to the plasma membrane5,6. We first labeled the yeast v- and t-SNARE proteins (Snc2p and Sso1pHT) with a FRET pair consisting of Cy3 and Cy5 dyes, respectively (Fig. 1a). Upon SNARE complex formation, these two dyes are brought into a close proximity of ~15 Å according to the crystal structure7, which yields a high FRET efficiency (Fig. 1b). We have confirmed that the labeling does not affect the functionality of SNAREs (Supplementary Figs. 1 and 2). We used a single vesicle-vesicle fusion assay that provides the SNARE proteins with a molecular environment for Supplementary Text), in which effective lipid mixing8 (Supplementary Fig. 1 and 2) as well as content mixing9,10 were observed in a strictly SNARE-dependent manner. By adjusting the concentrations of both surface t-vesicles (Supplementary Fig. 4) and diffusing v-vesicles, we were able to ensure one-to-one interaction between single vesicles of ~30 nm radius, and also separate the fluorescence signals from neighboring vesicle-vesicle complexes by more than the diffraction limit (Fig. 1c, inset). The fluorescence signals from a single vesicle-vesicle complex, however, contained information on interactions between multiple copies of t- and v-SNAREs.
Figure 1.
Tracking of multiple molecules with single-molecule FRET. (a) Labeling positions of the FRET donor and acceptor dyes with reference to the crystal structure of the yeast SNARE complex. (b) real-time trace of single protein complex shows typical single molecule FRET trace. Fluorescence signals of Cy3 (donor) and Cy5 (acceptor) are colored as green and red, respectively. (c) Schematic representation of the single-vesicle FRET assay.
With multiple donor-labeled proteins working in a single vesicle-vesicle complex, the quantitative dissection of a real-time trace reporting multiple protein-protein FRET was not as straightforward as that reporting the single protein-protein FRET (Fig. 1b versus Fig. 2). To address this problem, we considered the photophysical processes among the multiple FRET donor and acceptor dyes. We assume that there are total ND donor-labeled v-SNAREs that are interacting with NA acceptor-labeled t-SNAREs. When nD SNARE complexes are formed as a result of the specific protein-protein interaction (while ND - nD donors are still in the free state), the total FRET efficiency (Etot) can be expressed as (see Methods)
| (1) |
Figure 2.
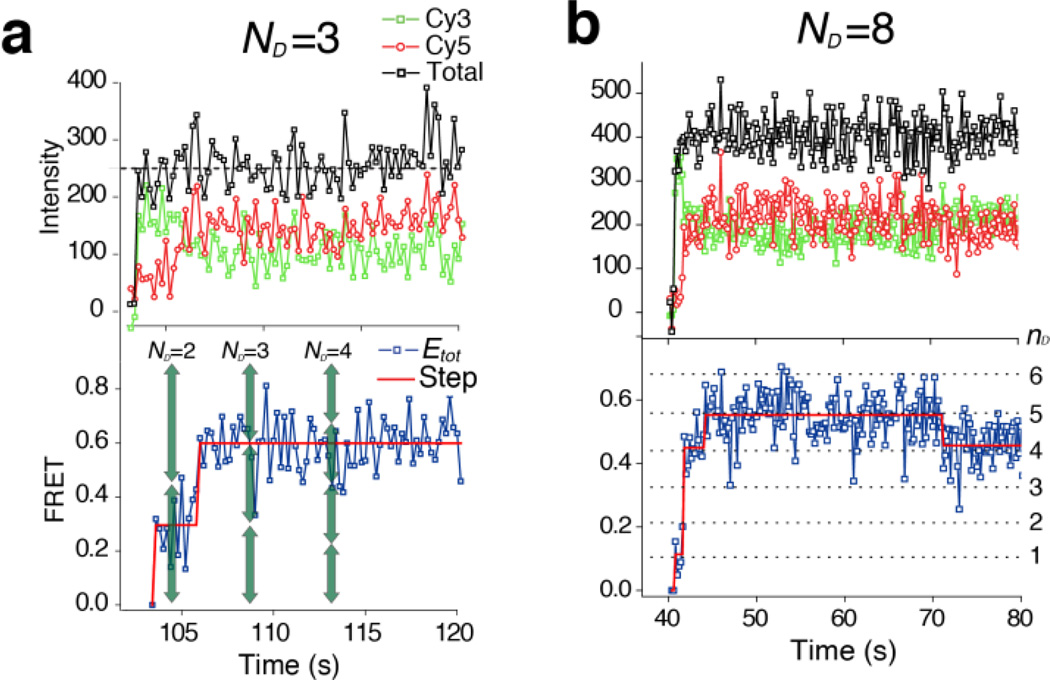
Real-time traces of single vesicle complex having many protein complexes. Cy3 labeled protein number (ND) is estimated considering both the total fluorescence intensity (upper panel, black traces) and the step-fitted, experimental FRET states (bottom panel, red lines). For example, the estimated ND=3 and the corresponding theoretical FRET states (a, green arrows) make a better match with the experimental FRET states than the cases with ND=2 and 4
γ is the gamma correction factor taking into account different quantum yield and CCD detection efficiency of Cy3 and Cy511. IDA and IAD are the single donor and acceptor intensities in the specific protein-protein complex (i.e., SNARE complex). For an ideal case of γ = 1, Equation (1) can be fur-ther simplified to:
| (2) |
Because H is the FRET efficiency of the single protein-protein complex, Equation (2) suggests that the total dynamic FRET range (from zero to H) can be divided into ND regions with an equal height of approximately H/ND.
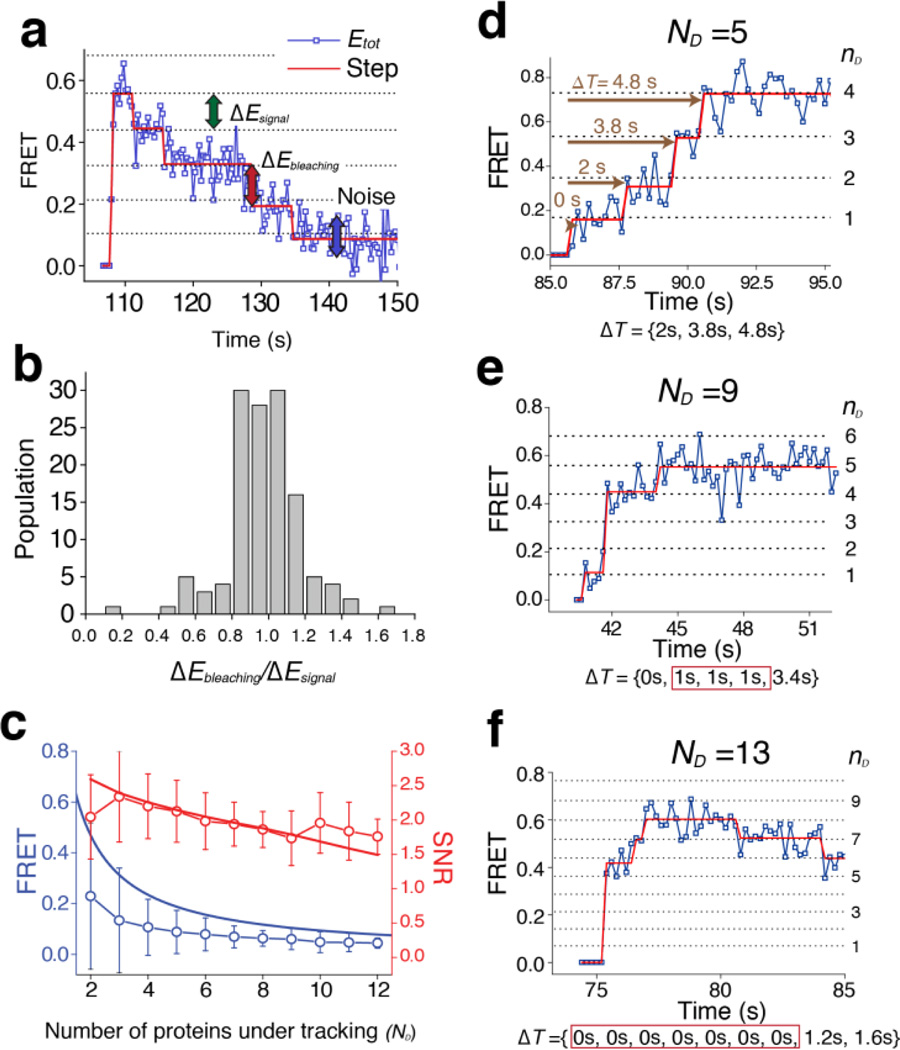
In the light of above discussion, we expect that the FRET value of a vesicle-vesicle complex becomes quantized as the set of theoretical FRET states defined by Equation (1) with different ND and nD values. This means that successive SNARE complex formation events between two single vesicles will be visualized as a transition to higher FRET states corresponding to higher nD values (ND is fixed). Indeed, clear stepwise increases were identified when the real-time traces were analyzed by the step-fitting algorithm based on the Schwarz information criterion theory12 (Fig. 2). We now compared the identified FRET steps with the theoretical FRET states given by Equation (1). The high FRET efficiency (H) and gamma correction factor (γ) were measured to be 0.96±0.037 and 0.89±0.075, respectively, from the experiment with ND=1 using higher laser power to minimize the error (Fig. 1b and Supplementary Fig. 5). We determined the total number of proteins under tracking (ND) for each single vesicle-vesicle complex based on its total fluorescence intensity and also the identified FRET states. The fluorescence intensity of single Cy3 dye is experimentally determined for each set of experiment and used as reference for later analysis (Fig. 2, Supplementary Fig. 6 and Supplementary method). We were able to double-check the validity of our estimation by observing photobleaching-induced FRET changes (Fig. 3a) because with the correct determination of ND, the photo-bleaching events of single acceptor dyes would appear as exactly one step down in the FRET domain. We compared the FRET decrease due to each photobleaching event (ΔEbleaching, Fig. 3a, red arrow) with the principal step size (ΔEsignal ≈ H/ND, Fig. 3a, green arrow,). The ratio of these two FRET step sizes (ΔEbleaching/ΔEsignal) showed a narrow distribution centered at 1 (Fig. 3b), which corroborates our theoretical analysis.
Figure 3.
Single vesicle FRET trace analysis. (a) Photobleaching-induced FRET changes. Each photobleaching event appears as the FRET trace taking exactly one step down. (b) Ratio of the FRET-value changes upon photobleaching (ΔEbleaching) to the principal step size (ΔEsignal)(n=199). The mean and standard deviation of the distribution are 0.971 and 0.205, respectively. (c) Signal-to-noise ratio (SNR) of our method (n= 297). The signal (blue curve) is defined as the principal step size, which is the FRET contribution of an individual molecule (for example, green arrow in a). Noise (blue circles) is defined as the deviation of the original signal from the theoretical FRET states (blue arrow in a). Red circles represent the SNR values determined from our experiments, as a function of the number of proteins under tracking (ND). The red line represents theoretical fitting considering the Poisson distribution and dark current noise (Methods)(d–f) The time gap between vesicle docking and each SNARE complex formation events (ΔT, brown) are measured from step-fitted data.
Next, we investigated how many proteins could be observed at the same time, by quantifying the signal to noise ratio (SNR) of our measurement. The signal was defined as the principal step size, ΔEsignal ≈ H/ND, which was the FRET region allotted for one SNARE protein (Fig. 3a, green arrow). The noise was the mean standard deviation of the raw data from corrected FRET states (Fig. 3a, blue arrow, blue dot versus black dotted line). With these definitions, the signal decreased as approximately 1/ND (Fig. 3c blue curve), but the noise also decreased with increasing ND (Fig. 3c, blue circle symbols), which could compensate for the signal decrease and maintain the SNR level. Indeed, when the SNR values of 297 single-vesicle complexes were plotted as a function of ND, the SNR was maintained near 2 even when we observed ten proteins at the same time (Fig. 3c, red circles and curves; see Methods for how we fit the SNR values on the basis of photon number fluctuation13). This SNR analysis quantitatively demonstrates that our multiple protein-protein FRET technique can observe ten proteins or even more at the same time.
Transitions of the step-fitted FRET states through the theoretically defined FRET states revealed the kinetics of multi-meric SNARE complex formation with single-molecule resolution (Fig. 3d–f). Of note, we observed that many SNARE complex formation events occurred simultaneously within our time resolution (200 ms) (Fig. 3e–f and Supplementary Fig. 6).
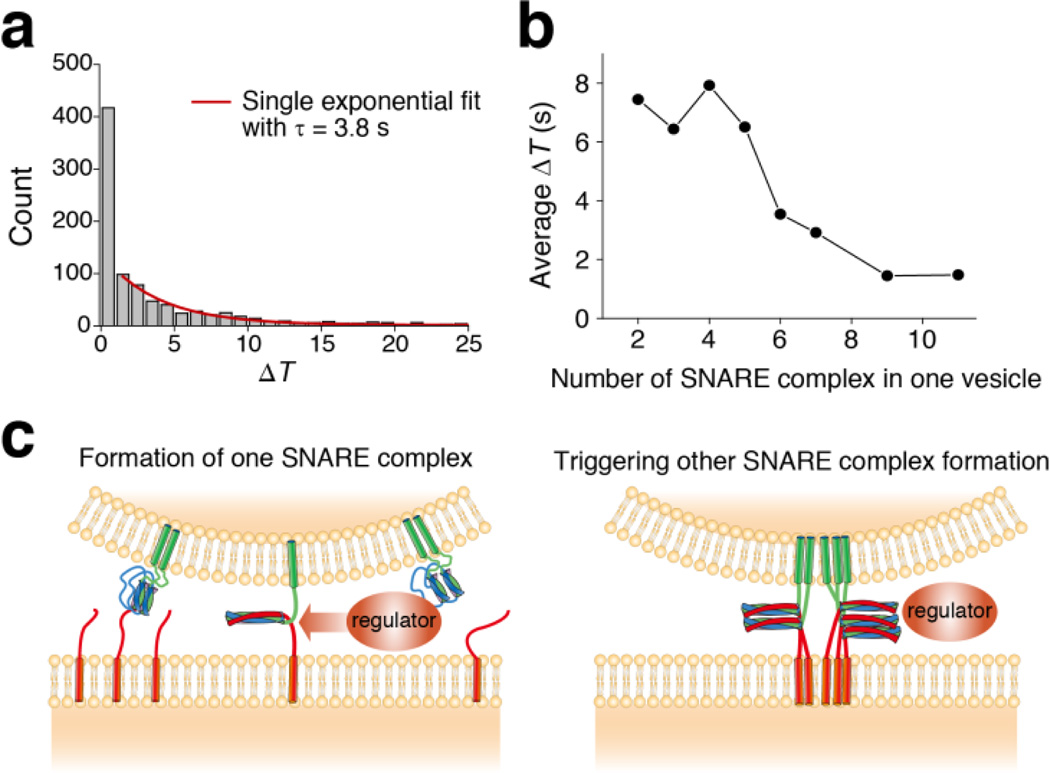
Simple combination of Markov processes could not describe this simultaneous, multiple SNARE complex formation. To show this, we measured the dwell time ΔT, the time interval between the moment of vesicle-vesicle docking and each SNARE complex formation event (Fig. 3d–f). The distribution of these dwell times could not be fitted using a single exponential function (Fig. 4a). Specifically, while all other bins (ΔT > 1 s) could be well fitted using a single exponential function with the time constant of multimeric 3.8 s, the first bin of the distribution containing the multimeric SNARE complex formation events produced a distinct high population.
Figure 4.
Kinetic analysis on protein complex formation. (a) The time gap distribution between vesicle docking and each SNARE complex formation event. Population other than first bin can be fitted with single exponential fit (red line). (b) The average time gap between vesicle docking and each SNARE complex formation (ΔT) is plotted against the number of SNARE complex in one vesicle. Faster SNARE complex formation in vesicle with many SNARE complexes suggests existence of non-Markovian process in SNARE complex formation. (c) Molecular model for cooperative SNARE complex formation. Formation of a SNARE complex accelerates the formation of other SNARE complexes.
We next questioned if this first bin simply represents an-other random SNARE complex formation with a faster kinetic rate or indicates indeed cooperativity in SNARE complex formation. To answer this, we calculated the average values of ΔT for individual real-time traces and plotted them against the number of SNARE complexes formed in vesicle complexes, that is, the maximum nd obtained in each trace.
We have reasoned that if there is no cooperativity in SNARE complex formation, the average ΔT should remain at a constant value. Without the cooperativity, all the SNARE-complex formation events occur independently from each other, and the kinetics must be independent of the number of SNARE complexes formed in a specific vesicle-vesicle complex. Moreover, this should be true even when we assume multiple kinetic groups (and kinetic rates) to describe the putative random processes.
Remarkably, the average value of ΔT substantially decreases with the number of SNARE complexes formed in one vesicle complex, which directly means that the formation of individual SNARE complexes does not occur in a random manner. Instead, formation of one SNARE complex accelerates formation of other SNARE complexes. This suggests a cooperative mechanism underlying multimeric formation of SNARE complexes, which would trigger a cascade of SNARE assembly (Fig. 4c).
In the traditional single-molecule FRET technique, a single protein uses the entire FRET range, which is suited for dissecting its possible intermediate states14–17. However, in the approach described here, the dynamic FRET range is divided and allotted to ND proteins under observation. Association of two binding partners, protein heterodimer, is reported using one of these divided FRET ranges. Similar to the conventional single-molecule FRET, there are limitations in the current method. First, the labeling po-sitions should be chosen with discretion so that the FRET efficiency of the specific protein-protein complex (H) should have the highest possible value, which consequently defines the dynamic FRET range. At the same time, non-specific interactions between proteins that perturb the FRET process in the specific protein complex should be negligible Second, the current method is optimized for protein heterodimers with two clear states. Additional refinement will be required when differentiating multiple states in individual protein heterodimers. Third, this binding state should be stable enough to show negligible dissociation during observation time. Despite these potential limitations, our approach would offer a unique platform to study complex formation between two different proteins in crowded environment, where multiple protein-protein interactions play important roles.
We have demonstrated that this multiple protein-protein FRET technique can dissect individual SNARE complex formation events as stepwise FRET changes when there are more than 10 donor- and acceptor-labeled SNAREs on a 30 nm-sized vesicle (Supplementary Fig. 7). SNARE proteins were reported to be even in a clustered state3, implying that our observations were indeed made in a highly crowded molecular environment. Our method could be extended to other membrane protein interactions like those of cell adhesion protein to reveal their multimeric interaction kinetics18.
Our results demonstrate that formation of the SNARE complex is a strongly cooperative process, which triggers concurrent actions of multiple SNARE proteins. Such concurrent, multimeric SNARE complex formation would induce membrane fusion on a faster time scale than would be possible with sporadic SNARE complex formation19,20. We note that the Habc domain (of Sso1p), which hinders formation of the SNARE complex21, has not been included in our experiment. Nevertheless, our work suggests that if the regulatory effect of Habc can be lifted by upstream factors21, the SNARE motifs have an intrinsic cooperative interaction to drive assembly of multiple SNARE complexes. Because the yeast SNARE complex is structurally homologous to the neuronal SNARE complex, we presume that the neuronal SNARE proteins also show such strongly cooperative processes in their complex formation7,22. In a highly controlled membrane fusion process like synaptic vesicle fusion, we speculate that formation of the first SNARE complex defines an ideal regulation point for the intervention by fusion regulators because this first SNARE complex would then trigger the formation of other SNARE complexes. Formation of multiple SNARE complexes will reduce effective tension on individual SNARE complexes and push zippering of SNARE complex toward the membrane-proximal part23,24, which finally catalyzes fusion pore opening25,26.
Supplementary Material
ACKNOWLEDGMENT
This work was supported by National Creative Research initiatives of MEST/NRF of Korea (Center for Single-Molecule Systems Biology to T.-Y.Y.), National Research Foundation of Korea Grants funded by the Korean Government (2009-0087691 to T.-Y.Y.), Korea Research Foundation (2010-0000602 to C.H.), National Institute of Health (GM051290-18 to Y.-K. S.) and Korea Institute of Science and Technology (Director's fund to Y.-K. S.)
Footnotes
ASSOCIATED CONTENT
Supporting Information
Experimental methods, theoretical derivation of single vesicle FRET efficiency and signal to noise and supplementary data. This material is available free of charge via the Internet at http://pubs.acs.org.
The authors declare no competing financial interests.
REFERENCES
- 1.Roy R, Hohng S, Ha T. Nat. Methods. 2008;5:507. doi: 10.1038/nmeth.1208. [DOI] [PMC free article] [PubMed] [Google Scholar]
- 2.Takamori S, Holt M, Stenius K, Lemke EA, Gronborg M, Riedel D, Urlaub H, Schenck S, Brugger B, Ringler P, Muller SA, Rammner B, Grater F, Hub JS, De Groot BL, Mieskes G, Moriyama Y, Klingauf J, Grubmuller H, Heuser J, Wieland F, Jahn R. Cell. 2006;127:831. doi: 10.1016/j.cell.2006.10.030. [DOI] [PubMed] [Google Scholar]
- 3.Sieber JJ, Willig KI, Kutzner C, Gerding-Reimers C, Harke B, Donnert G, Rammner B, Eggeling C, Hell SW, Grubmüller H, Lang T. Science (New York, N.Y.) 2007;317:1072. doi: 10.1126/science.1141727. [DOI] [PubMed] [Google Scholar]
- 4.Leake MC, Chandler JH, Wadhams GH, Bai F, Berry RM, Armitage JP. Nature. 2006;443:355. doi: 10.1038/nature05135. [DOI] [PubMed] [Google Scholar]
- 5.Jahn R, Scheller RH. Nature reviews. Molecular cell biology. 2006;7:631. doi: 10.1038/nrm2002. [DOI] [PubMed] [Google Scholar]
- 6.Rizo J, Sudhof TC. Nat. Rev. Neurosci. 2002;3:641. doi: 10.1038/nrn898. [DOI] [PubMed] [Google Scholar]
- 7.Strop P, Kaiser SE, Vrljic M, Brunger AT. J. Biol. Chem. 2008;283:1113. doi: 10.1074/jbc.M707912200. [DOI] [PubMed] [Google Scholar]
- 8.Yoon TY, Okumus B, Zhang F, Shin YK, Ha T. Proceedings of the National Academy of Sciences of the United States of America. 2006;103:19731. doi: 10.1073/pnas.0606032103. [DOI] [PMC free article] [PubMed] [Google Scholar]
- 9.Diao J, Su Z, Ishitsuka Y, Lu B, Lee KS, Lai Y, Shin YK, Ha T. Nature communications. 2010;1:54. doi: 10.1038/ncomms1054. [DOI] [PMC free article] [PubMed] [Google Scholar]
- 10.Kyoung M, Srivastava A, Zhang Y, Diao J, Vrljic M, Grob P, Nogales E, Chu S, Brunger AT. Proceedings of the National Academy of Sciences of the United States of America. 2011;108:E304. doi: 10.1073/pnas.1107900108. [DOI] [PMC free article] [PubMed] [Google Scholar]
- 11.Ha T, Ting AY, Liang J, Caldwell WB, Deniz AA, Chemla DS, Schultz PG, Weiss S. Proc. Natl. Acad. Sci. U. S. A. 1999;96:893. doi: 10.1073/pnas.96.3.893. [DOI] [PMC free article] [PubMed] [Google Scholar]
- 12.Kalafut B, Visscher K. Comput Phys Commun. 2008;179:716. [Google Scholar]
- 13.Gopich I, Szabo A. J. Chem. Phys. 2005;122:14707. doi: 10.1063/1.1812746. [DOI] [PubMed] [Google Scholar]
- 14.McKinney SA, Joo C, Ha T. Biophys. J. 2006;91:1941. doi: 10.1529/biophysj.106.082487. [DOI] [PMC free article] [PubMed] [Google Scholar]
- 15.Joo C, McKinney SA, Nakamura M, Rasnik I, Myong S, Ha T. Cell. 2006;126:515. doi: 10.1016/j.cell.2006.06.042. [DOI] [PubMed] [Google Scholar]
- 16.Uphoff S, Holden SJ, Le Reste L, Periz J, van de Linde S, Heilemann M, Kapanidis AN. Nat. Methods. 2010;7:831. doi: 10.1038/nmeth.1502. [DOI] [PubMed] [Google Scholar]
- 17.Weninger K, Bowen ME, Chu S, Brunger AT. Proc. Natl. Acad. Sci. U. S. A. 2003;100:14800. doi: 10.1073/pnas.2036428100. [DOI] [PMC free article] [PubMed] [Google Scholar]
- 18.Maheshwari G, Brown G, Lauffenburger DA, Wells A, Griffith LG. J. Cell Sci. 2000;113(Pt 10):1677. doi: 10.1242/jcs.113.10.1677. [DOI] [PubMed] [Google Scholar]
- 19.Hua Y, Scheller RH. Proceedings of the National Academy of Sciences of the United States of America. 2001;98:8065. doi: 10.1073/pnas.131214798. [DOI] [PMC free article] [PubMed] [Google Scholar]
- 20.Domanska MK, Kiessling V, Stein A, Fasshauer D, Tamm LK. J. Biol. Chem. 2009;284:32158. doi: 10.1074/jbc.M109.047381. [DOI] [PMC free article] [PubMed] [Google Scholar]
- 21.Munson M, Chen X, Cocina AE, Schultz SM, Hughson FM. Nat. Struct. Biol. 2000;7:894. doi: 10.1038/79659. [DOI] [PubMed] [Google Scholar]
- 22.Sutton RB, Fasshauer D, Jahn R, Brunger AT. Nature. 1998;395:347. doi: 10.1038/26412. [DOI] [PubMed] [Google Scholar]
- 23.Gao Y, Zorman S, Gundersen G, Xi Z, Ma L, Sirinakis G, Rothman JE, Zhang Y. Science. 2012;337:1340. doi: 10.1126/science.1224492. [DOI] [PMC free article] [PubMed] [Google Scholar]
- 24.Min D, Kim K, Hyeon C, Cho YH, Shin YK, Yoon TY. Nature communications. 2013;4:1705. doi: 10.1038/ncomms2692. [DOI] [PMC free article] [PubMed] [Google Scholar]
- 25.Diao J, Grob P, Cipriano DJ, Kyoung M, Zhang Y, Shah S, Nguyen A, Padolina M, Srivastava A, Vrljic M, Shah A, Nogales E, Chu S, Brunger AT. eLife. 2012;1:e00109. doi: 10.7554/eLife.00109. [DOI] [PMC free article] [PubMed] [Google Scholar]
- 26.Hernandez JM, Stein A, Behrmann E, Riedel D, Cypionka A, Farsi Z, Walla PJ, Raunser S, Jahn R. Science. 2012;336:1581. doi: 10.1126/science.1221976. [DOI] [PMC free article] [PubMed] [Google Scholar]
Associated Data
This section collects any data citations, data availability statements, or supplementary materials included in this article.


