

Abstract
Reactive oxygen species (ROS) have been demonstrated to contribute to HIV-induced tubular cell injury. We hypothesized that HIV-induced ROS generation may be causing tubular cell injury through downregulation of vitamin D receptor (VDR) and associated downstream effects. In the present study, HIV not only downregulated tubular cell VDR expression but also inflicted DNA injury. On the other hand, EB-1089, a VDR agonist (VD), inhibited both downregulation of VDR and tubular cell DNA injury in the HIV milieu. H2O2 (an O− donor) directly downregulated tubular cell VDR, whereas catalase, a free radical scavenger, inhibited HIV-induced downregulation of tubular cell VDR expression. HIV also stimulated the tubular cell renin-angiotensin system (RAS) through downregulation of VDR. Because losartan (an ANG II blolcker) partially inhibited HIV-induced tubular cell ROS generation while ANG II directly stimulated tubular cell ROS generation, it appears that HIV-induced ROS production was partly contributed by the RAS activation. VD not only inhibited HIV-induced RAS activation but also attenuated tubular cell ROS generation. Tubular cells displayed double jeopardy in the HIV milieu induction of double-strand breaks and attenuated DNA repair; additionally, in the HIV milieu, tubular cells exhibited enhanced expression of phospho-p53 and associated downstream signaling. A VDR agonist and an ANG II blocker not only preserved expression of tubular cell DNA repair proteins but also inhibited induction of double-strand breaks. In in vivo studies, renal cortical sections of Tg26 mice displayed attenuated expression of VDR both in podocytes and tubular cells. In addition, renal cortical sections of Tg26 mice displayed enhanced oxidative stress-induced kidney cell DNA damage. These findings indicated that HIV-induced tubular cell downregulation of VDR contributed to the RAS activation and associated tubular cell DNA damage. However, both VD and RAS blockade provided protection against these effects of HIV.
Keywords: human immunodeficiency virus, reactive oxygen species
reactive oxygen species (ROS) are free radicals (unpaired electrons) that are highly reactive and have a short life span (20). They are generated as by-products of the incomplete four-electron reduction of molecular oxygen to water. Mitochondria are not only the major source of ROS generation but also its target damage site (20). ROS has a potential to cause damage to several mitochondrial constituents, including nucleic acids, lipids, and proteins; the damaged mitochondria initiate a perpetual cycle of ROS production facilitated by ROS-induced ROS release (3).
The building blocks of DNA molecules, nucleotides consist of a sugar component and an organic base (33). Each DNA molecule consists of two strands of nucleotides held together by weak chemical bonds. Changes in the nucleotides in one strand can result in mismatches with the nucleotides in the other strand, yielding subsequent alterations in proteins (mutations). Any irreversible damage to DNA can result in a mutation; the latter may lead to malfunction or complete inactivation of the affected proteins (4). ROS are a major source of DNA damage; >100 oxidative DNA adducts have been identified as a consequence of ROS-induced DNA damage (40); furthermore, ROS directly induces single- and double-strand breaks, abasic sites, and DNA cross-links (41). It has been estimated that a human cell is exposed to up to 105 oxidative hits a day from ROS (41). We hypothesized that ROS-induced vitamin D receptor (VDR) downregulation was required for HIV-induced tubular cell DNA damage.
ROS-induced DNA damage is invariably associated with the activation of p53 (32). To repair DNA damage, p53 invokes transcription of genes, which prolong cell cycle (to provide time to repair damaged DNA) and transcription of DNA repair proteins to ensue DNA repair. Nonetheless, if ROS production is overwhelming (oxidative stress), p53 induces cell death through the transcription of cell death proteins, a rescue strategy for the cells from entering into the carcinogenesis pathway (19). In the present study, we examined the involved mechanisms for HIV-induced tubular cell ROS generation, DNA damage, and the repair response.
HIV has been reported to induce the apoptotic phenotype in tubular cells (26, 42, 45). Increasing evidence supports that oxidative stress is involved in the induction of HIV-induced kidney cell apoptosis (22, 42). In addition, oxidative stress may contribute to HIV disease pathogenesis by enhancing viral replication (38, 46), increasing the inflammatory immune response (10), and accelerating the loss of immune function (47). A paradigm based on HIV-1-induced overproduction of ROS has been proposed to account for the activation of apoptosis in several cell types, including tubular cells (5, 16, 22, 25, 40, 42, 49); in these cells, ROS contributed to the apoptotic process by multiple pathways. However, the role of ROS in the downregulation of VDR has not been reported to date.
Development of HIVAN requires the presence of genetic (black ancestry in general and presence of APOL1 gene in particular), environmental (HIV infection), and specific host factors [such as activation of the renin-angiotensin system (RAS)] (35, 36). On that account, blockade of angiotensin type 1 receptors or inhibition of the production of ANG II are commonly used therapeutic modalities to slow down the progression of HIVAN (1, 2). Conversely, infusion of ANG II has been demonstrated to accelerate the progression of HIVAN in Vpr mice (23). In a recent report, Vpr mice with higher angiotensinogen (Agt) copies developed overt HIVAN, whereas mice with lower Agt copies displayed only clinically occult HIVAN (23). Mice with higher Agt copies not only displayed high renal tissue ANG II levels but also showed increased renal tissue expression of renin and angiotensin-converting enzyme (ACE). It was likely that ANG II-induced ROS generation had contributed to kidney cell injury in Vpr mice with four Agt copies. However, the direct effect of HIV on tubular cell ANG II production has not been reported to date. In the present study, we hypothesized that HIV may be directly stimulating ANG II production by tubular cells.
In addition to calcium homeostasis, the role of vitamin D has been increasingly recognized in the pathogenesis of HIV infection and cancer (12, 29). Vitamin D works through VDR, a ligand-dependent transcription factor. After binding with vitamin D, VDR forms heterodimeric complex with retinoid X receptor and binds to vitamin D response element and modulates their transactivation of transcription. On that account, a VDR deficit would not only compromise vitamin D signaling but would also derail the homeostasis of other signaling pathways. We hypothesized that HIV-induced tubular cell ROS generation was further amplified through RAS activation in response to HIV-induced downregulation of VDR. In a recent study, a vitamin D analog slowed down the progression of renal injury in a rat renal ablation model by attenuation of oxidative stress (11). ACE inhibition further enhanced this effect of vitamin D analog. Although these investigators did not measure the baseline renal cell VDR expression in this model, nonetheless, we presume that renal cells in the renal ablation model had attenuated renal cell VDR expression, which was upregulated by vitamin D.
In the present study, HIV stimulated tubular cell ROS generation, which led to tubular cell downregulation of VDR and activation of the RAS. HIV-induced tubular cell RAS activation further accelerated ROS generation. Interestingly, HIV not only induced tubular cell DNA damage but also compromised DNA repair. Although HIV activated the tubular cell p53 pathway and associated downstream signaling, it appeared to be a futile attempt to rescue tubular cells from DNA injury. On the other hand, VDR agonist (VD) inhibited HIV-induced downregulation of tubular cell VDR as well as RAS activation. Moreover, both a VD and an ANG II blocker inhibited HIV-induced tubular cell DNA damage. The latter effect of a VD and an ANG II blocker may be related to attenuated ROS generation and enhanced DNA repair in the HIV milieu.
MATERIALS AND METHODS
Proximal Tubular Cells
Mouse proximal tubular epithelial cells (MC) were a gift from Dr. Poornima Upadhya (Long Island Jewish Medical Center, New Hyde Park, NY). Mouse tubular cells were characterized by their expression for cytokeratin-18 and -19 and E-cadherin. Primary human proximal tubular cells (HC) were obtained from Scien Cell Research Laboratories (San Diego, CA).
HIV Transgenic Mice
We have used age- and sex-matched FVB/N (control) and Tg26 (on FVB/N background) mice. The Tg26 transgenic animal has the proviral transgene, pNL4–3: d1443, which encodes all the HIV-1 genes except gag and pol and therefore the mice are noninfectious (42). Mice were housed in groups of four in a laminar-flow facility (Small Animal Facility, Long Island Jewish Medical Center). We are maintaining colonies of these animals in our animal facility.
The Ethics Review Committee for Animal Experimentation of Long Island Jewish Medical Center approved the experimental protocol.
Production of Pseudotyped Retroviral Supernatant
Replication-defective viral supernatants were prepared as published previously (21). In brief, green fluorescence protein (GFP) reporter gene (from pEGFP-C1; Clontech, Palo Alto, CA) was substituted in place of gag/pol genes in HIV-1 proviral construct pNL4–3. This parental construct (pNL4–3:ΔG/P-GFP) was used to produce VSV.G pseudotyped viruses to provide pleiotropism and high-titer virus stocks. Infectious viral supernatants were produced by the transient transfection of 293T cells using Effectene (Qiagen, Valencia, CA) according to the manufacturer's instructions. The HIV-1 gag/pol and VSV.G envelope genes were provided in trans using pCMV R8.91 and pMD.G plasmids, respectively (gifts of Dr. Didier Trono, Salk Institute, La Jolla, CA). As a negative control, virus was also produced from pHR-CMV-IRES2-GFP-ΔB, which contained HIV-1 LTRs and GFP empty expression vector. The viral stocks were titrated by infecting HeLa tat cells with 10-fold serial dilution as reported previously (22). The reciprocal of the lowest dilution showing expression of GFP was defined as GFP-expressing units (GEU) per milliliter. Viral stocks ranging from 105 to 106 GEU/ml were used.
Immunofluorescence Detection of Oxidant Stress in Tubular Cells
The trafficking of 2, 3, 4, and 5,6-pentafluorodihydrotetramethyllrosamine (PF-HTMRos or Redox Sensor Red CC-1; Molecular Probes, Eugene, OR) was used to detect reactive oxygen intermediates in control and experimental tubular cells. Redox Sensor Red CC-1 is oxidized in the presence of O2− and H2O2. In brief, control and experimental T cells were loaded at 37°C for 20 min with Redox Sensor Red CC-1 (0.5 μM) and a mitochondria-specific dye, MitoTracker greenFM (100 nM; Molecular Probes). Culture slides were washed and mounted with PBS and visualized with a Nikon fluorescence microscope (Nikon Eclipse E800) equipped with a triple filter cube and charge-coupled device camera (Nikon DXM1200). The staining was performed in quadruplicate for each group, and 10 random fields were studied in replicate. Images were captured using Nikon ACT-1 (version 1.12) software and combined for publishing format using Adobe Photoshop 6.0 software (22).
Immunofluorescence Detection of VDR, DNA Strand Breaks and Repair
Control and experimental tubular cells were fixed and permeabilized with a buffer containing 0.02% Triton X-100 and 4% formaldehyde in PBS. Fixed cells were washed three times in PBS and blocked in 1% BSA for 30 min at 37°C. Phosphohistone H2AX (γH2AX) was detected by a mouse monoclonal antibody that recognizes phosphorylated serine within the amino acid sequence 134–142 of human histone H2A.X (UBI) and fluorescein isothiocyanate-conjugated goat anti-mouse secondary antibody (Molecular Probes). KU-80, a DNA repair protein, was detected by rhodamine-conjugated anti-KU-80 antibody (Cell Signaling, Danvers, MA). Double labeling was indicated by orange color. Negative controls were performed in the presence of nonspecific isotype antibodies in place of primary antibody. In all variables, DNA was counterstained with 4′6′-diamidino-2-phenylindole (DAPI).
To carry out immunolabeling for VDR, in parallel sets of experiments, control and experimental cells were labeled with anti-VDR antibody and DAPI.
Specific staining was visualized with an inverted Olympus 1X 70 fluorescence microscope equipped with a Cook Sensicom ER camera (Olympus America, Melville, NY). Final images were prepared with Adobe Photoshop to demonstrate subcellular localization of γH2AX (22).
Determination of ROS Kinetics in Tubular Cells
The kinetics of ROS metabolism in control and experimental tubular cells was determined by measuring the intensity of the fluorescent signal from the redox-sensitive fluoroprobe 2′,7′-dichlorofluorescein diacetate (DCFDA) at multiple time points. DCFDA is converted by intracellular esterases to 2′,7′-dichlorodihydrofluorcein, which in turn is oxidized by H2O2 to the fluorescent 2′7′-dichlorohydrofluorescein (DCF). Briefly, control and experimental tubular cells were incubated in phenol red-free medium containing 10 mM DCFDA for 30 min at 37°C. Cells were washed with phenol red-free media, and DCF fluorescence was detected by a Fluorescence Multi-Well Plate Reader CytoFluor 4000 (PerSeptive Biosystems) set for excitation of 485 nm and emission of 530 nm. The intensity of the fluorescent signal was calculated with Microsoft excel using the equation [(Ft − F0)/F0 × 100] (42).
Silencing of VDR
HCs were transfected with 100 nM VDR small-interfering RNA (siRNA) (Santa Cruz Biotechnology, Santa Cruz, CA) with Siport Neofax transfection reagent and left in optiMEM media for 48 h. Control and trransfected cells were used under control and experimental conditions.
Reverse-Transcription PCR Analysis
Control and experimental tubular cells were used to quantify mRNA expression of molecules pertaining to VDR and renin. RNA was extracted using TRIZOL (Invitrogen). For cDNA synthesis, 2 μg of the total RNA were preincubated with 2 nmol of random hexamer (Invitrogen) at 65°C for 5 min. Subsequently, 8 μl of the reverse-transcription (RT) reaction mixture containing Cloned AMV RT, 0.5 mmol each of the mixed nucleotides, 10 mmol dithiothreitol, and 1,000 U/ml RNasin (Invitrogen) were incubated at 42°C for 50 min. For a negative control, a reaction mixture without RNA or RT was used. Samples were subsequently incubated at 85°C for 5 min to inactivate the RT.
Quantitative PCR was carried out in an ABI Prism 7900HT sequence detection system using the primer sequences as follows: VDR: forward GGAAGTGCAGAGGAAGCGGGA, reverse AGTGCTGGACAGCTAGGG; renin: forward AGGCCTTCCTTGACCAATCT, reverse GTGAATCCCACAAGCAAGGT.
SYBR green was used as the detector and ROX as a stabilizing dye. Results (means ± SD) represent the number of samples as described in the legends for Figs. 1–10. The data were analyzed using the Comparative CT method (ΔΔCT method). Differences in CT are used to quantify the relative amount of PCR target contained within each well. The data were expressed as relative mRNA expression in reference to control, normalized to quantity of RNA input by performing measurements on an endogenous reference gene, GAPDH.
Fig. 1.
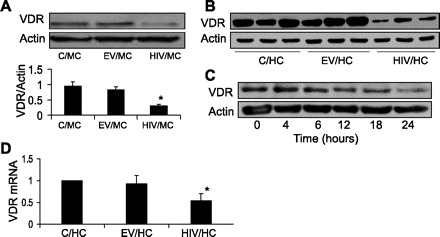
HIV induces downregulation of vitamin D receptor (VDR). A: C/mouse proximal tubular epithelial cells (MCs), EV/MCs, and HIV/MC were incubated in serum-free media (SFM) for 24 h. At the end of the incubation periods, cells were harvested, and Western blotting was done for VDR expression (n = 3). The same blots were stripped and reprobed for actin. Representative gels and cumulative data of three sets of experiments are shown. *P < 0.01 compared with C/MC or EV/MC. B: C/human proximal tubular cells (HCs), EV/HCs, and HIV/HCs were incubated in SFM for 24 h (n = 3) . Subsequently, cellular lysates (three different sets of experiments) were electrophoresed and probed for VDR and actin. The lane on top shows expression of VDR by C/HC, EV/HC, and HIV/HC. The lane on bottom displays actin content under similar conditions. C: HIV/HCs were incubated in SFM at the indicated time periods. Subsequently, protein blots were probed for VDR and actin. D: C/HC, EV/HC/, and HIV/HCs were incubated in SFM for 24 h. Subsequently, total RNA was extracted and probed for VDR by real-time PCR. *P < 0.05 compared with C/HC and EV/HC.
Fig. 2.

HIV-induced tubular cell VDR downregulation is mediated through reactive oxygen species (ROS). A: EV/HCs, HIV/HCs, HIV/HCs + catalase (CAT, 200 U) were incubated in SFM for 24 h. Subsequently, cellular lysates were electrophoresed and probed for VDR and actin (n = 3). The lane on top shows VDR expression by control and experimental cells. The lane on bottom shows actin content of the cells under similar conditions. B: total RNA was extracted from the cells treated under conditions mentioned in A (C/HCs, EV/HCs, HIV/HCs, and HIV/HCs + catalase). VDR expression was measured by real-time PCR studies (n = 3). *P < 0.01 compared with C/HC and EV/HC. **P < 0.05 compared with HIV/HC. C: HCs were incubated in SFM containing variable concentrations of H2O2 (0, 25, 50, 100, 250, and 500 μM) for 12 h. Subsequently, cellular lysates were electrophoresed and probed for VDR and actin. The lane on top shows VDR expression by control and experimental cells. The lane on bottom shows actin content of these cells.
Fig. 3.
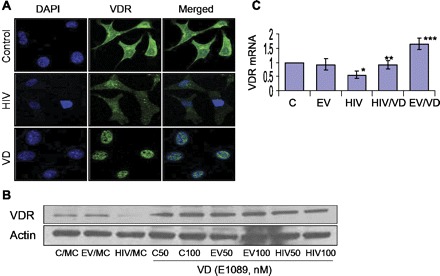
VDR agonist (VD) upregulates VDR under basal and HIV-stimulated states. A: C/MCs (control), HIV/MCs (HIV), and C/MCs treated with VD (EB-1089, 50 nM) were labeled for VDR and then examined under an immunofluorescence microscope. Representative microphotographs are shown. Control cells displayed moderate expression (green fluorescence), predominantly in the cytosolic compartment. HIV/MCs displayed diminished cytosolic expression of VDR (faint fluorescence). C/MCs treated with VD displayed predominantly nuclear localization of VDR. B: C/MCs, EV/MCs, and HIV/MCs were incubated in media containing either buffer or VD (EB-1089, 50 or 100 nM) for 24 h. Subsequently, protein blots were probed for VDR and actin. Representative gels are shown. The lane on top shows VDR expression by control and experimental cells. The lane on bottom shows actin content of these cells. C: C/MCs (C), EV/MCs (EV), and HIV/MCs (HIV) were incubated in media containing either buffer or VD (50 nM) for 24 h. Subsequently, total RNA was extracted, and mRNA expression for VDR was assayed by real-time PCR studies. *P < 0.05 compared with C and EV. **P < 0.05 compared with HIV alone. ***P < 0.01 compared with C, EV, and HIV/VD.
Fig. 4.
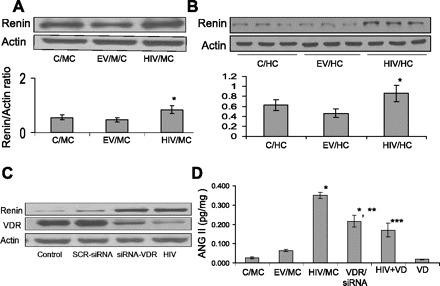
HIV enhances the tubular cell renin-angiotensin system (RAS). A: C/MCs, EV/MCs, and HIV/MCs were incubated in SFM for 24 h. Subsequently, protein blots were probed for renin and actin expression. Representative gel is shown. Cumulative data of three sets of experiments are shown as a bar diagram. *P < 0.05 compared with C/MC and EV/MC. B: C/HCs, EV/HCs, and HIV/HCs were incubated in SFM for 24 h. Subsequently, cellular lysates were electrophoresed and probed for renin and actin (n = 3). Representative gels displaying renin expression by C/HCs, EV/HCs, and HIV/HCs are shown. Cumulative data are shown in bar graphs. C: C/MCs were transfected with scrambled small-interfering RNA (siRNA) and siRNA VDR. Protein blots of C/MC, SCR-siRNA/MC, siRNA-VDR/MC, and HIV/MC were probed for VDR, renin, and actin. Both siRNA-VDR/MCs and HIV/MC displayed downregulation of VDR and upregulation of renin. D: C/MCs, EV/MCs, HIV/MCs, siRNA-VDR transfected C/MCs (siRNA/VDR/MC), HIV/MC treated with VD for 24 h (HIV + VD), and EV/MC treated with VD for 24 h (VD) were assayed for their ANG II levels by enzyme-linked immunosorbent assay (n = 4). *P < 0.001 vs. C/MC/EV/MC and VD. **P < 0.01 compared with HIV. ***P < 0.01 compared with HIV.
Fig. 5.

Role of VDR and the RAS in HIV-induced ROS generation. A: EV/MC and HIV/MC were treated with either buffer or losartan (10−7M, LOS) for 24 h and then loaded with 2′,7′-dichlorofluorescein diacetate (DCFDA). After 30 min, ROS generation was measured at the indicated time periods by a fluorometer (n = 3). *P < 0.001 compared with EV. **P < 0.05 vs. HIV+LOS. ***P < 0.01 compared with HIV + LOS. B: HCs were incubated in SFM containing variable concentrations of ANG II (0, 10−10 to 10−6 M) followed by loading with DCFDA. After 30 min, ROS generation was measured at the indicated time periods by a fluorometer (n = 3). *P < 0.001 vs. C. **P < 0.01 vs. ANG II, 10−10 M. ***P < 0.01 vs. ANG II, 10−8 M. C: C/MC and HIV/MCs were incubated with buffer or VD (50 nm) and then loaded with DCFDA. Subsequently, ROS generation was measured by a fluorometer (n = 3). *P < 0.001 compared with EV. **P < 0.01 compared with HIV + VD. D: EV/MC and HIV/MC were incubated in media containing either buffer, VD (50 nM), or LOS (10−7 M) and then labeled with Red CC1 and MitoTracker green followed by fluorescence microscopy. Representative microphotographs are shown. EV/MC displayed minimal mitochondrial ROS generation (ROS generation is indicated by red fluorescence, green fluorescence indicated mitochondria; mitochondrial ROS generation is indicated by orange or yellow fluorescence). HIV/MCs displayed enhanced mitochondrial ROS generation. Both VD and LOS displayed attenuated mitochondrial ROS generation.
Fig. 6.

Effect of HIV tubular cell DNA damage and repair. A: C/HCs, EV/HCs, and HIV/HCs were incubated in SFM for 24 h. Subsequently, Western blotting was performed and probed for phospho-yH2AX, KU-80, Rad5, and actin. Representative gels of two different sets of experiments are displayed. B: cumulative data from three different sets of experiments displaying pyH2AX-to-actin ratio. *P < 0.01 compared with C/HC and EV/HC. C: cumulative data from three different sets of experiments displaying KU-80-to-actin ratio. *P < 0.01 compared with C/HC and EV/HC.
Fig. 7.

VD and ANG II blockade prevents HIV-induced tubular cell DNA damage. A: EV/HCs (control) and HIV/HCs (HIV) were incubated in SFM containing either buffer VD (50 nM) or LOS (10−7 M) for 24 h. Subsequently, cells were colabeled with anti-H2AX and anti-KU-80 antibodies along with nuclear stain [4′6′-diamidino-2-phenylindole (DAPI)] (n = 3). Representative microphotographs are shown. Control cells displayed baseline double-strand breaks (green fluorescence), whereas HIV cells showed an enhanced number of double-strand breaks. However, both VD and LOS attenuated HIV-induced double-strand breaks. Similarly, HIV attenuated expression of KU-80 compared with control, whereas both VD- and LOS-treated cells displayed increased KU-80 expression compared with HIV. B: cumulative data displaying H2AX foci number from the experimental protocol described in A are shown in the form of a scattergram. C: cumulative data displaying integrated density of KU-80 from the experimental protocol described in A are shown in the form of a scattergram.
Fig. 8.
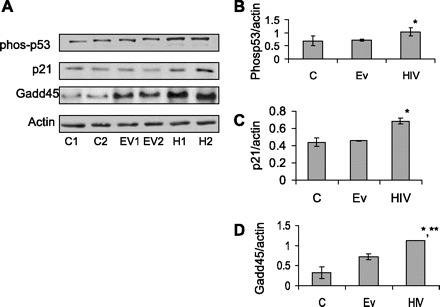
HIV induces tubular cell p53 activation and associated downstream signaling. A: C/HCs, EV/HCs, and HIV/HCs were incubated in SFM for 24 h. Subsequently, protein blots were probed for phospho-p53, p21, Gadd45, and actin. Representative gels from two different sets of experiments are shown. B: cumulative data from the three different sets of experiments carried out as shown in A, showing phospho-p53-to-actin ratio. *P < 0.05 compared with C and EV. C: cumulative data from the three different sets of experiments carried out as shown in A, showing p21-to-actin ratio. *P < 0.01 compared with C and EV. D: cumulative data from the three different sets of experiments carried out as demonstrated in A, showing Gadd45-to-actin ratio. *P < 0.001 compared with C. **P < 0.01compared with EV.
Fig. 9.

Renal tissues of HIV transgenic mice display attenuated expression of VDR. A: renal cortical sections from control and Tg26 mice were labeled for VDR and examined under light microscopy (n = 3). Both podcytes (dark brown VDR staining indicated by yellow arrows) and tubular cells (dark brown VDR staining indicated by white arrows) displayed expression of VDR in a control mouse. Both podocytes and tubular cells displayed minimal expression of VDR in a Tg26 mouse. B: protein blots from renal tissues of control and Tg26 mice (n = 3) were probed for VDR. The same blots were reprobed for actin. The lane on top displays expression of VDR by renal tissue from three different mice. The lane on bottom shows actin expression under the same conditions. Densitometric analysis of these gels is shown in the form of bar graphs.
Fig. 10.
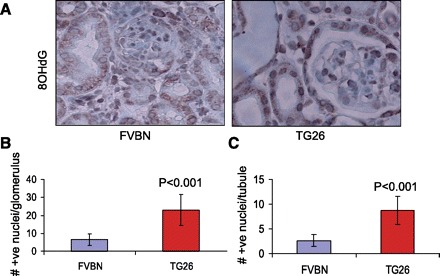
Renal cells in HIV transgenic mice display enhanced oxidative stress- induced DNA damage. A: renal cortical sections of control and Tg26 mice were labeled for 8-OHdG (n = 3). 8-OHdG +ve nuclei are stained dark brown. Both glomeruli and tubules displayed a greater number of 8-OHdG +ve nuclei in Tg26 mice. B: no. of 8-OHdG +ve nuclei/glomerulus. C: no. of 8-OHdG +ve nuclei/tubule.
Immunohistochemical Studies
Renal cortical sections from control and HIV-1 transgenic (Tg26) mice were deparaffinized, and antigen retrieval was done by microwave heating. The endogenous peroxidase was blocked with 0.3% H2O2 in methanol for 20 min at room temperature. Sections were washed in PBS three times and incubated in blocking serum solution for 30 min at room temperature followed by incubation with primary antibodies against either VDR (mouse monoclonal; Santa Cruz Biotechnology) or 8-OHdG (mouse monoclonal; Santa Cruz) overnight at 4°C in a moist chamber. Each of the sections was washed three times with PBS and incubated in appropriate secondary antibody at 1:250 dilutions at room temperature for 1 h. After being washed with PBS three times, sections were incubated in avidin-biotin complex reagent (Vector Laboratories, Burlingame, CA) for 1 h. Sections were washed three times in PBS and then placed in diaminobenzidine/H2O2 solution, counterstained with hematoxylin, dehydrated, and mounted with a xylene-based mounting media (Permount; Fisher Scientific, Fair Lawn, NJ). Appropriate positive and negative controls were used.
Qunatification of Kidney Cell DNA Damage In Vivo
Renal cortical sections of control and Tg26 mice (n = 3) were evaluated by two investigators unaware of the experimental conditions. Numbers of darkly stained nuclei (OHdG +ve) were counted in 12 random fields. Numbers of OHdG +ve nuclei were calculated per glomerulus/tubule.
Western Blotting Studies
Control and experimental cells/renal tissues were lysed in RIPA buffer containing 50 mM Tris-Cl (pH 7.5), 150 mM NaCl, 1 mM EDTA, 1% Nonidet P-40, 0.25% deoxycholate, 0.1% SDS, 1× protease inhibitor cocktail I (Calbiochem, EMD Biosciences, Gibbstan, NJ), 1 mM phenylmethylsulfonyl fluoride, and 0.2 mM sodium orthovanadate. Protein concentration was measured with the Bio-Rad Protein Assay kit (Pierce, Rockford, IL). Protein lysates (20 μg) were separated on a 4–15% gradient polyacrylamide gel (Bio-Rad, Hercules, CA) and transferred to a nitrocellulose membrane using the Bio-Rad mini blot apparatus. Nitrocellulose membranes were then subjected to immunostaining with primary antibodies against VDR (mouse monoclonal; Santa Cruz), anti-phoshpho-p53 (mouse monoclonal; Cell Signaling Technology), anti-renin (Santa Cruz Biotechnology), anti-Rad51 (rabbit polyclonal ABCA), anti-KU-80 (rabbit polyclonal; Cell Signaling), anti-H2AX (mouse monoclonal; Millipore, Billerica, MA), anti-p21 (rabbit polyclonal; Cell Signaling), anti-GADD45α (Rabbit polyclonal; Cell Signaling), anti-renin (mouse monoclonal; Abnova, Walnut, CA.), and subsequently with horseradish peroxidase-labeled appropriate secondary antibodies. The blots were developed using a chemiluminescence detection kit (Pierce) and exposed to X-ray film (Eastman Kodak, Rochester, NY). Equal protein loading was confirmed by immunoblotting for actin protein using a polyclonal α-actin antibody (Santa Cruz Technology) on the same Western blots.
Statistical Analysis
For comparison of mean values between two groups, the unpaired t-test was used. To compare values between multiple groups, ANOVA was used to calculate a P value. Statistical significance was defined as P < 0.05. Results are presented and means ± SD.
RESULTS
HIV Induces Downregulation of VDR
To determine the effect of HIV on tubular cell VDR expression, protein blots of C/MCs, EV/MCs, and HIV/MC were probed for VDR (n = 3). The same blots were stripped and reprobed for actin. Representative gels of one set of experiment and cumulative data of three sets of experiments are shown in Fig. 1A. HIV/MC displayed attenuated expression of VDR.
To evaluate whether HIV would also downregulate VDR expression in human tubular cells, cellular lysates of C/HCs, EV/HCs, and HIV/HCs (three different sets of experiments) were electrophoresed and probed for VDR and actin. Representative gels of C/HC, EV/HC, and HIV/HC from three different experiments are shown in Fig. 1B. HIV also downregulated VDR expression in human tubular cells.
To determine the time course effects of HIV on tubular cell VDR expression, HIV/HCs were incubated in serum-free media (SFM) at the indicated time periods. Subsequently, protein blots were probed for VDR and actin. HIV started downregulating VDR expression at 12 h thereafter (Fig. 1C).
To determine the effect of HIV on tubular cell VDR mRNA expression, C/HC, EV/HC/, and HIV/HCs were incubated in SFM for 24 h. Subsequently, total RNA was extracted and probed for VDR by real-time PCR. HIV/HC displayed attenuated VDR mRNA expression (Fig. 1D).
HIV-Induced Tubular Cell VDR Downregulation is Mediated Through ROS
To determine the role of ROS in HIV-induced modulation of VDR expression, EV/HCs, HIV/HCs, HIV/HCs + catalase (200 U) were incubated in SFM for 24 h. Subsequently, cellular lysates were probed for VDR and actin. HIV/HCs displayed attenuated expression of VDR (Fig. 2A); however, catalase completely inhibited the effect of HIV on tubular cell VDR expression. These findings indicated that HIV-induced tubular cell VDR expression was modulated by ROS.
To determine whether ROS also played a role in HIV-induced VDR transcription, C/HCs, EV/HCs, HIV/HCs, and HIV/HCs + catalase (200 U) were incubated in SFM for 24 h. Subsequently, total RNA was extracted and probed for VDR mRNA. HIV/HCs displayed attenuated (P < 0.01) VDR mRNA expression compared with C/HCs and EV/HCs (Fig. 2B). However, catalase partially (P < 0.05) inhibited this effect of HIV.
To determine the direct effect of ROS on tubular VDR expression, HCs were incubated in SFM containing variable concentrations of H2O2 (0, 25, 50, 100, 250, and 500 μM) for 12 h. Subsequently, protein blots were probed for VDR and actin. H2O2 at concentrations of 250 and 500 μM downregulated tubular cell VDR expression (Fig. 2C). These findings confirmed that ROS had a potential to downregulate tubular cell VDR expression.
VD Upregulates VDR Under Basal and HIV-Stimulated States
To determine the effect of VD on tubular cell VDR expression under basal and HIV-stimulated states, C/MCs, HV/MCs, and HIV/MCs treated with VD were labeled for VDR and then examined under an immunofluorescence microscope. Representative microphotographs are shown in Fig. 3A. C/MC displayed predominantly cytosolic expression of VDR (Fig. 3A). HIV downregulated VDR expression. C/MC treated with VD displayed predominantly nuclear VDR expression. These findings confirmed that VD activated the VDR and translocated them to the nuclear compartment to act as a transcription factor.
To confirm the effect of VD on tubular cell transcription of VDR under the HIV-stimulated state, C/MCs, EV/MCs, and HIV/MCs were incubated in media containing either buffer or VD (50 nM) for 24 h. Subsequently, total RNA was probed for VDR expression. HIV inhibited tubular cell VDR expression (Fig. 3C). However, VD enhanced tubular VDR expression under basal (P < 0.01) and HIV-stimulated (P < 0.05) states.
HIV Enhances the Tubular Cell RAS
To determine the effect of HIV on tubular cell renin expression, protein blots of C/MCs, EV/MCs, and HIV/MCs were probed for renin and actin expression. HIV/MCs exhibited higher (P < 0.01) renin expression compared with C/MCs and EV/MCs (Fig. 4A).
To evaluate whether HIV also enhances renin expression in human tubular cells, cellular lysates of C/HCs, EV/HCs, and HIV/HCs were electrophoresed and probed for renin and actin. Representative gels (from three different sets of experiments) displaying renin expression by C/HCs, EV/HCs, and HIV/HCs are shown in Fig. 4B. Cumulative data are shown in a bar diagram.
We asked whether downregulation of VDR is critical for HIV-induced tubular cell upregulation of renin. C/MCs were transfected with scrambled siRNA and siRNA VDR. Protein blots of C/MC, SCR-siRNA/MC, siRNA-VDR/MC, and HIV/MC were probed for VDR, renin, and actin. Both siRNA-VDR/MCs and HIV/MC not only displayed downregulation of VDR but also exhibited upregulation of renin (Fig. 4C). These findings indicate that there was a causal relationship between downregulation of VDR and upregulation of tubular cell renin expression.
To determine whether HIV-induced downregulation of tubular cell VDR is also associated with enhanced ANG II production and cellular lysates of C/MCs, EV/MCs, HIV/MCs, siRNA/VDR/MCs, HIV/MC+VD, and EV/MC +VD were assayed for ANG II levels by enzyme-linked immunosorbent assay. Both HIV/MC and siRNA/VDR/MCs displayed enhanced (P < 0.001) production of ANG II compared with C/MCs (Fig. 4D). However, VD partially inhibited the effect of HIV on tubular cell ANG II production.
Role of VDR and RAS in HIV-Induced ROS Generation
We have previously reported the effect of HIV on tubular cell ROS generation (39). To determine the role of ANG II in HIV-induced tubular cell ROS generation, both EV/MC and HIV/MC were treated with either buffer or losartan (10−7 M) for 24 h and then loaded with DCFDA. Subsequently, tubular cell ROS generation was measured at the indicated time periods. As shown in Fig. 5A, HIV stimulated tubular cell ROS generation; however, losartan only partially inhibited this effect of HIV.
To confirm the effect of ANG II on tubular cell ROS generation, MCs were incubated in SFM containing variable concentrations of ANG II (0, 10−10 to 10−6 M) followed by loading with DCFDA. After 30 min, ROS generation was measured at the indicated time periods. ANG II stimulated tubular cell ROS generation in a dose-dependent manner (Fig. 5B).
Because VD not only inhibited HIV-induced downregulation of tubular cell VDR but also inhibited HIV-induced tubular cell ANG II production, we hypothesized that VD would also inhibit HIV-induced ROS generation. C/MC and HIV/MCs were incubated with buffer or VD (50 nm) and then loaded with DCFDA. Subsequently, ROS generation was measured by a fluorometer. As shown in Fig. 5C, HIV stimulated tubular cell ROS generation; however, this effect of HIV was inhibited by VD.
To determine the site of ROS in the HIV milieu and its modulation by VD and ANG II blockade, both EV/MC and HIV/MC were treated with either buffer, VD (50 nM), or losartan (10−7 M) and then labeled with Red CC1 and MitoTracker green followed by fluorescence microscopy. Representative microphotographs are shown in Fig. 5D. HIV stimulated mitochondrial ROS generation, whereas both VD and losartan partially inhibited HIV-induced ROS generation (Fig. 5D).
Effect of HIV Tubular Cell DNA Damage and Repair
Because DNA is the target of ROS-induced cellular injury, we examined tubular cell DNA status in the HIV milieu. Protein blots of C/HCs, EV/HCs, and HIV/HCs were probed for phospho-yH2AX , KU-80, Rad51, and actin. HIV/HCs displayed enhanced (P < 0.01) expression of pyH2AX compared with C/HCs and EV/HCs (Fig. 6, A and B). On the other hand, HIV/HC exhibited diminished expression of KU-80 (Fig. 6, A and C). These findings indicated that HIV not only induced tubular cell DNA damage but also compromised their repair.
VD and ANG II Blockade Prevents HIV-Induced Tubular Cell DNA Damage
We hypothesized that, if VD and ANG II blockade inhibited HIV-induced tubular cell ROS generation, these strategies would also rescue tubular cells from HIV-induced tubular cell injury.
To determine the effect of VD and ANG II on HIV-induced tubular cell DNA damage, EV/HCs and HIV/HCs were colabeled with anti-H2AX and anti-KU-80 antibodies along with nuclear stain (DAPI). HIV/HCs displayed an enhanced number of double-strand DNA breaks in their nuclei compared with EV/HCs (Fig. 7A). Cumulative data (no. of H2AX foci) are shown in Fig. 7B. However, HIV/HCs displayed attenuated expression of KU-80. Cumulative data (integrated density of KU-80) are shown in Fig. 7C. On the other hand, both VD and losartan rescued tubular cells from these effects of HIV (Fig. 7, A–C).
HIV Induces Tubular Cell p53 Activation and Associated Downstream Signaling
Because DNA damage is often associated with p53 activation, we studied the effect of HIV on tubular cell phospho-p53 expression and associated downstream signaling. Protein blots of C/HCs, EV/HCs, and HIV/HCs were probed for phospho-p53, p21, Gadd45, and actin. Representative gels are shown in duplicate in Fig. 8A. HIV/HCs displayed enhanced phoshpho-p53, p21, and Gadd45. Cumulative data are shown in Fig. 8, B–D.
In Vivo Studies
Renal tissues of HIV transgenic mice display attenuated expression of VDR.
Renal cortical sections from control and Tg26 mice were labeled for VDR and examined under light microscopy (n = 3). Representative microphotographs are shown in Fig. 9A. In renal cortical sections of control mice, both podocytes and tubular cells displayed moderate staining for VDR. However, kidney cells in Tg26 mice displayed minimal staining for VDR.
Proteins were isolated from renal tissues of control and Tg26 mice (n = 3). Protein blots were probed for VDR. The same blots were reprobed for actin. Gels of protein blots of control and Tg26 mice are shown in Fig. 9B. Densitometric analysis of these gels is shown in the form of bar graphs (Fig. 9B). Renal tissues from Tg26 mice displayed attenuated (P < 0.001) expression of VDR compared with control mice.
Renal cells in HIV transgenic mice display enhanced oxidative stress-induced DNA damage.
Renal cortical sections of control and Tg26 mice were labeled for 8-OHdG (n = 3). Representative microphotographs are shown in Fig. 10A. 8-OHdG +ve nuclei were counted per glomerulus/tubule in 12 random fields of each mouse. Both glomeruli and tubules displayed a greater number of 8-OHdG +ve nuclei in Tg26 mice. Cumulative data in the form of diagrams are shown in Fig. 10B (no. of +ve nuclei/glomerulus) and Fig. 10C (no. of +ve nuclei/tubule).
DISCUSSION
The present study demonstrated that HIV downregulated tubular cell VDR; however, this effect of HIV was inhibited by catalase. Because H2O2 also downregulated tubular cell VDR, it appeared that HIV-induced downregulation of VDR was mediated through tubular cell ROS generation. HIV-induced downregulation of VDR led to the activation of the RAS and DNA damage in tubular cells. However, VD rescued tubular cell DNA damage through VDR activation in the HIV milieu. Because ANG II directly stimulated tubular cell ROS generation, and losartan inhibited HIV-induced ROS generation, it appeared that HIV-induced ROS production was also contributed partly through tubular cell ANG II generation. VD not only inhibited HIV-induced RAS activation but also attenuated tubular cell ROS generation. Tubular cells in the HIV milieu displayed double jeopardy, induction of HIV double-strand breaks and attenuated DNA repair. As expected, HIV enhanced tubular cell expression of phospho-p53, p21, and Gadd45. Because tubular cells displayed DNA damage despite activation of the p53-mediated DNA repair pathway, oxidative stress seemed to prevail in the HIV milieu. Nonetheless, both VD and ANG II blocker enhanced tubular cell expression of DNA repair protein and prevented DNA damage in the HIV milieu.
Activation of the RAS has been demonstrated to induce cellular ROS generation (17, 18). ROS causes single- and double-strand DNA breaks, purine, pyrimidine, or deoxyribose modifications, and DNA cross-links (21, 24). DNA repair further transforms these modifications to additional strand breaks. Persistence of the activation of the RAS is associated with overwhelming oxidative stress, which may lead to mutations (4). Survival of an organism depends on its capacity to repair oxidative DNA damage (6–8). The cell has two major repair mechanisms for double-strand breaks, homologous recombination and nonhomologous end joining (NHEJ) (8). Oxidative DNA damage also activates the p53 pathway to target DNA repair genes (13, 14). In the present study, HIV-infected tubular cells displayed enhanced ROS generation and increased double-strand breaks but showed diminished expression of KU-80, a DNA repair protein. These findings suggested that HIV-induced DNA injury was accompanied by a compromised DNA repair response. The net balance in between these two events might have contributed to an HIV-mediated untoward outcome. Nonetheless, DNA injury also activated the p53 pathway, which transcribed cell growth arrest genes and the DNA repair enzyme, Gadd45. These findings indicated that tubular cells in the HIV milieu had an intact p53-induced DNA repair response despite extensive DNA damage as a consequence of overwhelming oxidative stress.
VDR has been demonstrated to function as a negative regulator of the RAS (30). VDR knockout mice have been observed to develop high blood pressure and cardiac hypertrophy as a consequence of the RAS activation (31). On the same account, downregulation of VDR in unilateral ureteral obstruction (UUO) contributed to accelerated progression of renal fibrosis (50), whereas activation of VDR through a vitamin D analog provided partial protection against the development of renal fibrosis in wild animals with UUO. Similarly, in a renal ablation model, upregulation of VDR by a vitamin D analog slowed down the progression of renal lesions (11). However, it was not clear whether the renal cells had low VDR expression to begin with or mere upregulation of VDR contributed to the amelioration of renal lesions. Although the investigators highlighted the role of oxidative stress in the induction of the progression of renal injury, they did not study the relationship between ROS generation and downregulation of renal cell VDR expression. In the present study, HIV induced downregulation of VDR through ROS generation. Because the renal cell ablation model has been known to have accelerated renal cell oxidative stress (11) and activated RAS, we hypothesized that the missing link was ROS-induced downregulation of renal cell VDR. The findings in the present study suggest that HIV-induced tubular cell RAS activation was the outcome of HIV-induced ROS generation and associated downregulation of VDR; the latter further enhanced tubular cell ROS generation through the RAS activation.
NADPH oxidase 4 (NOX4) belongs to the NOX family that generates ROS in a wide variety of tissues, including kidneys (15, 28). Although the exact physiological function of Nox4 is not clear, it has been implicated as a major source of renal ROS (15, 28). In in vitro studies, NOX4-dependent ROS generation contributed to ANG II-induced hypertrophy in vascular smooth muscle cells (48); similarly, insulin-induced H2O2 production was found to be Nox4 dependent (34). In a rodent model of type I diabetes (streptozotocin-induced diabetic rats), Nox4-mediated ROS generation contributed to kidney injury (15, 28). Similarly, in a type II diabetic model, NOX4 contributed to kidney cell injury (43). In the present study, ANG II also contributed to tubular cell HIV-induced ROS generation; on that account, it is likely that ANG II-induced ROS generation might have been mediated through Nox4. Therefore, it will be important to explore the role of Nox4 in HIV-induced tubular cell ROS generation in future studies.
Renal tubular cells have been demonstrated to generate ANG II production both in in vitro and in vivo studies (9, 36). Renal tissue ANG II concentration has been reported to be several-fold greater than systemic ANG II concentration as a consequence of its production by kidney cells (38). In animal models, it was shown that the concentration of ANG II in the kidney is 25 to 1,000 times higher than in plasma (39, 44). In the present studies, ANG II enhanced ROS generation in a dose-dependent manner. Because, under pathological conditions, the ANG II concentration in the renal interstitial fluid of dogs could reach up to 800 nM (44), concentrations used in in vitro studies were physiologically relevant.
Although the activation of the RAS is reported extensively in patients with HIVAN, this is the first study showing the direct effect of HIV on tubular cell ANG II production. In the present study, HIV enhanced tubular cell ANG II production via enhanced renin expression; the latter was the outcome of HIV-induced downregulation of VDR. Because VDR is a negative regulator of renin, VD was able to inhibit HIV-induced upregulation of tubular cell renin expression and subsequent ANG II production. Thus the findings of the present study can be used for future therapeutic strategies in HIVAN patients.
GRANTS
This work was supported by National Institutes of Health Grants RO1DK084910 and RO1KD083931 (P. C. Singhal).
DISCLOSURES
No conflicts of interest, financial or otherwise, are declared by the authors.
AUTHOR CONTRIBUTIONS
Author contributions: D.S., A.S., R.G., T.S., and P.R. performed experiments; D.S., M.H., A.S., R.G., A.M., and P.C.S. approved final version of manuscript; M.H. and A.M. analyzed data; P.C.S. conception and design of research; P.C.S. edited and revised manuscript.
REFERENCES
- 1. Bird JE, Durham SK, Giancarli Gitliz PH, Pandya DG, Dambach DM, Mozes MM, Kopp JB. Captopril prevents nephropathy in HIV-transgenic mice. J Am Soc Nephrol 9: 1441– 1447, 1998 [DOI] [PubMed] [Google Scholar]
- 2. Burns GC, Paul SK, Toth IR, Sivak SL. Effect of angiotensin-converting enzyme inhibition in HIV-associated nephropathy. J Am Soc Nephrol 8: 1140– 1146, 1997 [DOI] [PubMed] [Google Scholar]
- 3. Circu ML, Aw TY. Reactive oxygen species, cellular redox systems, and apoptosis. Free Radic Biol Med 48: 749– 62, 2010 [DOI] [PMC free article] [PubMed] [Google Scholar]
- 4. Costa RA, Romagna CD, Pereira JL, Souza-Pinto NC. The role of mitochondrial DNA damage in the citotoxicity of reactive oxygen species. J Bioenerg Biomembr 43: 25– 29, 2011 [DOI] [PubMed] [Google Scholar]
- 5. Cui M, Huang Y, Zhao Y, Zheng J. Transcription factor FOXO3a mediates apoptosis in HIV-1-infected macrophages. J Immunol 180: 898– 906, 2008 [DOI] [PMC free article] [PubMed] [Google Scholar]
- 6. Dandona P, Thusu K, Cook S, Snyder B, Makowski J, Amstrong D, Nicotera T. Oxidative damage to DNAin Diabetes mellitus. Lancet 347: 444– 445, 1996 [DOI] [PubMed] [Google Scholar]
- 7. Demple B, Harrison L. Repair of oxidative damage to DNA: enzymology and biology. Annu Rev Biochem 63: 915– 948, 1994 [DOI] [PubMed] [Google Scholar]
- 8. Duthie SJ, Ma A, Ross MA, Collins AR. Antioxidant supplementation decreases oxidative DNA damage in human lymphocytes. Cancer Res 56: 1291– 1295, 1996 [PubMed] [Google Scholar]
- 9. Feliers D, Kasinath BS. Mechanism of VEGF expression by high glucose in proximal tubule epithelial cells. Mol Cell Endocrinol 314: 136– 142, 2010 [DOI] [PMC free article] [PubMed] [Google Scholar]
- 10. Fidelus RK. The generation of oxygen radicals: a positive signal for lymphocyte activation. Cell Immunol 113: 175– 182, 1990 [DOI] [PubMed] [Google Scholar]
- 11. Finch JL, Suarez EB, Husain K, Ferder L, Cardema MC, Glenn DJ, Gardner DG, Liapis H, Slatopolsky E. Effect of combining an ACE inhibitor and a VDR activator on glomerulosclerosis, proteinuria, and renal oxidative stress in uremic rats. Am J Physiol Renal Physiol 302: F141– F149, 2012 [DOI] [PubMed] [Google Scholar]
- 12. Fleet JC, Desmet M, Johnson R, Li Y. Vitamin D and cancer: a review of molecular mechanisms. Biochem J 441: 61– 76, 2012 [DOI] [PMC free article] [PubMed] [Google Scholar]
- 13. Geske FJ, Nelson AC, Lieberman R, Strange R, Sun T, Gerschenson LE. DNA repair is activated in early stage of p53-induced apoptosis. Cell Death Differ 7: 393– 401, 2000 [DOI] [PubMed] [Google Scholar]
- 14. Giaccia AJ, Kastan MB. The complexity of p53 modulation. Emerging patterns from divergent signals. Genes Dev 12: 2973– 2983, 1998 [DOI] [PubMed] [Google Scholar]
- 15. Gorin Y, Block K, Hernandez J, Bhandari B, Wagner B, Barnes JL, Abboud HE. Nox4 NAD(P)H oxidase mediates hypertrophy and fibronectin expression in the diabetic kidney. J Biol Chem 280: 39616– 39626, 2005 [DOI] [PubMed] [Google Scholar]
- 16. Gray F, Adle-Biassette H, Brion F, Ereau T, le Maner I, Levy V, Corcket G. Neuronal apoptosis in human immunodeficiency virus infection. J Neurovirol 6, Suppl 1: S38– S43, 2000 [PubMed] [Google Scholar]
- 17. Griendling KK, Minieri CA, Ollerenshaw JD, Alexander RW. Angio- tensin II stimulates NADH and NADPH oxidase activity in cultured vascular smooth muscle cells. Circ Res 74: 1141– 1148, 1994 [DOI] [PubMed] [Google Scholar]
- 18. Griendling KK, Ushio-Fukai M. Reactive oxygen species as mediators of angiotensin II signaling. Regul Pept 91: 21– 27, 2000 [DOI] [PubMed] [Google Scholar]
- 19. Gudkov AV, Komarova EA. Pathologies associated with the p53 response. Cold Spring Harb Perspect Biol 2: a001180, 2010 [DOI] [PMC free article] [PubMed] [Google Scholar]
- 20. Handy DE, Loscalzo J. Redox regulation of mitochondrial function. Antioxid Redox Signal 16: 1323– 1367, 2012 [DOI] [PMC free article] [PubMed] [Google Scholar]
- 21. Hegde ML, Hazra TK, Mitra S. Early steps in the DNA base excision/single-strand interruption repair pathway in mammalian cells. Cell Res 18: 27– 47, 2008 [DOI] [PMC free article] [PubMed] [Google Scholar]
- 22. Husain M, Meggs LG, Vashistha H, Simoes S, Griffiths KO, Kumar D, Mikulak J, Mathieson PW, Saleem MA, Del Valle L, Pina-Oviedo S, Wang JY, Seshan SV, Malhotra A, Reiss K, Singhal PC. Inhibition of p66ShcA longevity gene rescues podocytes from HIV-1-induced oxidative stress and apoptosis. J Biol Chem 284: 16648– 16658, 2009 [DOI] [PMC free article] [PubMed] [Google Scholar]
- 23. Ideura H, Hiromura K, Hiramatsu N, Shigehara T, Takeuchi S, Tomioka M, Sakairi T, Yamashita S, Maeshima A, Kaneko Y, Kuroiwa T, Kopp JB, Nojima Y. Angiotensin II provokes podocyte injury in murine model of HIV-associated nephropathy. Am J Physiol Renal Physiol 293: F1214– F1221, 2007 [DOI] [PubMed] [Google Scholar]
- 24. Imlay JA, Linn S. DNA damage and oxygen radical toxicity. Science 240: 1302– 1309, 1988 [DOI] [PubMed] [Google Scholar]
- 25. Kanmogne GD, Primeaux C, Grammas P. Induction of apoptosis and endothelin-1 secretion in primary human lung endothelial cells by HIV-1 gp120 proteins. Biochem Biophys Res Commun 333: 1107– 1115, 2005 [DOI] [PubMed] [Google Scholar]
- 26. Kapasi AA, Fan S, Singhal PC. p300 modulates HIV-1 gp120-induced apoptosis in human proximal tubular cells: associated with alteration of TGF-beta and Smad signaling. Nephron Exp Nephrol 102: e30– e38, 2006 [DOI] [PubMed] [Google Scholar]
- 27. Kumar D, Salhan D, Magoon S, Torri DD, Sayeneni S, Sagar A, Bandhlish A, Malhotra A, Chander PN, Singhal PC. Adverse host factors exacerbate occult HIV-associated nephropathy. Am J Pathol 179: 1681– 92, 2011 [DOI] [PMC free article] [PubMed] [Google Scholar]
- 28. Kuroda J, Sumimoto H, Nawata H. Increased expression of NAD(P)H oxidase subunits, NOX4 and p22phox, in the kidney of streptozotocin-induced diabetic rats and its reversibility by interventive insulin treatment. Diabetologia 46: 1428– 1437, 2003 [DOI] [PubMed] [Google Scholar]
- 29. Lake JE, Adams JS. Vitamin D in HIV-infected patients. Curr HIV/AIDS Rep 8: 133– 141, 2011 [DOI] [PMC free article] [PubMed] [Google Scholar]
- 30. Li YC, Kong J, Wei M, Chen ZF, Liu SQ, Cao LP. 1,25-Dihydroxyvitamin D(3) is a negative endocrine regulator of the renin-angiotensin system. J Clin Invest 110: 229– 238, 2002 [DOI] [PMC free article] [PubMed] [Google Scholar]
- 31. Li YC, Qiao G, Uskokovic M, Xiang W, Zheng W, Kong J. Vitamin D: a negative endocrine regulator of the renin-angiotensin system and blood pressure. J Steroid Biochem Mol Biol 89–90: 387– 392, 2004 [DOI] [PubMed] [Google Scholar]
- 32. Liu D, Xu Y. p53, oxidative stress, aging. Antioxid Redox Signal 15: 1669– 1678, 2011 [DOI] [PMC free article] [PubMed] [Google Scholar]
- 33. Lonkar P, Dedon PC. Reactive species and DNA damage in chronic inflammation: reconciling chemical mechanisms and biological fates. Int J Cancer 128: 1999– 2009, 2011 [DOI] [PMC free article] [PubMed] [Google Scholar]
- 34. Mahadev K, Motoshima H, Wu X, Ruddy JM, Arnold RS, Cheng G, Lambeth JD, Goldstein BJ. The NAD(P)H oxidase homolog Nox4 modulates insulin-stimulated generation of H2O2 and plays an integral role in insulin signal transduction. Mol Cell Biol 24: 1844– 1854, 2004 [DOI] [PMC free article] [PubMed] [Google Scholar]
- 35. Medapalli RK, He JC, Klotman PE. HIV-associated nephropathy: pathogenesis. Curr Opin Nephrol Hypertens 20: 306– 311, 2011 [DOI] [PMC free article] [PubMed] [Google Scholar]
- 36. Mikulak J, Singhal PC. HIV-1 and kidney cells: better understanding of viral interaction. Nephron Exp Nephrol 115: e15– e21, 2010 [DOI] [PMC free article] [PubMed] [Google Scholar]
- 37. Moore LE, Wilson RT, Campleman SL. Lifestyle factors, exposures, genetic susceptibility, and renal cell cancer risk: a review. Cancer Invest 23: 240– 255, 2005 [DOI] [PubMed] [Google Scholar]
- 38. Nabel GE, Baltimore D. An inducible transcription factor activates expression of human immunodeficiency virus in T-cells. Nature 326: 711– 713, 1987 [DOI] [PubMed] [Google Scholar]
- 39. Navar LG, Mitchell KD. Proximal tubular fluid angiotensin II levels in angiotensin II-induced hypertensive rats. J Hypertens 21: 353– 360, 2003 [DOI] [PubMed] [Google Scholar]
- 40. Perry SW, Norman JP, Litzburg A, Zhang D, Dewhurst S, Gelbard HA. HIV-1 transactivator of transcription protein induces mitochondrial hyperpolarization and synaptic stress leading to apoptosis. J Immunol 174: 4333– 4344, 2005 [DOI] [PubMed] [Google Scholar]
- 41. Poulsen HE, Prieme H, Loft S. Role of oxidative DNA damage in cancer initiation and promotion. Eur J Cancer Prev 7: 9– 16, 1998 [PubMed] [Google Scholar]
- 42. Salhan D, Pathak S, Husain M, Tandon P, Kumar D, Malhotra A, Meggs LG, Singhal PC. HIV gene expression deactivates redox-sensitive stress response program in mouse tubular cells both in vitro and in vivo. Am J Physiol Renal Physiol 302: F129– F140, 2012 [DOI] [PMC free article] [PubMed] [Google Scholar]
- 43. Sedeek M, Callera G, Montezano A, Gutsol A, Heitz F, Szyndralewiez C, Page P, Kennedy CRJ, Burns KD, Touyz RM, Hébert RL. Critical role of Nox4-based NADPH oxidase in glucose-induced oxidative stress in the kidney: implications in type 2 diabetic nephropathy. Am J Physiol Renal Physiol 299: F1348– F1358, 2010 [DOI] [PubMed] [Google Scholar]
- 44. Siragy HM, Howell NL, Ragsdale NV, Carey RM. Renal interstitial fluid angiotensin. Modulation by anesthesia, epinephrine, sodium deple- tion, and renin inhibition. Hypertension 25: 1021– 1024, 1995 [DOI] [PubMed] [Google Scholar]
- 45. Snyder A, Alsauskas ZC, Leventhal JS, Rosenstiel PE, Gong P, Chan JJ, Barley K, He JC, Klotman ME, Ross MJ, Klotman PE. HIV-1 viral protein r induces ERK and caspase-8-dependent apoptosis in renal tubular epithelial cells. AIDS 24: 1107– 1119, 2010 [DOI] [PMC free article] [PubMed] [Google Scholar]
- 46. Staal FJT, Roederer M, Herzenberg LA. Intracellular thiols regulate activation of nuclear factor kB transcription factor. Cell 53: 211– 217, 1988 [DOI] [PMC free article] [PubMed] [Google Scholar]
- 47. Stephensen CB, Marquis GS, Douglas SD, Wilson CM. Immune activation and oxidative damage in HIV-positive and HIV-negative adolescents. J Acquir Immune Defic Syndr 38: 180– 190, 2005 [DOI] [PubMed] [Google Scholar]
- 48. Touyz RM, Schiffrin EL. Ang II stimulated superoxide production is mediated via phospholipase D in human vascular smooth muscle cells. Hypertension 34: 976– 982, 1999 [DOI] [PubMed] [Google Scholar]
- 49. van Grevenynghe J, Procopio FA, He Z, Chomont N, Riou C, Zhang Y, Gimmig S, Boucher G, Wilkinson P, Shi Y, Yassine-Diab B, Said EA, Trautmann L, El Far M, Balderas RS, Boulassel MR, Routy JP, Haddad EK, Sekaly RP. Transcription factor FOXO3a controls the persistence of memory CD4(+) T cells during HIV infection. Nat Med 14: 266– 274, 2008 [DOI] [PubMed] [Google Scholar]
- 50. Zhang Y, Kong J, Deb DK, Chang A, Li YC. Vitamin D receptor attenuates renal fibrosis by suppressing the renin-angiotensin system. J Am Soc Nephrol 21: 966– 967, 2010 [DOI] [PMC free article] [PubMed] [Google Scholar]