

Abstract
Objective
To analyze the extent and spatial distribution of white matter hyperintensities (WMH) in brain regions from cognitively normal older individuals (CN) and patients with mild cognitive impairment (MCI) and Alzheimer disease (AD).
Methods
We studied 26 mild AD, 28 MCI, and 33 CN. MRI analysis included quantification of WMH volume, nonlinear mapping onto a common anatomic image, and spatial localization of each WMH voxel to create an anatomically precise frequency distribution map. Areas of greatest frequency of WMH from the WMH composite map were used to identify 10 anatomic regions involving periventricular areas and the corpus callosum (CC) for group comparisons.
Results
Total WMH volumes were associated with age, extent of concurrent vascular risk factors, and diagnosis. After correcting for age, total WMH volumes remained significantly associated with diagnosis and extent of vascular risk. Regional WMH analyses revealed significant differences in WMH across regions that also differed significantly according to diagnosis. In post-hoc analyses, significant differences were seen between CN and AD in posterior periventricular regions and the splenium of the CC. MCI subjects had intermediate values at all regions. Repeated measures analysis including vascular risk factors in the model found a significant relationship between periventricular WMH and vascular risk that differed by region, but regional differences according to diagnosis remained significant and there was no interaction between diagnosis and vascular risk.
Conclusions
Differences in white matter hyperintensities (WMH) associated with increasing cognitive impairment appear related to both extent and spatial location. Multiple regression analysis of regional WMH, vascular risk factors, and diagnosis suggest that these spatial differences may result from the additive effects of vascular and degenerative injury. Posterior periventricular and corpus callosum extension of WMH associated with mild cognitive impairment and Alzheimer disease indicate involvement of strategic white matter bundles that may contribute to the cognitive deficits seen with these syndromes.
White matter hyperintensities (WMH) are areas of increased signal on T2-weighted and fluid-attenuated inversion recovery (FLAIR) MRI sequences of the brain. The extent of WMH is associated with increasing age,1,2 vascular risk factors,3,4 mild cognitive impairment (MCI),5,6 and dementia.7,8 WMH may also increase the likelihood of progression from MCI to dementia8,9 and are associated with reduced performance on several neuropsychological tasks in patients with Alzheimer disease (AD).10–12
Debate persists, however, regarding differences in the extent and regional distribution of WMH between cognitively normal older individuals (CN) and those with MCI or AD. A number of studies distinguish periventricular from deep white matter WMH and show differences in vascular risk factors and cognitive impact,13–15 although it has been argued that such anatomic distinctions may have limitations.16 Studies examining lobar distributions of WMH generally find greater extent of WMH in anterior regions, particularly among CN,17–19 although this is not uniformly true.20
In this study, we applied image segmentation and nonlinear image mapping techniques to determine the extent and spatial location of WMH among CN, MCI, and AD. We then tested whether differences in anatomic distribution were associated with cognitive status and vascular risk.
Methods
Subjects
Subjects include 26 patients with clinical diagnosis of possible or probable AD (age range: 62 to 93, 79.6 ± 6.8 years old), 28 patients with MCI (age range: 60 to 88, 74.8 ± 8.2 years old), and 33 CN subjects (age range: 61 to 91, 73.4 ± 8.1 year old). Demographic data for each group are summarized in the table. The AD group consisted of 17 patients with probable AD, 4 patients with possible AD, and 5 patients with AD and sufficient cerebrovascular disease for the diagnosis of mixed dementia. The MCI group consisted of 7 amnestic type, 17 multiple cognitive domains type, and 4 single nonmemory type (85.7% of patients with MCI have memory impairment). No patient, however, had clinical stroke. The diagnosis of AD was made according to the National Institute of Neurological and Communication Disorders and Stroke/Alzheimer’s Disease and Related Disorders Association criteria.21 The diagnosis of mixed dementia was according to the criteria of the State of California Alzheimer’s Disease Diagnostic and Treatment Centers.22 MCI was diagnosed according to current consensus criteria.23
Participants were recruited from the Alzheimer’s Disease Center at the University of California, Davis. All participants received a comprehensive clinical evaluation that included a medical history, a neurologic examination, appropriate laboratory tests, and neuropsychological testing with a standardized test battery that included the Mini-Mental State Examination (MMSE)24 and the Clinical Dementia Rating Scale (CDR).25,26 The CDR score was determined independently of neuropsychological information according to published protocol. In addition, participants received a standardized MRI scan of the brain at the baseline evaluation.
The institutional review boards at all participating institutions approved this study, and subjects or their legal representatives gave written informed consent.
Vascular risk factors
The presence or absence of six cerebrovascular risk factors (i.e., stroke, diabetes, hyperlipidemia, TIA, hypertension, and coronary artery disease) was systematically assessed for subject and informant histories as well as review of pertinent medical records to create a composite score that was the sum of the factors present ranging from 0 to 627 and reported as a percentage.
Image acquisition and mapping
MRI sequences
All brain imaging was obtained at the University of California at Davis Imaging Research Center on a 1.5 T GE Signa Horizon LX Echospeed system. Two sequences were employed: a T1-weighted coronal three-dimensional spoiled gradient-recalled echo acquisition and a FLAIR sequence designed to enhance WMH segmentation.28
WMH segmentation
Segmentation of WMH was performed by a semiautomated procedure using a set of in-house computer algorithms and programs previously described.16
T1 image correction and mapping
The method of T1 image correction and mapping has been previously described.16 In this process, WMH segmentation is used to create a mask image indicating the location of each WMH voxel for mapping into the common anatomic space that occurs as follows: 1. Affine coregistration of the FLAIR image to the high-resolution T1 image using a six-parameter transformation.29 2. Correct intensity changes in the T1 image in areas of WMH to reduce adverse impact of the WMH voxel values on the accuracy of the nonlinear warping algorithm. This involved estimating the mean of normal white matter voxel intensities surrounding voxels identified as WMH through FLAIR segmentation and replacing voxels in the T1 corresponding to WMH found in the FLAIR image by the estimate of the normal white matter intensity. 3. Spatial normalization of the coregistered FLAIR and T1 onto a minimal deformation template (MDT).30 This type of image is created to minimize the amount of distortion necessary to nonlinearly align each subject MRI of the study. Spatial normalization consisted of a high-dimensional cubic B-spline warp of the template onto each subject.31 The parameters computed from this alignment were then used to inverse-warp each subject T1 image onto the MDT. In addition, the accompanying FLAIR image and WMH mask for each subject were also transformed onto the MDT. 4. After transformation of each image using the warping parameters, the coordinates of each WMH voxel for each subject were computed with respect to the MDT. This information was then used to create a composite map that displayed the frequency of WMH at every voxel location in the MDT. MDT coordinates were also converted into MNI coordinates using the Montreal Neurologic Institute (MNI) template32 for further anatomic localization.
Image analysis
Image analysis consisted of two major components. The first was to create a WMH frequency distribution map for each group. Voxel intensity values of the group composite maps indicated the frequency of WMH for that group at each location within the MDT image. The WMH frequency maps thus serve as a measure of intersubject variability and relative WMH lesion load for each group at each anatomic location. The color-coded composite frequency map in MNI anatomic space for all subjects is shown in figure 1. Second, specific regions of interest (ROIs) defined by the areas of greatest frequency on the MDT template were created. The ROIs were of variable size (205 to 3,190 mm3), depending on the anatomic region studied. ROIs were placed at eight locations in each hemisphere, as well as the genu and splenium of the corpus callosum (CC). Figure 2 is a graphic representation of these ROIs. Group differences within the various ROIs were compared as a percentage of the size of each ROI (e.g., if an ROI contained 100 voxels and 50 were WMH, then the value for that ROI of that subject would be 0.5). In addition, we divided the subjects into quartiles of MMSE scores (the first quartile [n = 19]: MMSE 0 to 24; the second quartile [n = 24]: MMSE 25 to 27; the third quartile [n = 12]: MMSE 28; the fourth quartile [n = 22]: MMSE 29 to 30) to assess the distribution of WMH in a continuous fashion with a measure of global cognitive ability. To avoid the confounding of education on MMSE score, we eliminated nine subjects without formal education from this analysis.
Figure 1.

Composite white matter hyperintensity (WMH) frequency maps for all study subjects in anatomic Montreal Neurologic Institute reference space. Orange color indicates voxels containing WMH with a frequency of more than 10%; yellow color indicates a frequency of more than 50%.
Figure 2.
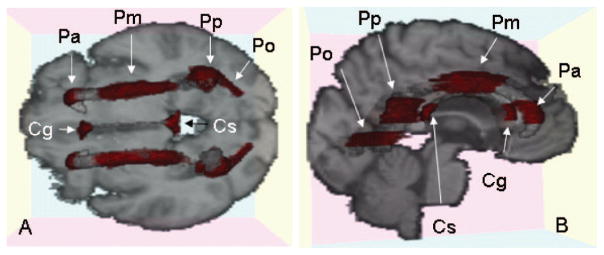
Graphical display of 10 regions of interest (ROIs) overlaid on the target image. (A) Axial slice; (B) slightly oblique view of sagittal slice. Red areas indicate each ROI. Cg = genu of corpus callosum; Cs = splenium of corpus callosum; Pa = anterior periventricular region; Pm = middle of periventricular region; Pp = posterior periventricular region; Po = occipital periventricular region.
Statistical analysis
Data were analyzed using JMP, version 5.1.2 (SAS Institute, Cary, NC) and SAS version 9.1. For group analysis, total WMH volumes were log transformed to normalize variance. Group differences on demographic data were compared using analysis of variance with post-hoc pairwise comparisons using Tukey method for multiple comparison corrections, Mann–Whitney U, or Kruskal–Wallis tests as appropriate according to the distribution of the data. Correlations were evaluated by a Pearson correlation test. Results are expressed as means ± SD. Multiple regression models adjusted for vascular risk factors were used for analysis of group differences on total WMH volumes. Analyses were run separately for the composite risk factor score and hypertension. Repeated measure analysis of variance was used to study differences in regional WMH in relation to diagnosis and vascular risk. Post-hoc comparisons within regions were tested, and significance was adjusted for multiple comparisons using the Bonferroni correction. Values with p < 0.05 were regarded as significant.
Results
Subject characteristics
Differences in subject characteristics are summarized in the table. Hippocampal data from three patients with AD and two patients with MCI and vascular risk factors for one MCI patient were not available.
Group differences were found with regard to age (F = 4.94, p < 0.01), brain volume (F = 14.8, p < 0.001), hippocampal volume (F = 11.7, p < 0.001), WMH volume (F = 6.42, p < 0.003), and MMSE score (F = 32.8, p < 0.0001), but not educational achievement, number of vascular risk factors, or hypertension. Female subjects were overrepresented in the AD and CN groups. Post-hoc analysis of mean differences between groups found that AD patients differed significantly from the other two groups with regard to MMSE. CN and MCI differed from AD with regard to brain volume, and the two cognitively impaired groups had significantly smaller hippocampi than the CN subjects. Patients with AD differed from CN subjects with regard to WMH volume and age.
Group differences in total WMH and vascular risk
As expected from previous studies,2 log-transformed total WMH volume was correlated with age among the CN subjects (R2 = 0.16, p < 0.03). To examine the impact of diagnosis, vascular risk, and hypertension on WMH volumes, an age-corrected WMH volume was therefore calculated for each subject based on age-expected measures from the CN. Multiple regression analysis of the age-corrected total WMH volumes revealed differences related to diagnosis and extent of vascular risk (F = 4.43, p < 0.007 total model; F = 4.08, p < 0.03 for diagnosis; and F = 5.44, p < 0.03 for vascular risk). Multiple regression analysis of age-corrected WMH volumes also revealed differences related to diagnosis and extent of hypertension (F = 8.32, p < 0.001 total model; F = 3.79, p < 0.03 for diagnosis; and F = 15.7, p < 0.0001 for hypertension).
Regional WMH
Correlation with total WMH
Pairwise correlations between age-corrected regional WMH and log-transformed total WMH as well as between each of the various regions were all significant with correlation coefficients ranging from 0.38 to 0.83 (p < 0.0001 for all comparisons).
Diagnostic category
Visual inspection of the WMH composite map (figure 1) reveals that the extent of WMH was greatest for the periventricular areas. Further inspection of WMH distributions according to diagnostic category also reveals an anterior to posterior gradient of periventricular WMH in association with increasing cognitive impairment (figure 3). Moreover, WMH were more commonly located in the genu and splenium of the CC among the cognitively impaired individuals, particularly the AD group.
Figure 3.
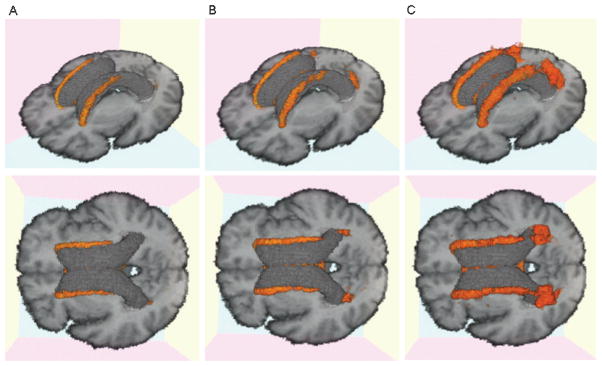
Three-dimensional white matter hyperintensity (WMH) frequency maps for each cognitive group displayed in two separate orientations for enhanced visualization. (A) Cognitively normal older individuals (CN); (B) mild cognitive impairment (MCI); (C) Alzheimer disease (AD). Orange area indicates voxels containing WMH with a frequency of 10% or higher.
Quantitative analyses using repeated measures analysis of variance with regional WMH as the repeated measure showed a effect of region (F = 6.7, p < 0.001), and diagnosis (F = 4.4, p < 0.02) as well as a interaction between diagnosis and region (F = 2.4, p < 0.02). Post-hoc analysis found regional differences by diagnostic category between AD and CN in the posterior ROI (p < 0.004) and the splenium of the CC (p < 0.0001) (figure 4).
Figure 4.
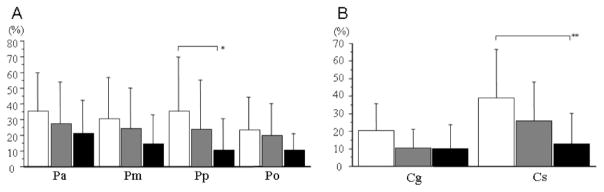
Graphic displays of mean white matter hyperintensity (WMH) for periventricular regions and corpus callosum according to diagnostic group. (A) Periventricular regions; (B) corpus callosum. White columns = patients with Alzheimer disease (AD); gray columns = patients with mild cognitive impairment (MCI); black column = cognitively normal (CN) older subjects. Error bars indicate SD. *p < 0.004, **p < 0.0001, when comparing AD with CN.
Vascular risk
Repeated measure analysis of variance with regional WMH as the repeated measure showed a main effect of region (F = 2.8, p < 0.03) and a region by vascular risk interaction (F = 3.2, p < 0.02).
Hypertension
Repeated measure analysis of variance with regional WMH as the repeated measure showed a main effect of region (F = 4.0, p < 0.003) and a region by hypertension status interaction (F = 4.2, p < 0.003). Post-hoc analyses found regional differences with greater WMH in association with hypertension for each of the periventricular ROIs (anterior, p < 0.01; middle, p < 0.0005; and posterior, p < 0.0001), but not the occipital or CC ROIs (figure 5). The accompanying axial image shows a slice of the MDT with color-coded frequency maps (thresholded at 10%) of CN with no hypertension (red–yellow palette) and CN with hypertension (green palette) overlaid. Where the red and green maps share a voxel, red overwrites the green. Inspection of these maps shows the greater extent of WMH in the hypertensive group.
Figure 5.
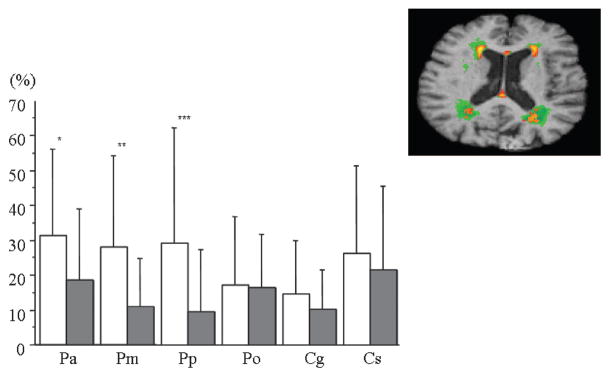
Graph displays of mean white matter hyperintensity (WMH) for each region of interest comparing subjects with to those without hypertension. White columns = subjects with hypertension; gray columns = subjects without hypertension. Error bars indicate SD. *p < 0.01, **p < 0.0005, ***p < 0.0001. (Top right) Two-dimensional axial slice of WMH having a frequency of 10% or higher for subjects with and without hypertension. Green = subjects with hypertension; orange–yellow = subjects without hypertension.
Diagnosis and vascular risk interactions
Repeated measure analysis of variance with regional WMH as the repeated measure evaluating the three-way interaction between region, vascular risk, and diagnosis was also performed. There was a main effect for region (F = 3.0, p < 0.02), a region by vascular risk interaction (F = 3.3, p < 0.01), and a region by diagnosis interaction (F = 2.2, p < 0.02), but not a significant region by vascular risk by diagnosis interaction.
Similar three-way interaction repeated measure analysis of variance with hypertension alone as the vascular risk factor also showed a main effect by region (F = 5.3, p < 0.005), a region by hypertension status interaction (F = 4.1, p < 0.003), and a region by diagnosis interaction (F = 1.9, p < 0.05), but no significant region by hypertension by diagnosis interaction.
Global cognitive measure
A second analysis of WMH distribution using quartiles of MMSE as a measure of global cognition (figure 6) reveals a similar pattern of rostral–caudal distribution of WMH to that seen in figure 3, suggesting that this effect is not strictly determined by diagnostic categorization.
Figure 6.
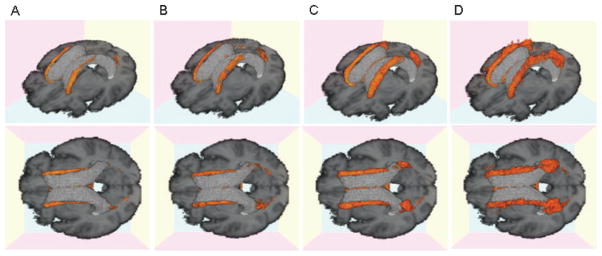
Three-dimensional white matter hyperintensity (WMH) frequency maps for each cognitive group. (A) First quartile Mini-Mental State Examination (MMSE) 29 to 30; (B) second quartile, MMSE 28; (C) third quartile, MMSE 25 to 27; (D) fourth quartile MMSE 0 to 24. Orange area indicates voxels containing WMH with a frequency of 10% or higher.
Discussion
Our results are consistent with previous studies showing that WMH are common to the periventricular area of CN and cognitively impaired individuals.19,33–36 WMH were also most prevalent in frontal areas of CN,8 whereas more posterior regions and the CC were minimally affected (figure 4). Similar to others, we also found that the overall burden of WMH was increased with both vascular risk and the degree of cognitive impairment.5,6,8 Moreover, subjects with MCI had a periventricular WMH burden intermediate in extent and location between CN and AD, suggesting that increasing expansion of periventricular WMH may also be common to this transition phase between normal cognition and AD. Finally, we found differences in the associations between regional WMH, vascular risk factors, and degree of cognitive impairment, suggesting that regional differences in WMH may result from the additive effects of vascular and neurodegenerative injuries.
The periventricular location of WMH seen in our study is consistent with current concepts of WMH pathology. Although some controversy remains,37 there is general consensus for a single vascular white matter watershed area extending between 3 and 13 mm from the ventricular surface,38–40 which is believed to make this area prone to ischemia and may explain in part how vascular risk factors might contribute to later life cognitive impairment and dementia.41 The significant correlation between extent of vascular risk, hypertension, and age-corrected periventricular WMH among the three groups supports this notion. This does not, however, explain differences in rostral–caudal gradient associated with increasing cognitive impairment. In a previous report using similar methods,16 we found increased extension of periventricular WMH in association with increasing amounts of total WMH volume, but this effect was seen uniformly about the periventricular areas, qualitatively different from the rostral–caudal gradient seen here. This raises the possibility that WMH may have multiple etiologies.
In this study, we also examine the extent and distribution of WMH within the CC of CN, MCI, and AD subjects. The CC, one of the most heavily myelinated regions of the brain, consists of fibers arising from large pyramidal neurons in layers III and V and is topographically organized, with the anterior portion containing axons of corticocortical communicating fibers from homologous anterior lobar brain regions and the posterior portion containing fibers from homologous posterior lobar regions.42,43 Studies of CC in normal subjects reveal a trend for greater atrophy in anterior than posterior CC regions.44–48 In contrast, early-stage AD may differentially affect posterior regions of the CC.49 The temporal–parietal association cortices are affected by AD prior to other neocortical sites.50 As the splenium of the CC contains fibers from these regions, it would also be expected to be affected early in the AD process. Previous reports have noted atrophy of posterior CC regions in early AD51 that may be similar in magnitude to medial temporal atrophy at this stage.52 Later stages of AD include more widespread effects50 including involvement of anterior portions of the CC.51,53–55 Postmortem studies confirm atrophy of the anterior CC and a smaller diameter of nerve fibers in patients with severe AD pathology as compared with controls.56 Involvement of the splenium of the CC with dementia is consistent with our WMH data where the WMH of the splenium were increased for the AD group. These observations suggest that WMH in CC may be a marker for the loss of cortical–cortical neurons commonly affected by aging and AD.
Alternatively, ischemia could play a role in CC WMH. Our observations of increased CC WMH localized to the midposterior portion of the genu and midanterior portion of the splenium of the CC are similar to another report of an older population where ischemia was the proposed etiology.57 We also found strong correlations between CC WMH and total WMH volume, suggesting that they might share the same etiology, consistent with the previous report as well.57 The inferior surface of CC represents a terminal zone of the penetrating arteries and is therefore vulnerable to ischemic changes. Moreover, the midanterior surface of the splenium abuts the cistern of the velum interpositum and lacks ependymal coverage58,59 that may contribute to the development of WMH in the CC. As with the periventricular WMH, however, a purely vascular etiology for the CC WMH would not explain differences in splenium WMH associated with an AD diagnosis that were absent in genu of the CC, and no significant differences in splenium WMH were found when analyzing the effects of vascular risk and hypertension.
Convergent findings of increased WMH in posterior periventricular and splenium ROIs in relation to cognitive status strongly suggest a degenerative role or more likely an interaction with vascular disease as the etiology of these differences. This hypothesis is strengthened by the multivariate analysis that shows independent effects of vascular risk and diagnosis on WMH ROIs. Vascular risk factors, particularly hypertension, appear to exert an effect restricted to the periventricular area (although the impact of hypertension was greatest in the posterior region where normal aging effects are least, as shown in figures 4 and 5), whereas the impact of diagnosis appears to be significantly related to posterior white matter tracts closely associated with the parietal degeneration of AD.49–52 It is tempting to speculate from these data that AD pathology could make posterior white matter tracts more vulnerable to ischemic factors, resulting in the regional specificity seen with our results.
Because of a number of limiting factors, these results should be interpreted cautiously. First, this is a cross-sectional study in a population that included individuals referred to or recruited from our memory disorders clinic and is therefore not truly representative of the general population. The WMH map and patterns of WMH with each population, however, do not differ substantially from those reported by others.19,20,33 Second, our sample included individuals with modest degrees of concurrent CVD and ischemic vascular risk factors. Individuals with cortical infarction, however, were excluded from the analysis, and vascular risk factors—although significantly associated with total WMH volume— did not differ among the groups. The findings of significant atrophy of both brain and hippocampus among the three groups further supports the notion that AD was the predominant disease process in the dementia group.
We believe that our newly developed method of WMH mapping reveals differences in WMH associated with increasing cognitive impairment that appear related to extent, spatial location, and possibly differential etiology. The results also strongly suggest the vascular disease affects white matter tracts differently than AD degeneration with the potential consequence that vascular factors may interact additively with AD to increase the likelihood of clinically expressed cognitive impairment. Future longitudinal studies measuring the evolution of regional WMH within each individual will be necessary to test this hypothesis more directly.
Table.
Subject demographics
| CN | MCI | AD | p Value | |
|---|---|---|---|---|
| No. (F/M) | 33 (23/10) | 28 (11/17) | 26 (16/10) | — |
| Age, y | 73.4 ± 8.1 (61–91) | 74.8 ± 8.2 (60–88) | 79.6 ± 6.8 (63–93) | <0.01* |
| Education, y | 10.9 ± 5.8 (0–20) | 12.5 ± 5.4 (0–21) | 11.7 ± 5.2 (0–18) | NS |
| MMSE | 27.9 ± 2.7 (19–30) | 26.8 ± 1.9 (21–30) | 19.5 ± 6.8 (0–27) | <0.0001† |
| Vascular risk score, % | 27 ± 23 (0–80) | 22 ± 20 (0–75) | 27 ± 22 (0–67) | NS |
| Hypertension, yes/no | 20/13 | 17/10 | 18/8 | NS |
| Brain vol., % TCV | 83.3 ± 4.3 | 80.8 ± 4.2 | 77.3 ± 4.2 | <0.001† |
| WMH vol., % TCV§ | −1.04 ± 0.89 | −0.57 ± 1.09 | −0.13 ± 0.93 | <0.005* |
| HC vol., % TCV | 0.35 ± 0.05 | 0.31 ± 0.05 | 0.28 ± 0.06 | <0.001‡ |
Data presented as means ± SD. MRI volume measures corrected for head size (% TCV). Values in parentheses indicate range. Post-hoc comparison of significant group differences:
CN vs AD,
CN and MCI vs AD,
CN vs MCI and AD.
Log transformed to normalize variance.
CN = cognitive normal older individuals; MCI = mild cognitive impairment; AD = Alzheimer disease; MMSE = Mini-Mental State Examination; WMH = white matter hyperintensities; HC = hippocampus; TCV = total cranial volume.
Acknowledgments
Supported in part by NIH grants P30 AG10129, R01 AG021028, and R01 AG10220.
The authors thank the research participants and supporting staff who made this research possible.
Footnotes
Disclosure: The authors report no conflicts of interest.
References
- 1.Chirtiansen P, Larsson HB, Thomsen C, et al. Age dependent white matter lesions and brain volume changes in healthy volunteers. Acta Radiol. 1994;35:117–122. [PubMed] [Google Scholar]
- 2.DeCarli C, Massaro J, Harvey D, et al. Measures of brain morphology and infarction in the Framingham Heart Study: establishing what is normal. Neurobiol Aging. 2005;26:491–510. doi: 10.1016/j.neurobiolaging.2004.05.004. [DOI] [PubMed] [Google Scholar]
- 3.Bretler MMV, van Swieten JC, Bots ML, et al. Cerebral white matter lesions, vascular risk factors, and cognitive function in a population-based study: the Rotterdam Study. Neurology. 1994;44:1246–1252. doi: 10.1212/wnl.44.7.1246. [DOI] [PubMed] [Google Scholar]
- 4.Jeerakathil T, Wolf PA, Beiser A, et al. Stroke risk profile predicts white matter hyperintensity volume: the Framingham Study. Stroke. 2004;35:1857–1861. doi: 10.1161/01.STR.0000135226.53499.85. [DOI] [PubMed] [Google Scholar]
- 5.DeCarli C, Miller BL, Swan GE, et al. Cerebrovascular and brain morphologic correlates of mild cognitive impairment in the National Heart, Lung, and Blood Institute Twin Study. Arch Neurol. 2001;58:643–647. doi: 10.1001/archneur.58.4.643. [DOI] [PubMed] [Google Scholar]
- 6.Lopez OL, Jagust WJ, Dulberg C, et al. Risk factors for mild cognitive impairment in the Cardiovascular Health Study Cognition Study: part 2. Arch Neurol. 2003;60:1394–1399. doi: 10.1001/archneur.60.10.1394. [DOI] [PubMed] [Google Scholar]
- 7.Elias MF, Sullivan LM, D’Agostino RB, et al. Framingham stroke risk profile and lowered cognitive performance. Stroke. 2004;35:404–409. doi: 10.1161/01.STR.0000103141.82869.77. [DOI] [PubMed] [Google Scholar]
- 8.Wu CC, Mungas D, Petkov CI, et al. Brain structure and cognition in a community sample of elderly Latinos. Neurology. 2002;59:383–391. doi: 10.1212/wnl.59.3.383. [DOI] [PubMed] [Google Scholar]
- 9.Wolf H, Ecke GM, Bettin S, Dietrich J, Gertz HJ. Do white matter changes contribute to the subsequent development of dementia in patient with mild cognitive impairment? A longitudinal study. Int J Geriatr Psychiatry. 2000;15:803–812. doi: 10.1002/1099-1166(200009)15:9<803::aid-gps190>3.0.co;2-w. [DOI] [PubMed] [Google Scholar]
- 10.Kertesz A, Polk M, Carr T. Cognition and white matter changes on magnetic resonance imaging in dementia. Arch Neurol. 1990;47:387–391. doi: 10.1001/archneur.1990.00530040029015. [DOI] [PubMed] [Google Scholar]
- 11.Bondareff W, Raval J, Colletti PM, et al. Quantitative magnetic resonance imaging and the severity of dementia in Alzheimer’s disease. Am J Psychiatry. 1988;145:853–856. doi: 10.1176/ajp.145.7.853. [DOI] [PubMed] [Google Scholar]
- 12.Burns JM, Church JA, Johnson DK, et al. White matter lesions are prevalent but differentially related with cognition in aging and early Alzheimer disease. Arch Neurol. 2005;62:1870–1876. doi: 10.1001/archneur.62.12.1870. [DOI] [PubMed] [Google Scholar]
- 13.Breteler MM, van Amerongen NM, van Swieten JC, et al. Cognitive correlates of ventricular enlargement and cerebral white matter lesions on MRI: the Rotterdam Study. Stroke. 1994;25:1109–1115. doi: 10.1161/01.str.25.6.1109. [DOI] [PubMed] [Google Scholar]
- 14.de Groot JC, de Leeuw FE, Breteler MM. Cognitive correlates of cerebral white matter changes. J Neural Transm (Suppl) 1998;53:41–67. doi: 10.1007/978-3-7091-6467-9_5. [DOI] [PubMed] [Google Scholar]
- 15.Claus JJ, Breteler MM, Hasan D, et al. Vascular risk factors, atherosclerosis, cerebral white matter lesions and cerebral perfusion in a population-based study. Eur J Nucl Med. 1996;23:675–682. doi: 10.1007/BF00834530. [DOI] [PubMed] [Google Scholar]
- 16.DeCarli C, Fletcher E, Ramey V, Harvey D, Jagust WJ. Anatomical mapping of white matter hyperintensities (WMH): exploring the relationships between periventricular WMH, deep WMH, and total WMH burden. Stroke. 2005;36:50–55. doi: 10.1161/01.STR.0000150668.58689.f2. [DOI] [PMC free article] [PubMed] [Google Scholar]
- 17.Tullberg M, Fletcher E, DeCarli C, et al. White matter lesions impair frontal lobe function regardless of their location. Neurology. 2004;63:246–253. doi: 10.1212/01.wnl.0000130530.55104.b5. [DOI] [PMC free article] [PubMed] [Google Scholar]
- 18.Wahlund LO, Basun H, Almkvist O, Andersson-Lundman G, Julin P, Saaf J. White matter hyperintensities in dementia: does it matter? Magn Res Imag. 1994;12:387–394. doi: 10.1016/0730-725x(94)92531-3. [DOI] [PubMed] [Google Scholar]
- 19.Wen W, Sachdev P. The topography of white matter hyperintensities on brain MRI in healthy 60- to 64-year-old individuals. Neuroimage. 2004;22:144–154. doi: 10.1016/j.neuroimage.2003.12.027. [DOI] [PubMed] [Google Scholar]
- 20.Gootjes L, Teipel SJ, Zebuhr Y, et al. Regional distribution of white matter hyperintensities in vascular dementia, Alzheimer’s disease and healthy aging. Dement Geriatr Cogn Disord. 2004;18:180–188. doi: 10.1159/000079199. [DOI] [PubMed] [Google Scholar]
- 21.McKhann G, Drachman D, Folstein M, et al. Clinical diagnosis of Alzheimer’s disease: report of the NINCDS-ADRDA Work Group under the auspices of Department of Health and Human Services Task Force on Alzheimer’s Disease. Neurology. 1984;34:939–944. doi: 10.1212/wnl.34.7.939. [DOI] [PubMed] [Google Scholar]
- 22.Chui HC, Victoroff JI, Margolin D, Jagust W, Shankle R, Katzman R. Criteria for the diagnosis of ischemic vascular dementia proposed by the State of California Alzheimer’s Disease Diagnostic and Treatment Centers. Neurology. 1992;42:473–480. doi: 10.1212/wnl.42.3.473. [DOI] [PubMed] [Google Scholar]
- 23.Winblad B, Palmer K, Kivipelto M, et al. Mild cognitive impairment—beyond controversies, towards a consensus: report of the International Working Group on Mild Cognitive Impairment. J Intern Med. 2004;256:240–246. doi: 10.1111/j.1365-2796.2004.01380.x. [DOI] [PubMed] [Google Scholar]
- 24.Folstein MF, Folstein SE, McHugh PR. Mini Mental State: a practical method for grading the cognitive state of patients for clinician. J Psychiatr Res. 1975;12:189–198. doi: 10.1016/0022-3956(75)90026-6. [DOI] [PubMed] [Google Scholar]
- 25.Hughes CP, Berg L, Danziger WL, Coben LA, Martin RL. A new clinical scale for the staging of dementia. Br J Psychiatry. 1982;140:566–572. doi: 10.1192/bjp.140.6.566. [DOI] [PubMed] [Google Scholar]
- 26.Morris JC. The Clinical Dementia Rating (CDR): current version and scoring rules. Neurology. 1993;43:2412–2414. doi: 10.1212/wnl.43.11.2412-a. [DOI] [PubMed] [Google Scholar]
- 27.DeCarli C, Mungas D, Harvey D, et al. Memory impairment, but not cerebrovascular disease, predicts progression of MCI to dementia. Neurology. 2004;63:200–207. doi: 10.1212/01.wnl.0000130531.90205.ef. [DOI] [PMC free article] [PubMed] [Google Scholar]
- 28.Jack CR, Jr, O’Brien PC, Rettman DW, et al. FLAIR histogram segmentation for measurement of leukoariasiosis volume. J Magn Res Imag. 2001;14:668–676. doi: 10.1002/jmri.10011. [DOI] [PMC free article] [PubMed] [Google Scholar]
- 29.Maes F, Collignon A, Vanermuelen D, Marchal G, Suetens P. Multimodality image registration by Maximization of mutual information. IEEE Trans Med Imag. 1997;16:187–198. doi: 10.1109/42.563664. [DOI] [PubMed] [Google Scholar]
- 30.Kochunov P, Lancaster J, Thompson P, et al. Regional spatial normalization: toward an optimal target. J Comput Assist Tomogr. 2001;25:805–816. doi: 10.1097/00004728-200109000-00023. [DOI] [PubMed] [Google Scholar]
- 31.Otte M. Elastic registration of fMRI data using Bezier-Spline transformations. IEEE Trans Med Imag. 2001;20:193–206. doi: 10.1109/42.918470. [DOI] [PubMed] [Google Scholar]
- 32.Evans AC, Collins DL, Mills SR, Brown ED, Kelly RL, Peters TM. 3D statistical neuroanatomical models from 305 MRI volumes. Proc IEEE Nucl Science Symp Med Imag Conf. 1994;3:1813–1817. [Google Scholar]
- 33.Fazekas F, Kapeller P, Schmidt R, et al. The relation of cerebral magnetic resonance signal hyperintensities to Alzheimer’s disease. J Neurol Sci. 1996;142:121–125. doi: 10.1016/0022-510x(96)00169-4. [DOI] [PubMed] [Google Scholar]
- 34.Bowen BC, Barker WW, Loewenstein DA, Sheldon J, Duara R. MR signal abnormalities in memory disorder and dementia. AJNR Am J Neuroradiol. 1990;11:283–290. [PMC free article] [PubMed] [Google Scholar]
- 35.Mirsen TR, Lee DH, Wong CJ, et al. Clinical correlates of white-matter changes on magnetic resonance imaging scans of the brain. Arch Neurol. 1991;48:1015–1021. doi: 10.1001/archneur.1991.00530220031015. [DOI] [PubMed] [Google Scholar]
- 36.Fazekas F, Englund E. White matter lesions. In: Erkinjuntti T, Gauthier S, editors. Vascular cognitive impairment. London, UK: Martin Dunitz; 2002. pp. 135–144. [Google Scholar]
- 37.Mayer PL, Kier EL. The controversy of the periventricular white matter circulation: a review of the anatomic literature. AJNR Am J Neuroradiol. 1991;12:223–229. [PMC free article] [PubMed] [Google Scholar]
- 38.Roman GC. Senile dementia of the Binswanger type: a vascular form of dementia in the elderly. JAMA. 1987;258:1782–1788. doi: 10.1001/jama.1987.03400130096040. [DOI] [PubMed] [Google Scholar]
- 39.Nelson MD, Gonzales-Gomez I, Gilles FH. The search for human telencephalic ventriculofugal arteries. AJNR Am J Neuroradiol. 1991;12:215–222. [PMC free article] [PubMed] [Google Scholar]
- 40.Moody DM, Bell MA, Challa VR. Features of the cerebral vascular pattern that predict vulnerability to perfusion or oxygenation deficiency: an anatomic study. AJNR Am J Neuroradiol. 1990;11:431–439. [PMC free article] [PubMed] [Google Scholar]
- 41.DeCarli C. The role of cerebrovascular disease in dementia. Neurologist. 2003;9:123–136. doi: 10.1097/00127893-200305000-00001. [DOI] [PubMed] [Google Scholar]
- 42.de Lacoste MC, Kirkpatrick JB, Ross ED. Topography of the human corpus callosum. J Neuropathol Exp Neurol. 1985;44:578–591. doi: 10.1097/00005072-198511000-00004. [DOI] [PubMed] [Google Scholar]
- 43.Pandya DM, Seltzer B. The topography of commissural fibers. In: Lepore F, Ptito M, Jasper HH, editors. Two hemispheres– one brain: functions of the corpus callosum. New York: Wiley; 1986. pp. 47–73. [Google Scholar]
- 44.Weis S, Jellinger K, Wenger E. Morphometry of the corpus callosum in normal aging and Alzheimer disease. J Neural Transm (Suppl) 1991;33:35–38. doi: 10.1007/978-3-7091-9135-4_6. [DOI] [PubMed] [Google Scholar]
- 45.Aboitz F, Rodriguez E, Olivares R, Zaidel E. Age-related changes in fibre composition of the human corpus callosum: sex differences. Neuroreport. 1996;7:1761–1764. doi: 10.1097/00001756-199607290-00013. [DOI] [PubMed] [Google Scholar]
- 46.Janowsky JS, Kaye JA, Carper RA. Atrophy of the corpus callosum in Alzheimer’s disease versus healthy aging. J Am Geriatr Soc. 1996;44:798–803. doi: 10.1111/j.1532-5415.1996.tb03736.x. [DOI] [PubMed] [Google Scholar]
- 47.O’Sullivan M, Jones DK, Summers PE, Morris RG, Williams SCR, Markus HS. Evidence for cortical “disconnection” as a mechanism of age-related cognitive decline. Neurology. 2001;57:632–638. doi: 10.1212/wnl.57.4.632. [DOI] [PubMed] [Google Scholar]
- 48.Head D, Buckner RL, Shimony JS, et al. Differential vulnerability of anterior white matter in nondemented aging with minimal acceleration in dementia of the Alzheimer type: evidence from diffusion tensor imaging. Cereb Cortex. 2004;14:410–423. doi: 10.1093/cercor/bhh003. [DOI] [PubMed] [Google Scholar]
- 49.Jack CR, Jr, Petersen RC. Structural imaging approaches to Alzheimer’s disease. In: Scinto LFM, Daffner KR, editors. Early diagnosis of Alzheimer’s disease. Totowa, NJ: Humana Press; 2000. pp. 127–148. [Google Scholar]
- 50.Braak H, Braak E. Neuropathological staging of Alzheimer-related changes. Acta Neuropathol. 1991;82:239–259. doi: 10.1007/BF00308809. [DOI] [PubMed] [Google Scholar]
- 51.Teipel SJ, Hampel D, Pietrini P, et al. Region-specific corpus callosum atrophy correlates with the regional pattern of cortical glucose metabolism in Alzheimer disease. Arch Neurol. 1999;56:467–473. doi: 10.1001/archneur.56.4.467. [DOI] [PubMed] [Google Scholar]
- 52.Teipel SJ, Bayer W, Alexander GE, et al. Regional pattern of hippocampus and corpus callosum atrophy in Alzheimer’s disease in relation to dementia severity: evidence for early neocortical degeneration. Neurobiol Aging. 2003;24:85–94. doi: 10.1016/s0197-4580(02)00044-1. [DOI] [PubMed] [Google Scholar]
- 53.Biegon A, Eberling JL, Richardson BC, et al. Human corpus callosum in aging and Alzheimer’s disease: a magnetic resonance imaging study. Neurobiol Aging. 1994;15:393–397. doi: 10.1016/0197-4580(94)90070-1. [DOI] [PubMed] [Google Scholar]
- 54.Pantel J, Schroder J, Jauss M, et al. Topography of callosal atrophy reflects distribution of regional cerebral volume reduction in Alzheimer’s disease. Psychiatry Res. 1999;90:181–192. doi: 10.1016/s0925-4927(99)00018-9. [DOI] [PubMed] [Google Scholar]
- 55.Hensel A, Wolf H, Kruggel F, et al. Morphometry of the corpus callosum in patients with questionable and mild dementia. J Neurol Neurosurg Psychiatry. 2002;73:59–61. doi: 10.1136/jnnp.73.1.59. [DOI] [PMC free article] [PubMed] [Google Scholar]
- 56.Yamanouchi H, Sugiura S, Shimada H. Decrease of nerve fibers in the anterior corpus callosum of senile dementia of Alzheimer type. J Neurol. 1989;236:491–492. doi: 10.1007/BF00328517. [DOI] [PubMed] [Google Scholar]
- 57.Yamamoto A, Miki Y, Tomimoto H, et al. Age-related signal intensity changes in the corpus callosum: assessment with three orthogonal FLAIR images. Eur Radiol. 2005;15:2304–2311. doi: 10.1007/s00330-005-2759-0. [DOI] [PubMed] [Google Scholar]
- 58.Pearson C. Cerebral cortex. In: Williams PL, Bannister LH, Berry MM, et al., editors. Gray’s anatomy. London, UK: Churchill Livingstone; 1995. pp. 1141–1186. [Google Scholar]
- 59.Yamamoto A, Miki Y, Fushimi Y, Okada T, Tomimoto H. Mid-anterior surface of the callosal splenium: subependymal or subpial? AJNR Am J Neuroradiol. 2004;25:665. Letter. [PMC free article] [PubMed] [Google Scholar]