

Abstract
Assessment of metabolites by 1H MRS could provide information regarding glioma growth, and perhaps distinguish between different glioma models. Rat C6, 9L/LacZ, F98 or RG2, or mouse GL261 cells were intracerebrally implanted into respective rodents, and human U87 MG cells were implanted into athymic rats. Ethyl-nitrosourea (ENU) induction was also used. Glioma metabolites (e.g. total choline (tCho), total creatine (tCr), N-acetyl-aspartate (NAA), lactate (Lac), glutamine (Gln), glutamate (Glu), aspartate (Asp), guanosine (Gua), mobile lipids, and macromolecules (MM)) were assessed from 1H MRS with PRESS (TE, 24 ms, TR, 2500 ms, and VAPOR water suppression; 27 μl or 8 μl voxels in rats or mice, respectively) at 7 Tesla. Alterations in metabolites (TARQUIN) in tumors, were characterized by increases in lipids (Lip1.3; 8.8–54.5 mM for C6 and GL261) and decreases in NAA (1.3–2.0 mM for RG2, GL261 and C6) and tCr (0.8–4.0 mM in F98, RG2, GL261 and C6) in some models. F98, RG2, GL261 and C6 models all had significantly decreased (p<0.05) tCr, and RG2, GL261 and C6 had significantly decreased (p<0.05) NAA. The RG2 model had significantly decreased (p<0.05) Gln and Glu, the C6 model had significantly decreased (p<0.05) Asp, and the F98 and U87 models had significantly decreased (p<0.05) Gua, compared to controls. GL261 had the greatest alterations in metabolites. 1H MRS was able to differentiate metabolic profiles in many of the 7 rodent glioma models assessed. These models are considered to resemble some characteristics of human glioblastomas, and this study may be helpful in selecting appropriate models.
Keywords: Glioblastoma, rodent glioma models, necrosis, metabolic profile, 1H MRS
Introduction
Gliomas represent 40% of all primary central nervous system (CNS) tumors diagnosed. Among them, glioblastomas (GBM) are the most malignant, with a very poor survival time of 15 months for any patient diagnosed with this grade IV brain tumor (1). Because of this short window of time allowed for treatment, there is no room for mistaken diagnosis and glioma characteristics must be precisely and quickly assessed (2). Important grading and identification criteria that can be used to precisely depict tumor behavior are cell proliferation (cellularity and mitotic activity), nuclear atypia, neovascularization and the presence of necrosis and/or apoptotic regions (3). Grade II gliomas (“diffuse astrocytomas”) and grade III gliomas (“anaplastic astrocytomas”) only differ based on the presence of mitotic activity, and this difference accounts for a dramatic decrease in 5-year survival for the patient, from 47% to 29% (from grade II to III, respectively) (1). Grade IV gliomas (“GBM”) are often characterized by large necrotic areas (3) and present a 3% 5-year survival (1).
These grading criteria in particular can be assessed in vivo using non-invasive MR techniques. The focus of this study was to use 1H MRS to determine if metabolic profiles could be used to differentiate between diverse rodent glioma models. Obtaining information on the amount and changes in brain metabolites, which reflect processes such as cell proliferation (4) and cell death (5,6), may provide additional information for tumor grading. 1H MRS has already been reported as an efficient technique to discriminate between brain lesions (7–9) and follow the efficiency of treatments (10). It possesses some advantages to obtaining biopsies, which is the usual grading method in clinics. Biopsies have several limitations including sampling error, possible complications, invasiveness, limited sample size, and patient discomfort. For instance it has been found that at least 10% of the biopsies do not bring any useful diagnostic information to the physician (11,12), and unfortunately there have been cases of some patients being killed as a result of the biopsy procedure (11,13). 1H MRS is a useful method to assess the main brain metabolic biomarkers: N-acetyl aspartate (NAA), total choline (tCho) and total creatine (tCr) compounds, lactate (Lac), and mobile lipids. Rapidly growing tumors are known to present an increase in tCho levels (due to the increase in membrane synthesis during cell proliferation (4)). Any neuronal death will be translated in a decrease in NAA levels (5), an important neuronal marker (14). The level of tCr relates to the ADP/ATP energy cycle (15), and is generally decreased in astrocytomas, compared to normal brain tissue (16,17). It is well known that neoplastic cells have an increased capacity for glycolytic metabolism (18). Lac is an end product of glycolysis, and has been found to increase in rodent glioma models (18). In addition, the presence of mobile lipids is recognized as a characteristic feature associated with malignant gliomas (4), and this is thought to be due to membrane breakdown during necrosis (6,19).
Our first step was to obtain robust and reliable glioma models by intracerebral implantation of tumor cells (20) from different cell lines varying in their degree of malignancy: rat C6, 9L/LacZ, F98 and RG2, mouse GL261 and human U87, giving us a range of gliomas from moderately aggressive (grade III) to GBM-like (grade IV). A chemically-induced glioma model was also implemented following ethyl-nitrosourea (ENU) administration (21,22). Each one of these cell implantation models is considered a reliable model of GBM (grade IV) (20,23–25), with however slightly different malignancies (from diffusively invasive C6 (20) and GL261 gliomas (26) to the aggressive grade IV U87 model (25,27). The C6 cell line produces diffusively invasive astrocytomas (20), has been found to show a higher similarity to human glioma cells in the expression of genes mainly involved in tumor progression (28) and the C6 model has been widely used as a GBM model for years (23). The 9L/LacZ-originated tumors are aggressive and infiltrative which possess characteristics of human GBM (24), notably its angiogenic behavior (29). F98 gliomas are classified as anaplastic malignant tumors, which show an infiltrative pattern of growth and also resemble human GBM (20). The aggressive and invasive nature (20) of RG2 tumors mimics human high-grade gliomas by inducing important vascular alterations (30), as the highly tumorigenic glioblastoma U87 MG cell line does (25,27). GL261 cells give rise to quickly growing, slightly invasive intracranial tumors in C57BL/6 mice (26). Finally, ENU induction gives rise to low-grade oligodendrogliomas and mixed variable-grade gliomas, with a tumor incidence approaching 100% (22). By studying all these glioma models, we hoped to show that 1H MRS is a sensitive enough technique to depict slight differences between some of these GBM models, and demonstrate that 1H MRS may be a useful additional tool for glioma grading.
Methods
Cell culture
Primary rat neocortical astrocytes were kindly obtained from Dr. Hensley’s group at the Oklahoma Medical Research Foundation (31). The murine GL261 cell line was kindly provided by Dr. Safrany, from the Frederic Joliot-Curie National Research Institute for Radiobiology and Radiohygiene (26). The rat C6, 9L/LacZ, F98, RG2 and human U87 glioma cell lines were purchased from ATCC. All cell lines were cultured at 37°C with 5% CO2 in high glucose Dulbecco’s modified Eagle’s medium (DMEM) supplemented with 10% fetal bovine serum (FBS) and 1% penicillin/streptomycin (32,33) (at the exception of human U87 cells which favored Eagle’s minimal essential medium (EMEM)). Before implantation, the cells were briefly trypsinized, centrifuged and resuspended in DMEM or EMEM. Agarose (Sigma) was added to the final suspension to obtain a 1% ultra-low temperature gelling agarose cell suspension (32), which was kept in a sterile vial at 37°C until implantation.
Cell implantation
The animal study was conducted in compliance with the OMRF Institutional Animal Care and Use Committee. The rat glioma cell implantation models were obtained as previously described by our group (34). Briefly, three-month-old male Fischer 344 rats (Harlan Inc., Indianapolis, IN) were anesthetized and immobilized on a stereotaxic unit. A hole was drilled through the skull at 2 mm anterior and 2 mm lateral to the bregma, on the right-hand side of the skull. 10,000 cells of the desired cell line (C6, 9L/LacZ, F98 or RG2) suspended in a 10 μl volume were injected at a depth of 3 mm from the dura into the cerebral cortex, at a rate of 2 μl/min, followed by a waiting time of 2 min. Control injections of primary rat astrocytes were conducted in the same conditions. The human U87 glioma model was obtained by injecting 3-month-old male athymic rnu/rnu rats (Charles River laboratories, Wilmington, MA) with 100,000 U87 MG cells at a rate of 0.8 μl/min, followed by a waiting time of 5 min. Two-month-old C57BL/6 male mice were implanted with 2 × 10⁴ GL261 cells in a volume of 4 μL, at 1 mm anterior and 2 mm lateral to the bregma, at a depth of 1.5 mm, using an injection rate of 0.6 μL/min. For rat and human glioma cell implantations we usually used cells starting from their 3rd passage, and did not exceed more than 30 passages. For the GL261 mouse glioma cell implantations we did not use cells that had undergone more than 20 passages.
ENU induction
A 0.1M solution of ENU was prepared in citric acid and phosphate buffer (pH 6) immediately before use. Pregnant Fischer 344 female rats were injected by i.v. in the tail vein with an ENU suspension of 50 mg/kg at 21 days of pregnancy, as recommended by Kish et al. (21). The offspring were delivered naturally and weaned at 22 days old. Only males were selected for our study, and were kept under weekly observation for any sign of neurological or health problems.
MR experiments
Basic brain morphology and spectroscopy datasets were acquired for 4 rats implanted with primary astrocytes (“CTRL”), 5 C6-implanted animals (“C6”), 4 9L/LacZ-implanted rats (“9L”), 4 F98-implanted animals (“F98”), 5 RG2-injected rats (“RG2”), 5 U87 MG-implanted animals (“U87”), 5 GL261-injected mice (“GL261”) and 4 male rats exposed transplacentally to ENU (“ENU”). Animals were imaged at the OMRF Nuclear Magnetic Resonance Core Facility, using a 30cm-horizontal bore 7 Tesla magnet (Bruker BioSpin MRI Gmbh, Ettlingen, Germany) at day 7 after cell implantation and then every third day for the orthotopic glioma models. Maximum tumors were reached at days 17–21 for C6, days 14–26 for RG2, days 15–35 for U87, days 36–47 for 9L/lacZ, days 18–26 for F98, and days 23–35 for GL261. The rats bearing ENU-induced gliomas were imaged at 3-month-old and then every month.
Each animal was anesthetized (2% isoflurane at 0.7 L/min oxygen) and immobilized in a MR probe head first and in a prone position. A head surface coil was used to receive the induced MR signal. A quadrature volume coil was used for transmission of all RF pulses (Bruker BioSpin MRI Gmbh, Ettlingen, Germany). After checking the correct positioning of the brain at the isocenter, morphological T2-weighted images of the whole cerebrum were acquired using a multi-slice RARE (rapid acquisition with relaxation enhancement) sequence. Twenty-four contiguous transverse slices of 1 mm thickness were taken at a TR of 3000 ms and a TE of 63 ms, in a field of view (FOV) of 3.5 × 3.5 cm2, for a total acquisition time of 13 min and resulting in an approximate in-plane resolution of 140 μm. Mouse brain morphological images were acquired with a slice thickness of 0.5 mm and a FOV of 2 × 2 cm2, for an approximate in-plane resolution of 80 μm. Spectra were acquired in a 3 × 3 × 3 mm3 voxel (2 × 2 × 2 mm3 in the mice) centered on the cell implantation site and on its mirror location in the other hemisphere, using a PRESS (point-resolved spectroscopy) sequence with a TE of 24 ms, a TR of 2500 ms, 256 averages, a spectral width of 4006 Hz and a VAPOR (35) water suppression scheme, for a total acquisition time of 11 min. Adjustments of the first and second order shims were conducted beforehand using Fastmap (36), until the width of the water peak at mid-height was less than 30 Hz.
Data analysis
Tumor volumes and doubling times (Td) were determined from the T2-weighted images, as described previously by our group (34). The latency time (number of days needed by the implanted cells to form a tumor of 10 mm3 in size) and morphology of each glioma were also noted.
Initial processing (apodization with line broadening of 5 and Fourier transform) of the MRS data was done using the “Bruker TopSpin” tool available on the Paravision software (PV4.0, Bruker BioSpin MRI Gmbh, Ettlingen, Germany). Each spectrum was then phase corrected, scaled in ppm and calibrated on the water peak (4.78 ppm) using a Mathematica notebook written in-house (Mathematica 7.0, Wolfram Research, Champaign, IL).
For estimation of absolute quantitation of 1H-MRS metabolites, the Totally Automatic Robust Quantitation in NMR (TARQUIN) method (as more fully described by Reynolds et al., 2006 (37); and Wilson et al., 2011 (38)) was used to quantify metabolite signals of the in vivo 1H-MRS data. The TARQUIN algorithm consists of (1) preprocessing (removal of post-acquisition residual water by Hankel Singular Value Decomposition (HSVD), automatic phasing), (2) basis set simulation (quantum mechanical simulation of 1H-NMR signals from small molecules), and (3) the solution of a nonlinear least squares fitting problem (modeling the experimental data as a linear combination of modified basis signals, and following the adjustment of all segments the basis set is re-simulated and synthetized at the new frequencies) (37,38). The amplitudes of the metabolite signals are estimated to be expressed in absolute units, by scaling the fitted signal amplitudes to the amplitude of an unsuppressed water resonance (obtained from an additional experiment), where the concentration of water is known for particular tissue types (37,38). The TARQUIN program was obtained at http://tarquin.sourceforge.net/. 1H-MRS sequence details (TE, pulse sequence, reference offset), and the spectrometer frequency (sampling and transmitter frequencies) are confirmed prior to peak simulation. Peak metabolite concentration estimates were further normalized (in addition the water concentration of 35.88 mol/L in brain tissue (38)) to published rat brain total creatine (Cr + PCr) levels of 7.5 mmol/kg wet weight as reported by Cudalbu et al. (39). tCr signal and concentrations in control animals and contralateral ‘normal’ brain tissue were used as a reference for obtaining concentrations of other metabolites in glioma tissues in each model. Assignment of metabolites was based on published literature: e.g. NAA was assigned at 2.02 ppm, tCr at 3.03 ppm, tCho at 3.22 ppm, Lac at 1.32 ppm, Ala at 1.47 ppm, Gln at 2.12 ppm, Glu at 2.35 ppm, Asp at 2.79 ppm, Tau at 3.42 ppm, and myo-Ins at 3.53 ppm (40). Mobile lipid peaks are usually absent from normal brain tissue, but are visible at 1.29 and 0.88 ppm in tumor tissue samples, and are associated with the fatty acyl proton groups CH2 (predominantly saturated methylene hydrogens; Lip1.3=Lip1.3a+Lip1.3b) and CH3 (methyl hydrogens; Lip0.9), respectively (41). It should be noted that the 1.3 ppm peak is a composite peak with contributions from both the lactate methyl and lipid methylene protons (42). For some metabolites, concentrations were combined to reflect total levels (e.g. tCr included all creatine-containing compounds, tCho included all choline-containing compounds (GPC+ PCh), NAA = NAA + NAAG, and MM included all MM peaks (0.92 (MM09), 1.21 (MM12), 1.39 (MM14), 1.67 (MM17), and 2.04 (MM20) ppm (40)). The basis set simulation set included all of the metabolites listed above and in addition GABA, Glc, scyllo-Ins (Scyllo), Gua and Lip2.0.
Statistical analysis
Statistical analysis of the data was conducted with Prism 5.01 (GraphPad software, LaJolla, CA). Differences in estimated metabolite concentrations between groups were examined using two-tailed, unpaired, Student’s t-tests with Welch’s correction. In all cases, significance was considered for t-tests yielding a p value below 0.05 (*), 0.01 (**) or 0.001 (***).
Results
Glioma growth pattern and necrosis levels
MR data of the “CTRL” rats showed that our implantation procedure did not induce any non-desired effects, except a slight inflammation of the brain tissue in the neighborhood of the needle trauma, visible as a bright area on the MR image and the appearance of mobile lipid peaks. Inflammation quickly disappeared within a week after cell implantation. The ENU gliomas had a particularly slow growth (Td = 4.7 ± 1.1 weeks) and a long latency time (27 ± 4 weeks before observing the first glioma). The latency times of the cell implantation glioma models were found to be similar and their growth patterns in general were identical. However, the RG2 and 9L/LacZ models placed themselves on each side of this spectrum. In addition to their long latency time, the 9L/LacZ tumors presented long Td (4.18 ± 0.86 days) and survival time (49.3 ± 5.1 days) when compared to the other glioma models. The aggressive RG2 glioma model distinguished itself by a very quick growth (Td = 1.5 ± 0.32 days) and a very short survival time (16.9 ± 2.27 days). Representative morphological MR images of each glioma model are shown in Figure 1. Rodent gliomas with distinct tumor boundaries include the ENU (Fig. 1B), U87 (fig. 1E), 9L/LacZ (Fig. 1F) and C6 (Fig. 1G) models, whereas more diffuse gliomas included GL261 (Fig. 1C), RG2 (Fig. 1D) and F98 (Fig. 1H) models.
Figure 1.
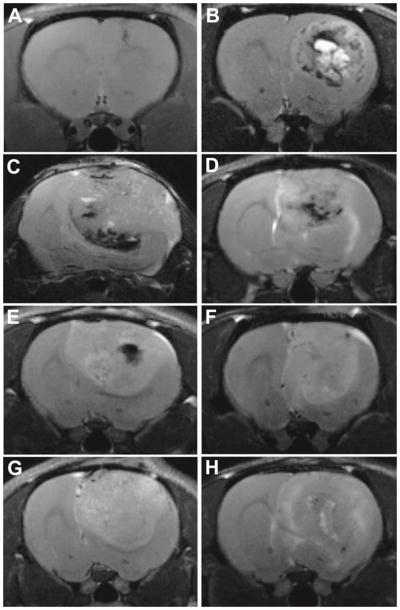
Representative T2-weighted images for gliomas from astrocyte-injected controls (Ctrl) (at 29 days following cell injection) (A), ENU (at 43 weeks of age) (B), GL261 (at 23 days following cell injection) (C), RG2 (at 17 days following cell injection) (D), U87 (at 16 days following cell injection) (E), 9L/lacZ (at 37 days following cell injection) (F), C6 (at 17 days following cell injection) (G) and F98 (at 20 days following cell injection) (H) models.
Glioma metabolic profiles
Representative localized MR spectra (PRESS) are shown in Figure 2, depicting metabolites in tumor and contralateral brain tissues. Estimated tumor metabolite concentrations measured by TARQUIN analysis (which are shown in Table 1), indicated that some glioma models, such as the F98, RG2, C6 and GL261 models, had significantly decreased levels (p<0.05) of tCr compared to control brain tissue. It was also noted that tCr levels were significantly higher (p<0.05) in C6 and ENU gliomas compared to F98 gliomas. The amount of NAA was found to be significantly lower (p<0.05) in the GL261, RG2 and C6 models compared to control brain tissue and the ENU model. The lipid 1.3 ppm peak was found to be significantly higher (p<0.05) in the C6 glioma model compared to control brain tissue or all other glioma models, and found to be significantly higher (p<0.05) in the C6 and GL261 models compared to the ENU model. Although there was a tendency for an increase in lipid levels within tumors, this increase was found to be significant only for C6 (8.8±4.1 mM) compared to controls (0.0±0.0 mM). GL261 tumors presented a significant increase (p<0.05) in the lipid methylene peak (54.5±41.0 mM) compared to ENU (0.1±0.2 mM). Other metabolites of note that were altered in some glioma models included GABA, Gln, Glu, Tau, Asp, Gua and MM. GABA was found to be significantly lower (p<0.05) in 9L compared to C6. It should be noted that GABA levels measured in control normal brain tissue (8.9±1.9 mM; Table 1) in this study, are higher than previously reported in normal rat brain tissue (39,40). Gln and Glu were significantly decreased (p<0.05) in RG2 compared to Ctrl, Gln was significantly higher (p<0.05) in C6 and ENU compared to RG2, and Glu was significantly higher (p<0.01) in ENU compared to RG2. Tau was significantly higher (p<0.05) in GL261 compared to ENU. Asp was significantly decreased (p<0.05) in C6 compared to Ctrl, ENU and RG2. Gua was significantly decreased (p<0.01) in F98 and U87 compared to Ctrl, and significantly increased (p<0.05) in U87, 9L and ENU compared to F98. MM were significantly elevated ((p<0.01) in 9L and ENU compared to Ctrl, and ENU had significantly higher (p<0.05) levels than 9L. Metabolites not found to significantly change in all models included tCho, Lip0.9, Lip2.0, Ins, Scyllo, Ala and Glc.
Figure 2.
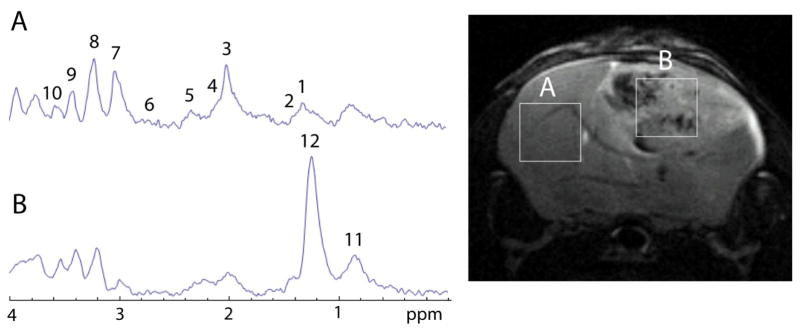
Representative localized (PRESS; 2 × 2 × 2 mm3 voxels) MR spectra obtained in the contralateral brain (A) and tumor (B) tissue regions of a GL261 mouse glioma model (26 days following intracerebral implantation of glioma cells). Peak assignments are: (1) lactate (Lac) at 1.32 ppm, (2) alanine (Ala) at 1.47 ppm, (3) N-acetyl aspartate (NAA) at 2.0 ppm, (4) glutamine (Gln) at 2.12 ppm, (5) glutamate (Glu) at 2.35 ppm, (6) aspartate (Asp) at 2.79 ppm, (7) total creatine-containing compounds (tCr) at 3.0 ppm, (8) total choline-containing compounds (tCho) at 3.3 ppm, (9) taurine (Tau) at 3.42 ppm, (10) myo-inositol (myo-Ins) at 3.53 ppm, (11) the lipid methyl hydrogens at 0.9 ppm, and (12) the lipid methylene hydrogens at 1.3 ppm.
Table 1.
TARQUIN analysis of estimated tumor compound (Cmpd) concentrations (mM) in rodent gliomas compared to control normal (Ctrl) brain tissue from in vivo MR spectra (PRESS).
| Cmpd | Ctrl | F98 | U87 | RG2 | GL261 | C6 | 9L | ENU |
|---|---|---|---|---|---|---|---|---|
| tCr | 7.5±0.7a | 0.8±1.4a**,b | 3.7±3.6 | 2.8±2.3a* | 2.2±2.0a** | 4.0±1.0a**, b* | 4.6±3.8 | 6.2±3.3b* |
| NAA | 5.7±1.1a | 8.2±11.6 | 4.2±4.8 | 1.5±2.0a*,c* | 2.0±0.8a**,c* | 1.3±1.6a**, c* | 2.5±2.2 | 5.0±2.0c |
| tCho | 1.6±0.1 | 8.1±12.4 | 2.6±1.8 | 2.6±2.4 | 2.2±1.2 | 2.1±1.0 | 3.0±1.5 | 2.3±0.9 |
| Lip0.9 | 0±0 | 2.4±4.1 | 1.7±1.2 | 0.7±1.2 | 6.2±5.6 | 1.0±0.9 | 0.1±0.2 | 0.1±0.2 |
| Ins | 4.6±1.5 | 28.8±46.9 | 9.8±6.9 | 3.9±3.5 | 8.6±4.4 | 9.9±4.5 | 2.7±2.3 | 5.9±3.4 |
| GABA | 8.9±1.9 | 6.2±5.4 | 20.9±15.3 | 7.8±4.6 | 7.4±4.6 | 15.1±5.5d* | 2.2±4.4d | 11.8±5.3 |
| Gln | 4.9±1.9a | 3.4±4.9 | 7.6±6.8 | 1.1±1.5a*,d | 2.5±5.7 | 9.6±6.2d* | 6.5±4.4 | 8.0±3.1d** |
| Glu | 11.5±1.3a | 5.5±4.8 | 12.6±9.1 | 5.1±2.7a**,d | 8.9±4.1 | 10.6±5.6 | 7.8±2.8 | 11.3±1.8 d** |
| Tau | 7.6±1.3 | 53.6±85.9 | 6.3±4.9 | 15.2±10.4 | 23.4±11.9c* | 6.3±1.8 | 17.2±21.4 | 8.0±1.9c |
| Ala | 0.2±0.3 | 3.3±5.7 | 0.6±1.2 | 0.8±1.9 | 3.2±5.6 | 0.4±0.8 | 0.6±0.8 | 0.4±0.7 |
| Asp | 4.9±3.3a | 0.3±0.5 | 2.6±2.8 | 10.1±7.1d | 9.9±22.2 | 0±0a*,c*,d* | 6.9±8.8 | 3.0±2.3c |
| Glc | 1.1±1.8 | 41.2±70.3 | 7.7±4.7 | 2.2±2.1 | 4.8±3.4 | 4.5±3.8 | 10.1±10.7 | 1.8±3.7 |
| Gua | 5.0±0.4a | 0.3±0.5a***, b | 2.3±0.8a**,b** | 1.8±3.1 | 8.8±7.4 | 3.3±1.8 | 6.2±3.1b* | 3.5±1.4b* |
| Scyllo | 0±0 | 20.2±34.1 | 0±0 | 1.0±2.1 | 0.3±0.5 | 0±0 | 3.6±6.3 | 0±0 |
| Lac | 0±0a | 3.0±3.3 | 6.4±8.2 | 11.1±9.7 | 19.7±11.5a*,c* | 6.9±7.1 | 0.9±1.2 | 0.4±0.7c |
| Lip1.3 | 0±0a | 2.2±2.7 | 11.8±13.2 | 6.6±10.0 | 54.5±41.0c* | 8.8±4.1a*,c** | 1.0±1.5 | 0.1±0.2c |
| Lip2.0 | 0.8±0.7 | 0.4±0.7 | 1.0±1.0 | 1.4±1.8 | 4.5±7.4 | 1.5±2.2 | 2.0±2.0 | 0.8±1.0 |
| MM | 1.4±0.4a | 6.7±4.7 | 6.7±4.5 | 8.7±5.3 | 11.1±6.7 | 6.1±3.5 | 4.4±1.2a**,c* | 7.1±1.5a**,c |
*, ** or *** represents p<0.05, p<0.01 or p<0.001, respectively. Sample numbers are: F98 (n=4), U87 (n=5), RG2 (n=5), GL261 (n=5), C6 (n=5), and Ctrl (Control, intracerebral injection of astrocytes; n=4).
‘a’ is a comparison between Ctrl and glioma tissue in all glioma models. ‘b’ is a comparison between glioma tissue in the F98 model and all other models. ‘c’ is a comparison between glioma tissue in the ENU model and all other models. ‘d’ is a comparison between glioma tissue in the RG2 model and all other models. Tumor metabolite concentrations were obtained in each glioma model when maximum tumors were reached at days 17–21 for C6, days 14–26 for RG2, days 15–35 for U87, days 36–47 for 9L/lacZ, days 18–26 for F98, and days 23–35 for GL261. The rats bearing ENU-induced gliomas were assessed at 33–39 weeks of age. Statistics were obtained using a two-tailed unpaired Student’s t test. Assignment of metabolites and subsequent concentration measurements were based on published literature: e.g. NAA was assigned at 2.02 ppm, tCr at 3.03 ppm, tCho at 3.22 ppm, Lac at 1.32 ppm, Ala at 1.47 ppm, Gln at 2.12 ppm, Glu at 2.35 ppm, Asp at 2.79 ppm, Tau at 3.42 ppm, and myo-Ins at 3.53 ppm (40). Mobile lipid peaks are associated with the fatty acyl proton groups CH2 (predominantly saturated methylene hydrogens; Lip1.3=Lip1.3a+Lip1.3b) and CH3 (methyl hydrogens; Lip0.9), respectively (41). For some metabolite concentrations were combined to reflect total levels (e.g. tCr included all creatine-containing compounds, tCho included all choline-containing compounds (GPC+ PCh), NAA = NAA + NAAG, and MM included all MM peaks (0.92 (MM09), 1.21 (MM12), 1.39 (MM14), 1.67 (MM17), and 2.04 (MM20) ppm (40)).
Discussion
Metabolic profiles of normal and glioma-bearing brain tissues were assessed by following the main rat brain metabolites (total choline compounds, total creatine compounds, NAA and lactate) and mobile lipids using 1H MRS in 7 rodent glioma models. The growth pattern, survival, border sharpness and angiogenic ability of these models have already been characterized in detail by our group (43). The missing piece of the puzzle was to determine if metabolic profiles could be used to gather information on glioma malignancy.
MRS has already been reported as an efficient technique to discriminate between brain lesions (7) and follow the efficiency of treatments (10). It possesses obvious advantages on other grading methods such as contrast-enhanced MRI and biopsies. While high blood volume is usually associated with high-grade tumors, some low-grade oligodendrogliomas can present such high blood volume, so contrast-enhanced imaging can be useless for oligodendrogliomas grading (44). It is interesting to consider MRS as an additional method for tumor grading. In particular MRS can be used to follow 2 processes taken into consideration when grading, i.e. mitotic activity and necrosis. One of the brain metabolites assessed with 1H MRS is choline (and total choline compounds tCho) which reflects membrane synthesis and is therefore associated with cellular proliferation in tumors (45). tCho is found to be commonly increased in malignant gliomas (46,47). tCho are also linked to membrane degradation, and processes that either promote cellular proliferation or induce cell death are represented by an increased tCho peak on MR spectra (10,15). In our study we did not observe any significant differences in the estimated tCho concentrations as measured from TARQUIN analysis (see Table 1). Total creatine compounds (tCr) are markers of the energy cycle, and their concentration is known to decrease when necrosis occurs (48). More specifically, the degree of malignancy of the glioma is tightly correlated with the tCho/tCr ratio, and grade IV GBM are known to possess dramatically elevated tCho/tCr ratios (49–51). This ratio is a widely recognized marker for cellular proliferation (4,51) and thus appeared to be a good candidate for tumor grading since mitotic activity is the grading criterion that separates grade II from grade III tumors (3) (a difference of nearly 18% in 5-year survival rate (52)). Some investigators even proposed that mitotic activity is the main marker of bad prognosis and malignancy, and that endothelial proliferation and necrosis are only secondary (53). Estimated glioma tCr concentrations measured by TARQUIN analysis indicated that in most glioma models tCr was decreased, such as the F98, RG2, GL261 and C6 models. Due to the variation in tCr concentrations in some glioma models, metabolite ratios compared to tCr may not be an ideal parameter for comparative analysis between glioma models or tumor grades.
Another brain metabolite of interest is NAA, which is a marker of neuronal integrity (15) and possessed several functions, such as the regulation of neuronal protein synthesis and the metabolism of neurotransmitters. When neuronal death occurs, the NAA peak becomes smaller (54). A common observation in malignant human brain tumors is that NAA is present at low concentration (46,47,55). It should be noted that there is a lipid/mm peak at 2.05-ppm detected in brain tumor spectra which may compromise the signal from NAA at 2.00 ppm (56,57). This is particularly more apparent in metastatic brain tumors due to the relatively long T2 of the 2.05-ppm Lip/MM peak thought to be contributed from mucus glycoproteins, and could be used to differentiate metastatic brain tumors from GBM (57). Estimated NAA concentrations measured from TARQUIN analysis indicated significantly decreased NAA levels in only the GL261, C6 and RG2 glioma models compared to control brain tissue and the ENU model.
Mobile lipids (observed through their saturated methylene and methyl groups) are also essential to follow in many pathologies such as brain tumors and ischemic injuries since they reflect necrosis (19), an important grading criterion (3), and GBM are known to possess high levels of mobile lipids (4,19,58). NMR-visible mobile lipids (lipid/MM (macromolecules) signals observed at ~1.3 and 0.9 ppm) appear to be an inherent feature of brain tumors, and have been considered an important factor in the grading of in vivo 1H MRS astrocytoma spectra (59–62). Mobile lipids originate from the membrane phospholipids that are degraded during membrane breakdown and necrosis (6,63). Tumor malignancy could be linked to the elevated presence of lipids in the tissue, since high grade tumors usually present pronounced necrosis (49,50,64), due to their increased nutrient and oxygen needs and their inadequate vascularization inducing hypoxia. There are also some reports that have looked at the accumulation of lipids as a marker for growth arrest, early detection of tumor eradication, and detection of apoptosis following anti-cancer therapy (65,66). Estimated lipid 1.3 concentrations measured by TARQUIN analysis were significantly elevated in the C6 glioma model compared to controls, and GL261 compared to the ENU model. In vivo lactate concentrations have also been found to generally increase with malignancy (59,60), although no direct correlations have been made with tumor grading (60,67). Depending on the pulsing conditions for MRS, the lactate peak(s) at ~1.3 ppm (doublet at 1.25 and 1.33 ppm) also may contribute to the lipid 1.3-ppm peak which may affect the actual detection of mobile lipids (63). In our study, lactate was found to be significantly elevated (p<0.05) in the GL261 model compared to controls and the ENU model.
It is commonly known that gliomas are characterized by elevated tCho/tCr and lipids/tCr ratios, and by decreased NAA levels (15,46,47). As tCr was found to change in our study, it is not a good reference to use when comparing other metabolites. As both NAA and tCr are known to decrease during tumor progression (48), ratio variations could be less sensitive or even kept constant despite changes in the individual metabolite concentrations. High-grade gliomas are also known to present more dramatic changes than low-grade gliomas (51).
All the glioma implantation models studied in this project (C6, 9L/LacZ, F98, RG2, U87 and GL261) are considered to be good models of human-like gliomas (grades III–IV), and numerous studies have used them (68). If that were the case, one would then expect them to exhibit similar spectra and nearly identical metabolic profiles. Some investigators have shown that using the same cell line, tumors with different MRS characteristics can be generated in vivo (69). They were able to show that metabolic profiles detected by 1H MRS could be used to distinguish between two distinct human glioblastoma phenotypes in immunodeficient rats that gradually changed following serial passages, from a highly infiltrative, non-angiogenic, low-generation (LG) tumor, to a high-generation (HG) tumor with extensive angiogenesis and necrosis, where the LG tumor had significantly higher levels of Cho and lactate than the HG tumors (69). The ENU-induced model has been previously reported as being low-grade (21), and in our study seems to have many metabolite levels (except for MM) to be similar to that of the control. Although a previous proton MRS study done on F98 rat gliomas found an increase in choline, myo-inositol, lipids and lactate, an absence of signals from NAA, and a loss of total creatine (70), these were only detected as trends in our study, and not found to significantly differ from controls.
To our knowledge, we are the first to simultaneously compare the metabolic profiles in 7 rodent glioma models using MRS, and to correlate these findings with MRI and histology. The expected similar metabolic profiles in the 7 rodent glioma models studied did not occur, as we were able to show that some of these glioma models possessed different metabolic fingerprints. Slow-growing ENU and 9L/LacZ gliomas had only slightly decreased tCr levels compared to controls, whereas the aggressive RG2, C6 and GL261 tumors presented dramatically decreased tCr levels, which is reflected along with their high tumor growth activity. The GL261 model had the most metabolite alterations compared to all other models. When considering metabolites other than NAA, tCr, lipids and lactate, C6 was found to differ from RG2 when assessing Gln and Asp levels.
In this study we measured estimated metabolite concentrations. However, this determination must take into consideration many different factors such as, homogeneity of the field (32), quality of water suppression, receiver gain of the magnet, T1 and T2 relaxation of the metabolites of interest (that can vary in pathological states (32,67), and cellular dilution of metabolites due to the presence of necrotic regions (15,67). High-grade tumors are quite heterogeneous, consisting of necrotic regions, cystic regions, and areas of viable and hypoxic tumor cells (71), and therefore the absolute concentrations of metabolites, lipids and MMs are highly variable due to the effects of partial volume (57). Since absolute concentrations are dependent on tissue cellularity, which decreases when necrosis occurs (15), some investigators recommend that relative ratios should be used in the case of highly necrotic tumors (15). The assessment of relative ratios may also easier to implement in clinical settings to ensure that MRS results can be compared between laboratories. It should also be noted that for some metabolites, such as GABA, TARQUIN may have some problems in estimating concentrations, as the GABA levels in this study are higher than previously reported (39,40).
One could also propose to use MR spectroscopic imaging (MRSI) to bring more detailed spatial information on each of these glioma models, or use two-dimensional spectroscopy methods to elucidate chemical structures, particularly where there are overlapping signals from different metabolites. Some advantages of MRS over MRSI are that the former provides a stronger signal in a shorter time frame, and the homogeneity of the magnetic field can be carefully adjusted over a small volume of interest free of any tissue interfaces. However it has been demonstrated that proton MR spectroscopic imaging can be a potential method for preoperative grading of grades II and III gliomas, where significantly lower Cho levels and higher tNAA levels were found in grade II tumors compared to grade III tumors (72). Also one could correlate more thoroughly between data obtained from morphological T2-weighted images, and/or diffusion-weighted images, and MR spectra. Another potential use for MRS/MRSI would be to establish a more accurate tumor margin, which is often underestimated with T2-weighted imaging and/or contrast-enhanced MRI, and contributes to the high recurrence rate of malignant gliomas.
In conclusion, MRS follows processes that are essential during tumor growth, such as the mitotic activity of the glioma cells (tCho/tCr) and necrosis (elevated lipids and decreased tCr). We have shown in this study that MRS was able to distinguish between different metabolic profiles in a number of rodent glioma models that are often considered similar. For instance, if a decrease in NAA and/or tCr is the metabolite criteria to be used, then glioma models GL261, RG2 or C6 should be considered as malignant models (all with grade IV characteristics). Whereas if the lipid or lactate profiles are the metabolite criteria of assessment then only the C6 or GL261 models, respectively, should be considered, based on our results. Some of the glioma models, such as U87, RG2 and 9L, had large standard deviations in some metabolite concentrations, which is a reflection in tumor growth variations in these models. The ENU model was found to be most similar to controls, and differ from C6, GL261, 9L or RG2 models, and therefore should not be used as a malignant model. The GL261 model seemed to differ most from all of the other models, and of all the models assessed in this study it is perhaps the most malignant in nature.
Figure 3.

Representative spectra obtained from the tumor or contralateral brain regions from each glioma model: A control group consisting of primary astrocyte-implanted rats (Astrocytes)(day 14 following intracerebral implantation of cells) and animals bearing ENU (30 weeks of age), C6 (day 15 following intracerebral implantation of cells; all other subsequent models are also days following implantation of cells), 9L/LacZ (day 37), F98 (day 20), RG2 (day 14), U87 (day 16) and GL261 (day 23) gliomas. The metabolites assigned were (1) Lac, (2) Ala, (3) NAA, (4) Gln, (5) Glu, (6) Asp, (7) tCr, (8) tCho, (9) Tau, (10) myo-Ins, and mobile lipid (11) methyl and (12) methylene groups.
Acknowledgments
The authors deeply acknowledge Dr. Yasvir Tesiram (OMRF) for his help in establishing optimal MR parameters, Dr. Molina Mhatre (College of Pharmacy, OUHSC) and Dr. Yujun Pan (OMRF) for their advice regarding the intracerebral cell implantation procedure, as well as Dr. Kenneth Hensley and Ms. Melinda West (OMRF) for helping with the primary astrocyte culture. The authors also want to acknowledge Dr. Dan Brackett (Department of Surgery, OUHSC) for his help regarding the histology staining and Dr. Geza Safrany (Frederic Joliot-Curie National Research Institute for Radiobiology and Radiohygiene, Budapest, Hungary) for the GL261 cells.
Abbreviations
- Ala
alanine
- Asp
aspartate
- CNS
central nervous system
- DMEM
Dulbecco’s modified Eagle’s medium
- EMEM
Eagle’s minimal essential medium
- ENU
ethyl-nitrosourea
- FBS
fetal bovine serum
- FOV
field of view
- GABA
γ-amino butyric acid
- GBM
glioblastoma
- Glc
glucose
- Gln
glutamine
- Glu
glutamate
- Gua
guanosine
- H&E
hematoxylin and eosin
- Ins
myo-inositol
- Lac
lactate
- MM
macromolecules
- NAA
N-acetyl-aspartate
- PRESS
point-resolved spectroscopy
- RARE
rapid acquisition with relaxation enhancement
- Scyllo
scyllo-inositol
- Tau
taurine
- Td
doubling time
- tCho
total choline compounds
- tCr
total creatine compounds
References
- 1.CBTRUS. Statistical report: primary brain tumors in the United States, 2000–2004: Central brain tumor registry of the United States. 2008. pp. 1–62. [Google Scholar]
- 2.Louis DN, Ohgaki H, Wiestler OD, Cavenee WK, Burger PC, Jouvet A, Scheithauer BW, Kleihues P. The 2007 WHO classification of tumours of the central nervous system. Acta neuropathologica. 2007;114:97–109. doi: 10.1007/s00401-007-0243-4. [DOI] [PMC free article] [PubMed] [Google Scholar]
- 3.Gudinaviciene I, Pranys D, Juozaityte E. Impact of morphology and biology on the prognosis of patients with gliomas. Medicina (Kaunas) 2004;40:112–120. [PubMed] [Google Scholar]
- 4.Fan G, Sun B, Wu Z, Guo Q, Guo Y. In vivo single-voxel proton MR spectroscopy in the differentiation of high-grade gliomas and solitary metastases. Clin Radiol. 2004;59:77–85. doi: 10.1016/j.crad.2003.08.006. [DOI] [PubMed] [Google Scholar]
- 5.Vuori K, Kankaanranta L, Hakkinen AM, Gaily E, Valanne L, Granstrom ML, Joensuu H, Blomstedt G, Paetau A, Lundbom N. Low-grade gliomas and focal cortical developmental malformations: differentiation with proton MR spectroscopy. Radiology. 2004;230:703–708. doi: 10.1148/radiol.2303021804. [DOI] [PubMed] [Google Scholar]
- 6.Barbarella G, Ricci R, Pirini G, Tugnoli V, Tosi MR, Bertoluzza A, Calbucci F, Leonardi M, Trevisan C, Eusebi V. In Vivo Single Voxel 1H MRS of Glial Brain Tumors: Correlation with Tissue Histology and In Vitro MRS. Int J Oncol. 1998;12:461–468. doi: 10.3892/ijo.12.2.461. [DOI] [PubMed] [Google Scholar]
- 7.Burtscher IM, Stahlberg F, Holtas S. Proton (1H) MR Spectroscopy for Routine Diagnostic Evaluation of Brain Lesions. Acta Radiol. 1997;38:953–960. doi: 10.1080/02841859709172109. [DOI] [PubMed] [Google Scholar]
- 8.Law M, Cha S, Knopp EA, Johnson G, Arnett J, Litt AW. High-Grade Gliomas and Solitary Metastases: Differentiation by Using Perfusion and Proton Spectroscopic MR Imaging. Radiology. 2002;222:715–721. doi: 10.1148/radiol.2223010558. [DOI] [PubMed] [Google Scholar]
- 9.Kaminogo M, Ishimaru H, Morikawa M, Ochi M, Ushijima R, Tani M, Matsuo Y, Kawakubo J, Shibata S. Diagnostic Potential of Short Echo Time MR Spectroscopy of Gliomas With Single-Voxel and Point-Resolved Spatially Localised Proton Spectroscopy of Brain. Neuroradiology. 2001;43:353–363. doi: 10.1007/s002340000473. [DOI] [PubMed] [Google Scholar]
- 10.Young GS. Advanced MRI of adult brain tumors. Neurologic clinics. 2007;25:947–973. viii. doi: 10.1016/j.ncl.2007.07.010. [DOI] [PubMed] [Google Scholar]
- 11.Bernstein M, Parrent AG. Complications of CT-guided stereotactic biopsy of intra-axial brain lesions. J Neurosurg. 1994;81:165–168. doi: 10.3171/jns.1994.81.2.0165. [DOI] [PubMed] [Google Scholar]
- 12.Soo TM, Bernstein M, Provias J, Tasker R, Lozano A, Guha A. Failed stereotactic biopsy in a series of 518 cases. Stereotactic and functional neurosurgery. 1995;64:183–196. doi: 10.1159/000098747. [DOI] [PubMed] [Google Scholar]
- 13.Alesch F, Armbruster C, Budka H. Diagnostic value of stereotactic biopsy of cerebral lesions in patients with AIDS. Acta neurochirurgica. 1995;134:214–219. doi: 10.1007/BF01417692. [DOI] [PubMed] [Google Scholar]
- 14.Ross B, Bluml S. Magnetic resonance spectroscopy of the human brain. Anat Rec. 2001;265:54–84. doi: 10.1002/ar.1058. [DOI] [PubMed] [Google Scholar]
- 15.Sibtain NA, Howe FA, Saunders DE. The clinical value of proton magnetic resonance spectroscopy in adult brain tumours. Clin Radiol. 2007;62:109–119. doi: 10.1016/j.crad.2006.09.012. [DOI] [PubMed] [Google Scholar]
- 16.Moller-Hartmann W, Herminghaus S, Krings T, Marquardt G, Lanfermann H, Pilatus U, Zanella FE. Clinical Application of Proton Magnetic Resonance Spectroscopy in the Diagnosis of Intracranial Mass Lesions. Neuroradiology. 2002;44:371–381. doi: 10.1007/s00234-001-0760-0. [DOI] [PubMed] [Google Scholar]
- 17.Howe FA, Opstad KS. 1H MR spectroscopy of brain tumours and masses. NMR Biomed. 2003;16:123–131. doi: 10.1002/nbm.822. [DOI] [PubMed] [Google Scholar]
- 18.Terpstra M, High WB, Luo Y, de Graaf RA, Merkle H, Garwood M. Relationships among lactate concentration, blood flow and histologic profiles in rat C6 glioma. NMR Biomed. 1996;9:185–94. doi: 10.1002/(SICI)1099-1492(199608)9:5<185::AID-NBM414>3.0.CO;2-X. [DOI] [PubMed] [Google Scholar]
- 19.Kuesel AC, Sutherland GR, Halliday W, Smith IC. 1H MRS of High Grade Astrocytomas: Mobile Lipid Accumulation in Necrotic Tissue. NMR Biomed. 1994;7:149–155. doi: 10.1002/nbm.1940070308. [DOI] [PubMed] [Google Scholar]
- 20.Barth RF. Rat brain tumor models in experimental neuro-oncology: the 9L, C6, T9, F98, RG2 (D74), RT-2 and CNS-1 gliomas. J Neurooncol. 1998;36:91–102. doi: 10.1023/a:1005805203044. [DOI] [PubMed] [Google Scholar]
- 21.Kish PE, Blaivas M, Strawderman M, Muraszko KM, Ross DA, Ross BD, McMahon G. Magnetic resonance imaging of ethyl-nitrosourea-induced rat gliomas: a model for experimental therapeutics of low-grade gliomas. J Neurooncol. 2001;53:243–257. doi: 10.1023/a:1012222522359. [DOI] [PubMed] [Google Scholar]
- 22.Koestner A. Characterization of N-nitrosourea-induced tumors of the nervous system; their prospective value for studies of neurocarcinogenesis and brain tumor therapy. Toxicologic pathology. 1990;18:186–192. doi: 10.1177/019262339001800124. [DOI] [PubMed] [Google Scholar]
- 23.Grobben B, De Deyn PP, Slegers H. Rat C6 glioma as experimental model system for the study of glioblastoma growth and invasion. Cell Tissue Res. 2002;310:257–270. doi: 10.1007/s00441-002-0651-7. [DOI] [PubMed] [Google Scholar]
- 24.Weizsaecker M, Deen DF, Rosenblum ML, Hoshino T, Gutin PH, Barker M. The 9L Rat Brain Tumor: Description and Application of an Animal Model. J Neurol. 1981;224:183–192. doi: 10.1007/BF00313280. [DOI] [PubMed] [Google Scholar]
- 25.Martens T, Schmidt NO, Eckerich C, Fillbrandt R, Merchant M, Schwall R, Westphal M, Lamszus K. A novel one-armed anti-c-Met antibody inhibits glioblastoma growth in vivo. Clin Cancer Res. 2006;12:6144–6152. doi: 10.1158/1078-0432.CCR-05-1418. [DOI] [PubMed] [Google Scholar]
- 26.Szatmari T, Lumniczky K, Desaknai S, Trajcevski S, Hidvegi EJ, Hamada H, Safrany G. Detailed characterization of the mouse glioma 261 tumor model for experimental glioblastoma therapy. Cancer science. 2006;97:546–553. doi: 10.1111/j.1349-7006.2006.00208.x. [DOI] [PMC free article] [PubMed] [Google Scholar]
- 27.Cheng SY, Huang HJ, Nagane M, Ji XD, Wang D, Shih CC, Arap W, Huang CM, Cavenee WK. Suppression of Glioblastoma Angiogenicity and Tumorigenicity by Inhibition of Endogenous Expression of Vascular Endothelial Growth Factor. Proc Natl Acad Sci U S A. 1996;93:8502–8507. doi: 10.1073/pnas.93.16.8502. [DOI] [PMC free article] [PubMed] [Google Scholar]
- 28.Sibenaller ZA, Etame AB, Ali MM, Barua M, Braun TA, Casavant TL, Ryken TC. Genetic characterization of commonly used glioma cell lines in the rat animal model system. Neurosurg Focus. 2005;19:E1–E9. doi: 10.3171/foc.2005.19.4.2. [DOI] [PubMed] [Google Scholar]
- 29.Plate KH, Breier G, Millauer B, Ullrich A, Risau W. Up-Regulation of Vascular Endothelial Growth Factor and its Cognate Receptors in a Rat Glioma Model of Tumor Angiogenesis. Cancer Res. 1993;53:5822–5827. [PubMed] [Google Scholar]
- 30.Groothuis DR, Fischer JM, Pasternak JF, Blasberg RG, Vick NA, Bigner DD. Regional measurements of blood-to-tissue transport in experimental RG-2 rat gliomas. Cancer Res. 1983;43:3368–3373. [PubMed] [Google Scholar]
- 31.Hensley K, Abdel-Moaty H, Hunter J, Mhatre M, Mou S, Nguyen K, Potapova T, Pye QN, Qi M, Rice H, Stewart C, Stroukoff K, West M. Primary glia expressing the G93A-SOD1 mutation present a neuroinflammatory phenotype and provide a cellular system for studies of glial inflammation. J Neuroinflammation. 2006;3:2–10. doi: 10.1186/1742-2094-3-2. [DOI] [PMC free article] [PubMed] [Google Scholar]
- 32.von Kienlin M, Ziegler A, Le Fur Y, Rubin C, Decorps M, Remy C. 2D-spatial/2D-spectral spectroscopic imaging of intracerebral gliomas in rat brain. Magn Reson Med. 2000;43:211–219. doi: 10.1002/(sici)1522-2594(200002)43:2<211::aid-mrm7>3.0.co;2-a. [DOI] [PubMed] [Google Scholar]
- 33.Rubenstein M, Shaw M, Mirochnik Y, Slobodskoy L, Glick R, Lichtor T, Chou P, Guinan P. In vivo establishment of T98G human glioblastoma. Methods Find Exp Clin Pharmacol. 1999;21:391–393. doi: 10.1358/mf.1999.21.6.541918. [DOI] [PubMed] [Google Scholar]
- 34.Doblas S, Saunders D, Kshirsagar P, Pye Q, Oblander J, Gordon B, Kosanke S, Floyd RA, Towner RA. Phenyl-tert-butylnitrone induces tumor regression and decreases angiogenesis in a C6 rat glioma model. Free Radic Biol Med. 2008;44:63–72. doi: 10.1016/j.freeradbiomed.2007.09.006. [DOI] [PubMed] [Google Scholar]
- 35.Tkáč I, Starčuk Z, Choi I-Y, Gruetter R. In vivo 1H NMR spectroscopy of rat brain at 1 ms echo time. Magn Reson Med. 1999;41:649–656. doi: 10.1002/(sici)1522-2594(199904)41:4<649::aid-mrm2>3.0.co;2-g. [DOI] [PubMed] [Google Scholar]
- 36.Gruetter R. Automatic, localized in vivo adjustment of all first- and second-order shim coils. Magn Reson Med. 1993;29:804–811. doi: 10.1002/mrm.1910290613. [DOI] [PubMed] [Google Scholar]
- 37.Reynolds G, Wilson M, Peet A, Arvanitis TN. An algorithm for the automated quantitation of metabolites in in vitro NMR signals. Magn Reson Med. 2006;56:1211–1219. doi: 10.1002/mrm.21081. [DOI] [PubMed] [Google Scholar]
- 38.Wilson M, Reynolds G, Kauppinen RA, Arvanitis TN, Peet AC. A constrained least-squares approach to the automated quantitation of in vivo (1)H magnetic resonance spectroscopy data. Magn Reson Med. 2011;65:1–12. doi: 10.1002/mrm.22579. [DOI] [PubMed] [Google Scholar]
- 39.Cudalbu C, Cavassila S, Rabeson H, van Ormondt D, Graveron-Demilly D. Influence of measured and simulated basis sets on metabolite concentration estimates. NMR Biomed. 2008;21:627–636. doi: 10.1002/nbm.1234. [DOI] [PubMed] [Google Scholar]
- 40.Pfeuffer J, Tkac I, Provencher SW, Gruetter R. Toward an in vivo neurochemical profile: quantification of 18 metabolites in short-echo-time (1)H NMR spectra of the rat brain. J Magn Reson. 1999;141:104–120. doi: 10.1006/jmre.1999.1895. [DOI] [PubMed] [Google Scholar]
- 41.Auer DP, Gossl C, Schirmer T, Czisch M. Improved analysis of 1H-MR spectra in the presence of mobile lipids. Magn Reson Med. 2001;46:615–618. doi: 10.1002/mrm.1235. [DOI] [PubMed] [Google Scholar]
- 42.Lee S-C, Poptani H, Pickup S, Jenkins WT, Kim S, Koch CJ, Delikatny EJ. Early detection of radiation therapy response in non-Hodgkin’s lymphoma xenografts by in vivo 1H magnetic resonance spectroscopy and imaging. NMR Biomed. 2010;23:624–632. doi: 10.1002/nbm.1505. [DOI] [PubMed] [Google Scholar]
- 43.Doblas S, He T, Saunders D, Pearson J, Hoyle J, Smith N, Lerner M, Towner RA. Glioma morphology and tumor-induced vascular alterations revealed in seven rodent glioma models by in vivo magnetic resonance imaging and angiography. JMRI. 2010;32:267–275. doi: 10.1002/jmri.22263. [DOI] [PMC free article] [PubMed] [Google Scholar]
- 44.Jenkinson MD, Smith TS, Joyce K, Fildes D, du Plessis DG, Warnke PC, Walker C. MRS of oligodendroglial tumors: correlation with histopathology and genetic subtypes. Neurology. 2005;64:2085–2089. doi: 10.1212/01.WNL.0000165998.73779.D9. [DOI] [PubMed] [Google Scholar]
- 45.Dowling C, Bollen AW, Noworolski SM, McDermott MW, Barbaro NM, Day MR, Henry RG, Chang SM, Dillon WP, Nelson SJ, Vigneron DB. Preoperative Proton MR Spectroscopic Imaging of Brain Tumors: Correlation with Histopathologic Analysis of Resection Specimens. AJNR Am J Neuroradiol. 2001;22:604–612. [PMC free article] [PubMed] [Google Scholar]
- 46.Negendank W, Sauter R. Intratumoral lipids in 1H MRS in vivo in brain tumors: experience of the Siemens cooperative clinical trial. Anticancer Res. 1996;16:1533–38. [PubMed] [Google Scholar]
- 47.Rémy C, Arús C, Ziegler A, Lai ES, Moreno A, Le Fur Y, Décorps M. In vivo, ex vivo, and in vitro one- and two-dimensional nuclear magnetic resonance spectroscopy of an intracerebral glioma in rat brain: assignment of resonances. J Neurochem. 1994;62:166–179. doi: 10.1046/j.1471-4159.1994.62010166.x. [DOI] [PubMed] [Google Scholar]
- 48.Wyss M, Kaddurah-Daouk R. Creatine and creatinine metabolism. Physiological reviews. 2000;80:1107–1213. doi: 10.1152/physrev.2000.80.3.1107. [DOI] [PubMed] [Google Scholar]
- 49.Oshiro S, Tsugu H, Komatsu F, Abe H, Onishi H, Ohmura T, Iwaasa M, Sakamoto S, Fukushima T. Quantitative assessment of gliomas by proton magnetic resonance spectroscopy. Anticancer Res. 2007;27:3757–3763. [PubMed] [Google Scholar]
- 50.Catalaa I, Henry R, Dillon WP, Graves EE, McKnight TR, Lu Y, Vigneron DB, Nelson SJ. Perfusion, diffusion and spectroscopy values in newly diagnosed cerebral gliomas. NMR Biomed. 2006;19:463–475. doi: 10.1002/nbm.1059. [DOI] [PubMed] [Google Scholar]
- 51.Chen J, Huang SL, Li T, Chen XL. In vivo research in astrocytoma cell proliferation with 1H-magnetic resonance spectroscopy: correlation with histopathology and immunohistochemistry. Neuroradiology. 2006;48:312–318. doi: 10.1007/s00234-006-0066-3. [DOI] [PubMed] [Google Scholar]
- 52.CBTRUS. Statistical report: primary brain and central nervous system tumors diagnosed in the United States in 2004–2005: Central brain tumor registry of the United States. Hinsdale, IL: 2009. [Google Scholar]
- 53.Struikmans H, Rutgers DH, Jansen GH, Tulleken CA, van der Tweel I, Battermann JJ. Prognostic relevance of cell proliferation markers and DNA-ploidy in gliomas. Acta neurochirurgica. 1998;140:140–147. doi: 10.1007/s007010050075. [DOI] [PubMed] [Google Scholar]
- 54.Moffett JR, Ross B, Arun P, Madhavarao CN, Namboodiri AM. N-Acetylaspartate in the CNS: from neurodiagnostics to neurobiology. Progress in neurobiology. 2007;81:89–131. doi: 10.1016/j.pneurobio.2006.12.003. [DOI] [PMC free article] [PubMed] [Google Scholar]
- 55.Ross BD, Merkle H, Hendrich K, Staewen RS, Garwood M. Spatially localized in vivo 1H magnetic resonance spectroscopy of an intracerebral rat glioma. Magn Reson Med. 1992;23:96–108. doi: 10.1002/mrm.1910230111. [DOI] [PubMed] [Google Scholar]
- 56.Kuesel AC, Sutherland GR, Halliday W, Smith IC. 1H MRS of high grade astrocytomas: mobile lipid accumulation in necrotic tissue. NMR Biomed. 1994;7:149–55. doi: 10.1002/nbm.1940070308. [DOI] [PubMed] [Google Scholar]
- 57.Opstad KS, Griffiths JR, Bell BA, Howe FA. Apparent T2 relaxation times of lipid and macromolecules: a study of high-grade tumor spectra. JMRI. 2008;27:178–84. doi: 10.1002/jmri.21223. [DOI] [PubMed] [Google Scholar]
- 58.Gotsis ED, Fountas K, Kapsalaki E, Toulas P, Peristeris G, Papadakis N. In Vivo Proton MR Spectroscopy: the Diagnostic Possibilities of Lipid Resonances in Brain Tumors. Anticancer Res. 1996;16:1565–1567. [PubMed] [Google Scholar]
- 59.Opstad KS, Ladroue C, Bell BA, Griffiths JR, Howe FA. Linear discriminant analysis of brain tumor 1H MR spectra: a comparison of classification using whole spectra versus metabolite quantification. NMR Biomed. 2007;20:763–770. doi: 10.1002/nbm.1147. [DOI] [PubMed] [Google Scholar]
- 60.Howe FA, Barton SJ, Cudlip SA, Stubbs M, Saunders DE, Murphy M, Wilkins P, Opstad KS, Doyle VL, McLean MA, Bell BA, Griffiths JR. Metabolic profiles of human brain tumors using quantitative in vivo 1H magnetic resonance spectroscopy. Magn Reson Med. 2003;49:223–32. doi: 10.1002/mrm.10367. [DOI] [PubMed] [Google Scholar]
- 61.Murphy PS, Rowland IJ, Viviers L, Brada M, Leach MO, Dzik-Jurasz AS. Could assessment of glioma methylene lipid resonance by in vivo (1)H-MRS be of clinical value? Br J Radiol. 2003;76:459–463. doi: 10.1259/bjr/16316438. [DOI] [PubMed] [Google Scholar]
- 62.Rémy C, Fouilhé N, Barba I, Sam-Lai E, Lahrech H, Cucurella MG, Izquierdo M, Moreno A, Ziegler A, Massarelli R, Décorps M, Arús C. Evidence that mobile lipids detected in rat brain glioma by 1H nuclear magnetic resonance correspond to lipid droplets. Cancer Res. 1997;57:407–14. [PubMed] [Google Scholar]
- 63.Liimatainen T, Hakumäki JM, Kauppinen RA, Ala-Korpela M. Monitoring of gliomas in vivo by diffusion MRI and 1H MRS during gene therapy-induced apoptosis: interrationships between water diffusion and mobile lipids. NMR Biomed. 2009;22:272–279. doi: 10.1002/nbm.1320. [DOI] [PubMed] [Google Scholar]
- 64.Li X, Vigneron DB, Cha S, Graves EE, Crawford F, Chang SM, Nelson SJ. Relationship of MR-derived lactate, mobile lipids, and relative blood volume for gliomas in vivo. AJNR Am J Neuroradiol. 2005;26:760–769. [PMC free article] [PubMed] [Google Scholar]
- 65.Hakumäki JM, Poptani H, Sandmair A-M, Ylä-Herttuala S, Kauppinen RA. 1H MRS detects polyunsaturated fatty acid accumulation during gene therapy of glioma: implications for the in vivo detection of apoptosis. Nature Medicine. 1999;5:1323–27. doi: 10.1038/15279. [DOI] [PubMed] [Google Scholar]
- 66.Liimatainen T, Lehtimäki K, Ala-Korpela M, Hakumäki J. Identification of mobile cholesterol compounds in experimental gliomas by 1H MRS in vivo: effects of ganciclovir-induced apoptosis on lipids. FEBS Letters. 2006;580:4746–50. doi: 10.1016/j.febslet.2006.07.062. [DOI] [PubMed] [Google Scholar]
- 67.Opstad KS, Wright AJ, Bell BA, Griffiths JR, Howe FA. Correlations between in vivo 1H MRS and ex vivo 1H HRMAS metabolite measurements in adult human gliomas. JMRI. 2010;31:289–297. doi: 10.1002/jmri.22039. [DOI] [PubMed] [Google Scholar]
- 68.Barth RF, Kaur B. Rat brain tumor models in experimental neuro-oncology: the C6, 9L, T9, RG2, F98, BT4C, RT-2 and CNS-1 gliomas. J Neurooncol. 2009;94:299–312. doi: 10.1007/s11060-009-9875-7. [DOI] [PMC free article] [PubMed] [Google Scholar]
- 69.Thorsen F, Jirak D, Wang J, Sykova E, Bjerkvig R, Enger PO, van der Kogel A, Hajek M. Two distinct tumor phenotypes isolated from glioblastomas show different MRS characteristics. NMR Biomed. 2008;21:830–838. doi: 10.1002/nbm.1263. [DOI] [PubMed] [Google Scholar]
- 70.Gyngell ML, Els T, Hoehn-Berlage M, Hossmann KA. Proton MR spectroscopy of experimental brain tumors in vivo. Acta Neurochir Suppl (Wien) 1994;60:350–2. doi: 10.1007/978-3-7091-9334-1_94. [DOI] [PubMed] [Google Scholar]
- 71.Flynn JR, Wang L, Gillespie DL, Stoddard GJ, Reid JK, Owens J, Ellsworth GB, Salzman KL, Kinney AY, Jensen RL. Hypoxia-regulated protein expression, patient characteristics, and preoperative imaging as predictors of survival in adults with glioblastoma multiforme. Cancer. 2008;113:1032–42. doi: 10.1002/cncr.23678. [DOI] [PMC free article] [PubMed] [Google Scholar]
- 72.Stadlbauer A, Gruber S, Nimsky C, Fahlbusch R, Hammen T, Buslei R, Tomandl B, Moser E, Ganslandt O. Preoperative grading of gliomas by using metabolite quantification with high-spatial-resolution proton MR spectroscopic imaging. Radiology. 2006;238:958–969. doi: 10.1148/radiol.2382041896. [DOI] [PubMed] [Google Scholar]