

The connection between tissue selection forces and cellular properties represents a strong potential bridge between medical images and pathologic observations.
Abstract
Cancer therapy, even when highly targeted, typically fails because of the remarkable capacity of malignant cells to evolve effective adaptations. These evolutionary dynamics are both a cause and a consequence of cancer system heterogeneity at many scales, ranging from genetic properties of individual cells to large-scale imaging features. Tumors of the same organ and cell type can have remarkably diverse appearances in different patients. Furthermore, even within a single tumor, marked variations in imaging features, such as necrosis or contrast enhancement, are common. Similar spatial variations recently have been reported in genetic profiles. Radiologic heterogeneity within tumors is usually governed by variations in blood flow, whereas genetic heterogeneity is typically ascribed to random mutations. However, evolution within tumors, as in all living systems, is subject to Darwinian principles; thus, it is governed by predictable and reproducible interactions between environmental selection forces and cell phenotype (not genotype). This link between regional variations in environmental properties and cellular adaptive strategies may permit clinical imaging to be used to assess and monitor intratumoral evolution in individual patients. This approach is enabled by new methods that extract, report, and analyze quantitative, reproducible, and mineable clinical imaging data. However, most current quantitative metrics lack spatialness, expressing quantitative radiologic features as a single value for a region of interest encompassing the whole tumor. In contrast, spatially explicit image analysis recognizes that tumors are heterogeneous but not well mixed and defines regionally distinct habitats, some of which appear to harbor tumor populations that are more aggressive and less treatable than others. By identifying regional variations in key environmental selection forces and evidence of cellular adaptation, clinical imaging can enable us to define intratumoral Darwinian dynamics before and during therapy. Advances in image analysis will place clinical imaging in an increasingly central role in the development of evolution-based patient-specific cancer therapy.
© RSNA, 2013
Introduction
Cancers are heterogeneous across a wide range of temporal and spatial scales. Morphologic heterogeneity between and within cancers is readily apparent in clinical imaging, and subjective descriptors of these differences, such as necrotic, spiculated, and enhancing, are common in the radiology lexicon. In the past several years, radiology research has increasingly focused on quantifying these imaging variations in an effort to understand their clinical and biologic implications (1,2). In parallel, technical advances now permit extensive molecular characterization of tumor cells in individual patients. This has led to increasing emphasis on personalized cancer therapy, in which treatment is based on the presence of specific molecular targets (3). However, recent studies (4,5) have shown that multiple genetic subpopulations coexist within cancers, reflecting extensive intratumoral somatic evolution. This heterogeneity is a clear barrier to therapy based on molecular targets, since the identified targets do not always represent the entire population of tumor cells in a patient (6,7). It is ironic that cancer, a disease extensively and primarily analyzed genetically, is also the most genetically flexible of all diseases and, therefore, least amenable to such an approach.
Genetic variations in tumors are typically ascribed to a mutator phenotype that generates new clones, some of which expand into large populations (8). However, although identification of genotypes is of substantial interest, it is insufficient for complete characterization of tumor dynamics because evolution is governed by the interactions of environmental selection forces with the phenotypic, not genotypic, properties of populations as shown, for example, by evolutionary convergence to identical phenotypes among cave fish even when they are from different species (9–11). This connection between tissue selection forces and cellular properties has the potential to provide a strong bridge between medical imaging and the cellular and molecular properties of cancers.
We postulate that differences within tumors at different spatial scales (ie, at the radiologic, cellular, and molecular [genetic] levels) are related. Tumor characteristics observable at clinical imaging reflect molecular-, cellular-, and tissue-level dynamics; thus, they may be useful in understanding the underlying evolving biology in individual patients. A challenge is that such mapping across spatial and temporal scales requires not only objective reproducible metrics for imaging features but also a theoretical construct that bridges those scales (Fig 1).
Figure 1a:
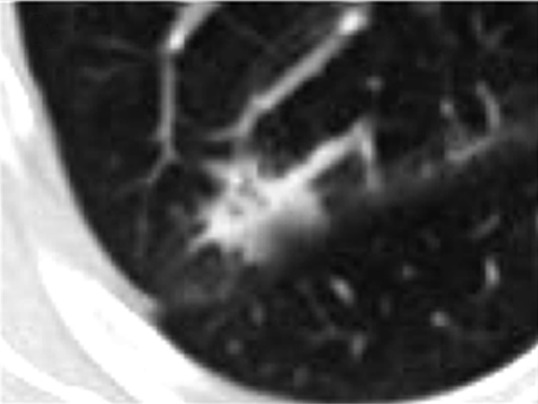
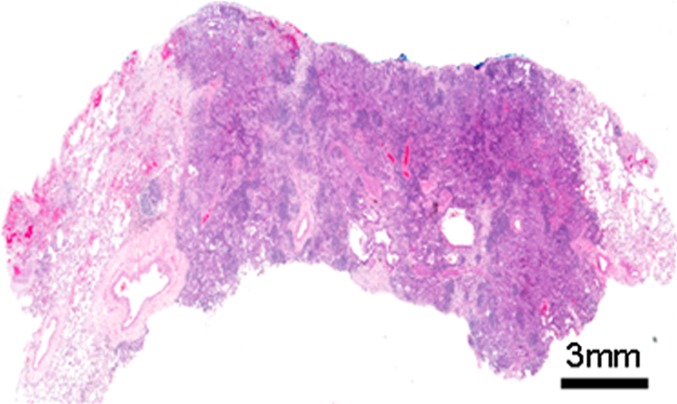
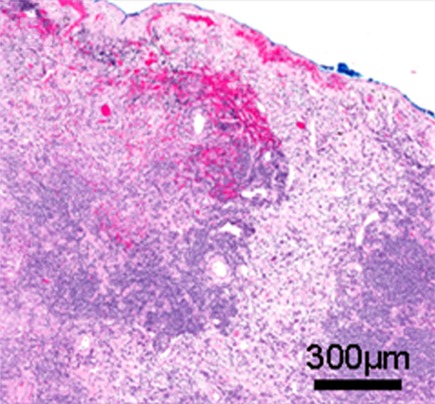
(a) Computed tomographic (CT) scan of right upper lobe lung cancer in a 50-year-old woman. (b) Isoattenuation map shows regional heterogeneity at the tissue scale (measured in centimeters). (c, d) Whole-slide digital images (original magnification, ×3) of a histologic slice of the same tumor at the mesoscopic scale (measured in millimeters) (c) coupled with a masked image of regional morphologic differences showing spatial heterogeneity (d). (e) Subsegment of the whole slide image shows the microscopic scale (measured in micrometers) (original magnification, ×50). (f) Pattern recognition masked image shows regional heterogeneity. In a, the CT image of non–small cell lung cancer can be analyzed to display gradients of attenuation, which reveals heterogeneous and spatially distinct environments (b). Histologic images in the same patient (c, e) reveal heterogeneities in tissue structure and density on the same scale as seen in the CT images. These images can be analyzed at much higher definition to identify differences in morphologies of individual cells (3), and these analyses reveal clusters of cells with similar morphologic features (d, f). An important goal of radiomics is to bridge radiologic data with cellular and molecular characteristics observed microscopically.
Figure 1b:

(a) Computed tomographic (CT) scan of right upper lobe lung cancer in a 50-year-old woman. (b) Isoattenuation map shows regional heterogeneity at the tissue scale (measured in centimeters). (c, d) Whole-slide digital images (original magnification, ×3) of a histologic slice of the same tumor at the mesoscopic scale (measured in millimeters) (c) coupled with a masked image of regional morphologic differences showing spatial heterogeneity (d). (e) Subsegment of the whole slide image shows the microscopic scale (measured in micrometers) (original magnification, ×50). (f) Pattern recognition masked image shows regional heterogeneity. In a, the CT image of non–small cell lung cancer can be analyzed to display gradients of attenuation, which reveals heterogeneous and spatially distinct environments (b). Histologic images in the same patient (c, e) reveal heterogeneities in tissue structure and density on the same scale as seen in the CT images. These images can be analyzed at much higher definition to identify differences in morphologies of individual cells (3), and these analyses reveal clusters of cells with similar morphologic features (d, f). An important goal of radiomics is to bridge radiologic data with cellular and molecular characteristics observed microscopically.
Figure 1c:
(a) Computed tomographic (CT) scan of right upper lobe lung cancer in a 50-year-old woman. (b) Isoattenuation map shows regional heterogeneity at the tissue scale (measured in centimeters). (c, d) Whole-slide digital images (original magnification, ×3) of a histologic slice of the same tumor at the mesoscopic scale (measured in millimeters) (c) coupled with a masked image of regional morphologic differences showing spatial heterogeneity (d). (e) Subsegment of the whole slide image shows the microscopic scale (measured in micrometers) (original magnification, ×50). (f) Pattern recognition masked image shows regional heterogeneity. In a, the CT image of non–small cell lung cancer can be analyzed to display gradients of attenuation, which reveals heterogeneous and spatially distinct environments (b). Histologic images in the same patient (c, e) reveal heterogeneities in tissue structure and density on the same scale as seen in the CT images. These images can be analyzed at much higher definition to identify differences in morphologies of individual cells (3), and these analyses reveal clusters of cells with similar morphologic features (d, f). An important goal of radiomics is to bridge radiologic data with cellular and molecular characteristics observed microscopically.
Figure 1d:

(a) Computed tomographic (CT) scan of right upper lobe lung cancer in a 50-year-old woman. (b) Isoattenuation map shows regional heterogeneity at the tissue scale (measured in centimeters). (c, d) Whole-slide digital images (original magnification, ×3) of a histologic slice of the same tumor at the mesoscopic scale (measured in millimeters) (c) coupled with a masked image of regional morphologic differences showing spatial heterogeneity (d). (e) Subsegment of the whole slide image shows the microscopic scale (measured in micrometers) (original magnification, ×50). (f) Pattern recognition masked image shows regional heterogeneity. In a, the CT image of non–small cell lung cancer can be analyzed to display gradients of attenuation, which reveals heterogeneous and spatially distinct environments (b). Histologic images in the same patient (c, e) reveal heterogeneities in tissue structure and density on the same scale as seen in the CT images. These images can be analyzed at much higher definition to identify differences in morphologies of individual cells (3), and these analyses reveal clusters of cells with similar morphologic features (d, f). An important goal of radiomics is to bridge radiologic data with cellular and molecular characteristics observed microscopically.
Figure 1e:
(a) Computed tomographic (CT) scan of right upper lobe lung cancer in a 50-year-old woman. (b) Isoattenuation map shows regional heterogeneity at the tissue scale (measured in centimeters). (c, d) Whole-slide digital images (original magnification, ×3) of a histologic slice of the same tumor at the mesoscopic scale (measured in millimeters) (c) coupled with a masked image of regional morphologic differences showing spatial heterogeneity (d). (e) Subsegment of the whole slide image shows the microscopic scale (measured in micrometers) (original magnification, ×50). (f) Pattern recognition masked image shows regional heterogeneity. In a, the CT image of non–small cell lung cancer can be analyzed to display gradients of attenuation, which reveals heterogeneous and spatially distinct environments (b). Histologic images in the same patient (c, e) reveal heterogeneities in tissue structure and density on the same scale as seen in the CT images. These images can be analyzed at much higher definition to identify differences in morphologies of individual cells (3), and these analyses reveal clusters of cells with similar morphologic features (d, f). An important goal of radiomics is to bridge radiologic data with cellular and molecular characteristics observed microscopically.
Figure 1f:

(a) Computed tomographic (CT) scan of right upper lobe lung cancer in a 50-year-old woman. (b) Isoattenuation map shows regional heterogeneity at the tissue scale (measured in centimeters). (c, d) Whole-slide digital images (original magnification, ×3) of a histologic slice of the same tumor at the mesoscopic scale (measured in millimeters) (c) coupled with a masked image of regional morphologic differences showing spatial heterogeneity (d). (e) Subsegment of the whole slide image shows the microscopic scale (measured in micrometers) (original magnification, ×50). (f) Pattern recognition masked image shows regional heterogeneity. In a, the CT image of non–small cell lung cancer can be analyzed to display gradients of attenuation, which reveals heterogeneous and spatially distinct environments (b). Histologic images in the same patient (c, e) reveal heterogeneities in tissue structure and density on the same scale as seen in the CT images. These images can be analyzed at much higher definition to identify differences in morphologies of individual cells (3), and these analyses reveal clusters of cells with similar morphologic features (d, f). An important goal of radiomics is to bridge radiologic data with cellular and molecular characteristics observed microscopically.
To promote the development and implementation of quantitative imaging methods, protocols, and software tools, the National Cancer Institute has established the Quantitative Imaging Network. One goal of this program is to identify reproducible quantifiable imaging features of tumors that will permit data mining and explicit examination of links between the imaging findings and the underlying molecular and cellular characteristics of the tumors. In the quest for more personalized cancer treatments, these quantitative radiologic features potentially represent nondestructive temporally and spatially variable predictive and prognostic biomarkers that readily can be obtained in each patient before, during, and after therapy.
Quantitative imaging requires computational technologies that can be used to reliably extract mineable data from radiographic images. This feature information can then be correlated with molecular and cellular properties by using bioinformatics methods. Most existing methods are agnostic and focus on statistical descriptions of existing data, without presupposing the existence of specific relationships. Although this is a valid approach, a more profound understanding of quantitative imaging information may be obtained with a theoretical hypothesis-driven framework. Such models use links between observable tumor characteristics and microenvironmental selection factors to make testable predictions about emergent phenotypes. One such theoretical framework is the developing paradigm of cancer as an ecologic and evolutionary process.
For decades, landscape ecologists have studied the effects of heterogeneity in physical features on interactions between populations of organisms and their environments, often by using observation and quantification of images at various scales (12–14). We propose that analytic models of this type can easily be applied to radiologic studies of cancer to uncover underlying molecular, cellular, and microenvironmental drivers of tumor behavior and specifically, tumor adaptations and responses to therapy (15).
In this article, we review recent developments in quantitative imaging metrics and discuss how they correlate with underlying genetic data and clinical outcomes. We then introduce the concept of using ecology and evolutionary models for spatially explicit image analysis as an exciting potential avenue of investigation.
Quantitative Imaging and Radiomics
In patients with cancer, quantitative measurements are commonly limited to measurement of tumor size with one-dimensional (Response Evaluation Criteria in Solid Tumors [or RECIST]) or two-dimensional (World Health Organization) long-axis measurements (16). These measures do not reflect the complexity of tumor morphology or behavior, and in many cases, changes in these measures are not predictive of therapeutic benefit (17). In contrast, radiomics (18) is a high-throughput process in which a large number of shape, edge, and texture imaging features are extracted, quantified, and stored in databases in an objective, reproducible, and mineable form (Figs 1, 2). Once transformed into a quantitative form, radiologic tumor properties can be linked to underlying genetic alterations (the field is called radiogenomics) (19–21) and to medical outcomes (22–27). Researchers are currently working to develop both a standardized lexicon to describe tumor features (28,29) and a standard method to convert these descriptors into quantitative mineable data (30,31) (Fig 3).
Figure 2:
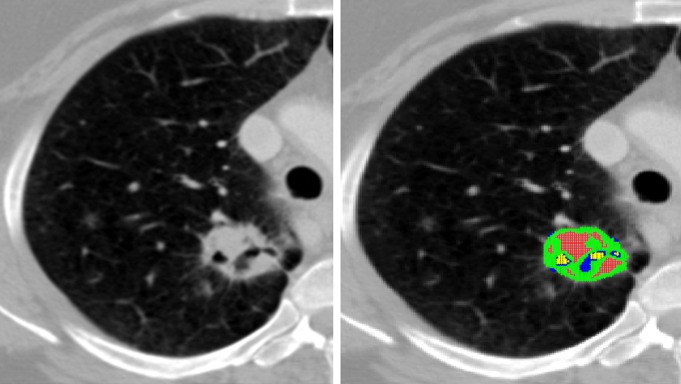
Contrast-enhanced CT scans show non–small cell lung cancer (left) and corresponding cluster map (right). Subregions within the tumor are identified by clustering pixels based on the attenuation of pixels and their cumulative standard deviation across the region. While the entire region of interest of the tumor, lacking the spatial information, yields a weighted mean attenuation of 859.5 HU with a large and skewed standard deviation of 243.64 HU, the identified subregions have vastly different statistics. Mean attenuation was 438.9 HU ± 45 in the blue subregion, 210.91 HU ± 79 in the yellow subregion, and 1077.6 HU ± 18 in the red subregion.
Figure 3:
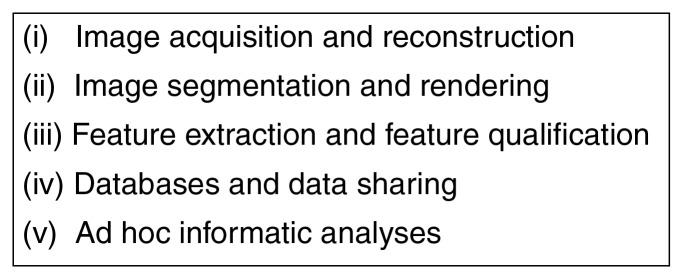
Chart shows the five processes in radiomics.
Several recent articles underscore the potential power of feature analysis. After manually extracting more than 100 CT image features, Segal and colleagues found that a subset of 14 features predicted 80% of the gene expression pattern in patients with hepatocellular carcinoma (21). A similar extraction of features from contrast agent–enhanced magnetic resonance (MR) images of glioblastoma was used to predict immunohistochemically identified protein expression patterns (22). Other radiomic features, such as texture, can be used to predict response to therapy in patients with renal cancer (32) and prognosis in those with metastatic colon cancer (33).
These pioneering studies were relatively small because the image analysis was performed manually, and the studies were consequently underpowered. Thus, recent work in radiomics has focused on technical developments that permit automated extraction of image features with the potential for high throughput. Such methods, which rely heavily on novel machine learning algorithms, can more completely cover the range of quantitative features that can describe tumor heterogeneity, such as texture, shape, or margin gradients or, importantly, different environments, or niches, within the tumors.
Generally speaking, texture in a biomedical image is quantified by identifying repeating patterns. Texture analyses fall into two broad categories based on the concepts of first- and second-order spatial statistics. First-order statistics are computed by using individual pixel values, and no relationships between neighboring pixels are assumed or evaluated. Texture analysis methods based on first-order statistics usually involve calculating cumulative statistics of pixel values and their histograms across the region of interest. Second-order statistics, on the other hand, are used to evaluate the likelihood of observing spatially correlated pixels (34). Hence, second-order texture analyses focus on the detection and quantification of nonrandom distributions of pixels throughout the region of interest.
The technical developments that permit second-order texture analysis in tumors by using regional enhancement patterns on dynamic contrast-enhanced MR images were reviewed recently (35). One such technique that is used to measure heterogeneity of contrast enhancement uses the Factor Analysis of Medical Image Sequences (or FAMIS) algorithm, which divides tumors into regions based on their patterns of enhancement (36). Factor Analysis of Medical Image Sequences–based analyses yielded better prognostic information when compared with region of interest–based methods in numerous cancer types (19–21,37–39), and they were a precursor to the Food and Drug Administration–approved three-time-point method (40). A number of additional promising methods have been developed. Rose and colleagues showed that a structured fractal-based approach to texture analysis improved differentiation between low- and high-grade brain cancers by orders of magnitude (41). Ahmed and colleagues used gray level co-occurrence matrix analyses of dynamic contrast-enhanced images to distinguish benign from malignant breast masses with high diagnostic accuracy (area under the receiver operating characteristic curve, 0.92) (26). Others have shown that Minkowski functional structured methods that convolve images with differently kernelled masks can be used to distinguish subtle differences in contrast enhancement patterns and can enable significant differentiation between treatment groups (42).
It is not surprising that analyses of heterogeneity in enhancement patterns can improve diagnosis and prognosis, as this heterogeneity is fundamentally based on perfusion deficits, which generate significant microenvironmental selection pressures. However, texture analysis is not limited to enhancement patterns. For example, measures of heterogeneity in diffusion-weighted MR images can reveal differences in cellular density in tumors, which can be matched to histologic findings (43). Measures of heterogeneity in T1- and T2-weighted images can be used to distinguish benign from malignant soft-tissue masses (23). CT-based texture features have been shown to be highly significant independent predictors of survival in patients with non–small cell lung cancer (24).
Texture analyses can also be applied to positron emission tomographic (PET) data, where they can provide information about metabolic heterogeneity (25,26). In a recent study, Nair and colleagues identified 14 quantitative PET imaging features that correlated with gene expression (19). This led to an association of metagene clusters to imaging features and yielded prognostic models with hazard ratios near 6. In a study of esophageal cancer, in which 38 quantitative features describing fluorodeoxyglucose uptake were extracted, measures of metabolic heterogeneity at baseline enabled prediction of response with significantly higher sensitivity than any whole region of interest standardized uptake value measurement (22). It is also notable that these extensive texture-based features are generally more reproducible than simple measures of the standardized uptake value (27), which can be highly variable in a clinical setting (44).
Spatially Explicit Analysis of Tumor Heterogeneity
Although radiomic analyses have shown high prognostic power, they are not inherently spatially explicit. Quantitative border, shape, and texture features are typically generated over a region of interest that comprises the entire tumor (45). This approach implicitly assumes that tumors are heterogeneous but well mixed. However, spatially explicit subregions of cancers are readily apparent on contrast-enhanced MR or CT images, as perfusion can vary markedly within the tumor, even over short distances, with changes in tumor cell density and necrosis.
An example is shown in Figure 2, which shows a contrast-enhanced CT scan of non–small cell lung cancer. Note that there are many subregions within this tumor that can be identified with attenuation gradient (attenuation per centimeter) edge detection algorithms. Each subregion has a characteristic quantitative attenuation, with a narrow standard deviation, whereas the mean attenuation over the entire region of interest is a weighted average of the values across all subregions, with a correspondingly large and skewed distribution. We contend that these subregions represent distinct habitats within the tumor, each with a distinct set of environmental selection forces.
These observations, along with the recent identification of regional variations in the genetic properties of tumor cells, indicate the need to abandon the conceptual model of cancers as bounded organlike structures. Rather than a single self-organized system, cancers represent a patchwork of habitats, each with a unique set of environmental selection forces and cellular evolution strategies. For example, regions of the tumor that are poorly perfused can be populated by only those cells that are well adapted to low-oxygen, low-glucose, and high-acid environmental conditions. Such adaptive responses to regional heterogeneity result in microenvironmental selection and hence, emergence of genetic variations within tumors. The concept of adaptive response is an important departure from the traditional view that genetic heterogeneity is the product of increased random mutations, which implies that molecular heterogeneity is fundamentally unpredictable and, therefore, chaotic. The Darwinian model proposes that genetic heterogeneity is the result of a predictable and reproducible selection of successful adaptive strategies to local microenvironmental conditions.
Current cross-sectional imaging modalities can be used to identify regional variations in selection forces by using contrast-enhanced, cell density–based, or metabolic features. Clinical imaging can also be used to identify evidence of cellular adaptation. For example, if a region of low perfusion on a contrast-enhanced study is necrotic, then an adaptive population is absent or minimal. However, if the poorly perfused area is cellular, then there is presumptive evidence of an adapted proliferating population. While the specific genetic properties of this population cannot be determined, the phenotype of the adaptive strategy is predictable since the environmental conditions are more or less known. Thus, standard medical images can be used to infer specific emergent phenotypes and, with ongoing research, these phenotypes can be associated with underlying genetic changes.
This area of investigation will likely be challenging. As noted earlier, the most obvious spatially heterogeneous imaging feature in tumors is perfusion heterogeneity on contrast-enhanced CT or MR images. It generally has been assumed that the links between contrast enhancement, blood flow, perfusion, and tumor cell characteristics are straightforward. That is, tumor regions with decreased blood flow will exhibit low perfusion, low cell density, and high necrosis. In reality, however, the dynamics are actually much more complex. As shown in Figure 4, when using multiple superimposed sequences from MR imaging of malignant gliomas, regions of tumor that are poorly perfused on contrast-enhanced T1-weighted images may exhibit areas of low or high water content on T2-weighted images and low or high diffusion on diffusion-weighted images. Thus, high or low cell densities can coexist in poorly perfused volumes, creating perfusion-diffusion mismatches. Regions with poor perfusion with high cell density are of particular clinical interest because they represent a cell population that is apparently adapted to microenvironmental conditions associated with poor perfusion. The associated hypoxia, acidosis, and nutrient deprivation select for cells that are resistant to apoptosis and thus are likely to be resistant to therapy (46,47).
Figure 4:

Left: Contrast-enhanced T1 image from subject TCGA-02-0034 in The Cancer Genome Atlas–Glioblastoma Multiforme repository of MR volumes of glioblastoma multiforme cases. Right: Spatial distribution of MR imaging–defined habitats within the tumor. The blue region (low T1 postgadolinium, low fluid-attenuated inversion recovery) is particularly notable because it presumably represents a habitat with low blood flow but high cell density, indicating a population presumably adapted to hypoxic acidic conditions.
Furthermore, other selection forces not related to perfusion are likely to be present within tumors. For example, evolutionary models suggest that cancer cells, even in stable microenvironments, tend to speciate into “engineers” that maximize tumor cell growth by promoting angiogenesis and “pioneers” that proliferate by invading normal issue and co-opting the blood supply. These invasive tumor phenotypes can exist only at the tumor edge, where movement into a normal tissue microenvironment can be rewarded by increased proliferation. This evolutionary dynamic may contribute to distinct differences between the tumor edges and the tumor cores, which frequently can be seen at analysis of cross-sectional images (Fig 5).
Figure 5a:
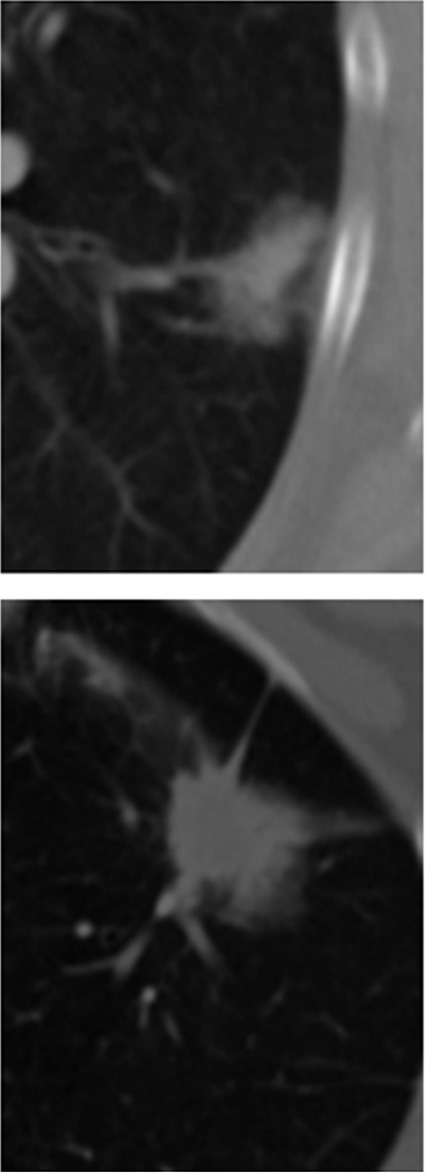
(a) CT images obtained with conventional entropy filtering in two patients with non–small cell lung cancer with no apparent textural differences show similar entropy values across all sections. (b) Contour plots obtained after the CT scans were convolved with the entropy filter. Further subdividing each section in the tumor stack into tumor edge and core regions (dotted black contour) reveals varying textural behavior across sections. Two distinct patterns have emerged, and preliminary analysis shows that the change of mean entropy value between core and edge regions correlates negatively with survival.
Figure 5b:
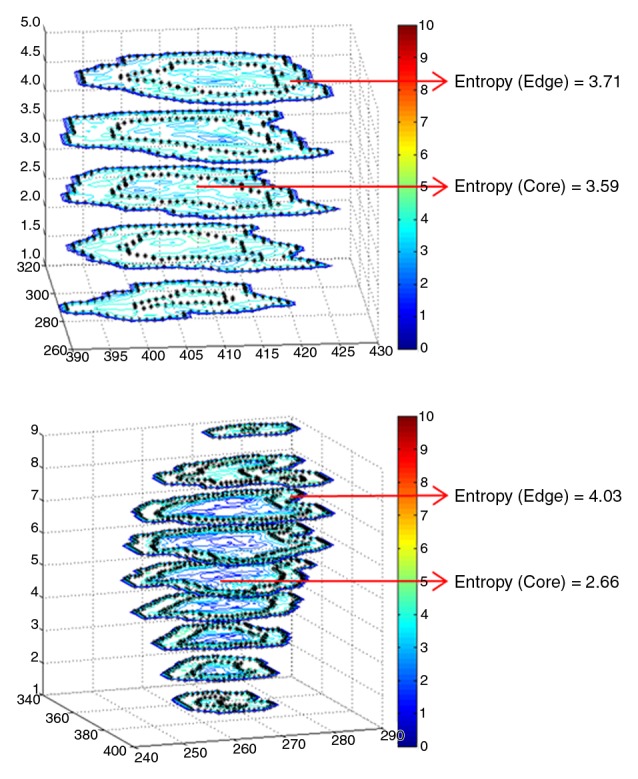
(a) CT images obtained with conventional entropy filtering in two patients with non–small cell lung cancer with no apparent textural differences show similar entropy values across all sections. (b) Contour plots obtained after the CT scans were convolved with the entropy filter. Further subdividing each section in the tumor stack into tumor edge and core regions (dotted black contour) reveals varying textural behavior across sections. Two distinct patterns have emerged, and preliminary analysis shows that the change of mean entropy value between core and edge regions correlates negatively with survival.
Interpretation of the subsegmentation of tumors will require computational models to understand and predict the complex nonlinear dynamics that lead to heterogeneous combinations of radiographic features. We have exploited ecologic methods and models to investigate regional variations in cancer environmental and cellular properties that lead to specific imaging characteristics. Conceptually, this approach assumes that regional variations in tumors can be viewed as a coalition of distinct ecologic communities or habitats of cells in which the environment is governed, at least to first order, by variations in vascular density and blood flow. The environmental conditions that result from alterations in blood flow, such as hypoxia, acidosis, immune response, growth factors, and glucose, represent evolutionary selection forces that give rise to local-regional phenotypic adaptations. Phenotypic alterations can result from epigenetic, genetic, or chromosomal rearrangements, and these in turn will affect prognosis and response to therapy. Changes in habitats or the relative abundance of specific ecologic communities over time and in response to therapy may be a valuable metric with which to measure treatment efficacy and emergence of resistant populations.
Emerging Strategies for Tumor Habitat Characterization
A method for converting images to spatially explicit tumor habitats is shown in Figure 4. Here, three-dimensional MR imaging data sets from a glioblastoma are segmented. Each voxel in the tumor is defined by a scale that includes its image intensity in different sequences. In this case, the imaging sets are from (a) a contrast-enhanced T1 sequence, (b) a fast spin-echo T2 sequence, and (c) a fluid-attenuated inversion-recovery (or FLAIR) sequence. Voxels in each sequence can be defined as high or low based on their value compared with the mean signal value. By using just two sequences, a contrast-enhanced T1 sequence and a fluid-attenuated inversion-recovery sequence, we can define four habitats: high or low postgadolinium T1 divided into high or low fluid-attenuated inversion recovery. When these voxel habitats are projected into the tumor volume, we find they cluster into spatially distinct regions. These habitats can be evaluated both in terms of their relative contributions to the total tumor volume and in terms of their interactions with each other, based on the imaging characteristics at the interfaces between regions. Similar spatially explicit analysis can be performed with CT scans (Fig 5).
Analysis of spatial patterns in cross-sectional images will ultimately require methods that bridge spatial scales from microns to millimeters. One possible method is a general class of numeric tools that is already widely used in terrestrial and marine ecology research to link species occurrence or abundance with environmental parameters. Species distribution models (48–51) are used to gain ecologic and evolutionary insights and to predict distributions of species or morphs across landscapes, sometimes extrapolating in space and time. They can easily be used to link the environmental selection forces in MR imaging-defined habitats to the evolutionary dynamics of cancer cells.
Summary
Imaging can have an enormous role in the development and implementation of patient-specific therapies in cancer. The achievement of this goal will require new methods that expand and ultimately replace the current subjective qualitative assessments of tumor characteristics. The need for quantitative imaging has been clearly recognized by the National Cancer Institute and has resulted in formation of the Quantitative Imaging Network. A critical objective of this imaging consortium is to use objective, reproducible, and quantitative feature metrics extracted from clinical images to develop patient-specific imaging-based prognostic models and personalized cancer therapies.
It is increasingly clear that tumors are not homogeneous organlike systems. Rather, they contain regional coalitions of ecologic communities that consist of evolving cancer, stroma, and immune cell populations. The clinical consequence of such niche variations is that spatial and temporal variations of tumor phenotypes will inevitably evolve and present substantial challenges to targeted therapies. Hence, future research in cancer imaging will likely focus on spatially explicit analysis of tumor regions.
Clinical imaging can readily characterize regional variations in blood flow, cell density, and necrosis. When viewed in a Darwinian evolutionary context, these features reflect regional variations in environmental selection forces and can, at least in principle, be used to predict the likely adaptive strategies of the local cancer population. Hence, analyses of radiologic data can be used to inform evolutionary models and then can be mapped to regional population dynamics. Ecologic and evolutionary principles may provide a theoretical framework to link imaging to the cellular and molecular features of cancer cells and ultimately lead to a more comprehensive understanding of specific cancer biology in individual patients.
Essentials.
• Marked heterogeneity in genetic properties of different cells in the same tumor is typical and reflects ongoing intratumoral evolution.
• Evolution within tumors is governed by Darwinian dynamics, with identifiable environmental selection forces that interact with phenotypic (not genotypic) properties of tumor cells in a predictable and reproducible manner; clinical imaging is uniquely suited to measure temporal and spatial heterogeneity within tumors that is both a cause and a consequence of this evolution.
• Subjective radiologic descriptors of cancers are inadequate to capture this heterogeneity and must be replaced by quantitative metrics that enable statistical comparisons between features describing intratumoral heterogeneity and clinical outcomes and molecular properties.
• Spatially explicit mapping of tumor regions, for example by superimposing multiple imaging sequences, may permit patient-specific characterization of intratumoral evolution and ecology, leading to patient- and tumor-specific therapies.
• We summarize current information on quantitative analysis of radiologic images and propose future quantitative imaging must become spatially explicit to identify intratumoral habitats before and during therapy.
Disclosures of Conflicts of Interest: R.A.G. No relevant conflicts of interest to disclose. O.G. No relevant conflicts of interest to disclose. R.J.G. No relevant conflicts of interest to disclose.
Acknowledgments
The authors thank Mark Lloyd, MS; Joel Brown, PhD; Dmitry Goldgoff, PhD; and Larry Hall, PhD, for their input to image analysis and for their lively and informative discussions.
Received December 18, 2012; revision requested February 5, 2013; revision received March 11; accepted April 9; final version accepted April 29.
Funding: This research was supported by the National Institutes of Health (grants U54CA143970-01, U01CA143062; R01CA077575, and R01CA170595).
References
- 1.Kurland BF, Gerstner ER, Mountz JM, et al. Promise and pitfalls of quantitative imaging in oncology clinical trials. Magn Reson Imaging 2012;30(9):1301–1312 [DOI] [PMC free article] [PubMed] [Google Scholar]
- 2.Levy MA, Freymann JB, Kirby JS, et al. Informatics methods to enable sharing of quantitative imaging research data. Magn Reson Imaging 2012;30(9):1249–1256 [DOI] [PMC free article] [PubMed] [Google Scholar]
- 3.Mirnezami R, Nicholson J, Darzi A. Preparing for precision medicine. N Engl J Med 2012;366(6):489–491 [DOI] [PubMed] [Google Scholar]
- 4.Yachida S, Jones S, Bozic I, et al. Distant metastasis occurs late during the genetic evolution of pancreatic cancer. Nature 2010;467(7319):1114–1117 [DOI] [PMC free article] [PubMed] [Google Scholar]
- 5.Gerlinger M, Rowan AJ, Horswell S, et al. Intratumor heterogeneity and branched evolution revealed by multiregion sequencing. N Engl J Med 2012;366(10):883–892 [DOI] [PMC free article] [PubMed] [Google Scholar]
- 6.Gerlinger M, Swanton C. How Darwinian models inform therapeutic failure initiated by clonal heterogeneity in cancer medicine. Br J Cancer 2010;103(8):1139–1143 [DOI] [PMC free article] [PubMed] [Google Scholar]
- 7.Kern SE. Why your new cancer biomarker may never work: recurrent patterns and remarkable diversity in biomarker failures. Cancer Res 2012;72(23):6097–6101 [DOI] [PMC free article] [PubMed] [Google Scholar]
- 8.Nowell PC. The clonal evolution of tumor cell populations. Science 1976;194(4260):23–28 [DOI] [PubMed] [Google Scholar]
- 9.Greaves M, Maley CC. Clonal evolution in cancer. Nature 2012;481(7381):306–313 [DOI] [PMC free article] [PubMed] [Google Scholar]
- 10.Vincent TL, Brown JS. Evolutionary game theory, natural selection and Darwinian dynamics. Cambridge, England: Cambridge University Press, 2005 [Google Scholar]
- 11.Gatenby RA, Gillies RJ. A microenvironmental model of carcinogenesis. Nat Rev Cancer 2008;8(1):56–61 [DOI] [PubMed] [Google Scholar]
- 12.Bowers MA, Matter SF. Landscape ecology of mammals: relationships between density and patch size. J Mammal 1997;78(4):999–1013 [Google Scholar]
- 13.Dorner BK, Lertzman KP, Fall J. Landscape pattern in topographically complex landscapes: issues and techniques for analysis. Landscape Ecol 2002;17(8):729–743 [Google Scholar]
- 14.González-García I, Solé RV, Costa J. Metapopulation dynamics and spatial heterogeneity in cancer. Proc Natl Acad Sci U S A 2002;99(20):13085–13089 [DOI] [PMC free article] [PubMed] [Google Scholar]
- 15.Patel LR, Nykter M, Chen K, Zhang W. Cancer genome sequencing: understanding malignancy as a disease of the genome, its conformation, and its evolution. Cancer Lett 2012 Oct 27. [Epub ahead of print] [DOI] [PMC free article] [PubMed] [Google Scholar]
- 16.Jaffe CC. Measures of response: RECIST, WHO, and new alternatives. J Clin Oncol 2006;24(20):3245–3251 [DOI] [PubMed] [Google Scholar]
- 17.Burton A. RECIST: right time to renovate? Lancet Oncol 2007;8(6):464–465 [Google Scholar]
- 18.Lambin P, Rios-Velazquez E, Leijenaar R, et al. Radiomics: extracting more information from medical images using advanced feature analysis. Eur J Cancer 2012;48(4):441–446 [DOI] [PMC free article] [PubMed] [Google Scholar]
- 19.Nair VS, Gevaert O, Davidzon G, et al. Prognostic PET 18F-FDG uptake imaging features are associated with major oncogenomic alterations in patients with resected non-small cell lung cancer. Cancer Res 2012;72(15):3725–3734 [DOI] [PMC free article] [PubMed] [Google Scholar]
- 20.Diehn M, Nardini C, Wang DS, et al. Identification of noninvasive imaging surrogates for brain tumor gene-expression modules. Proc Natl Acad Sci U S A 2008;105(13):5213–5218 [DOI] [PMC free article] [PubMed] [Google Scholar]
- 21.Segal E, Sirlin CB, Ooi C, et al. Decoding global gene expression programs in liver cancer by noninvasive imaging. Nat Biotechnol 2007;25(6):675–680 [DOI] [PubMed] [Google Scholar]
- 22.Tixier F, Le Rest CC, Hatt M, et al. Intratumor heterogeneity characterized by textural features on baseline 18F-FDG PET images predicts response to concomitant radiochemotherapy in esophageal cancer. J Nucl Med 2011;52(3):369–378 [DOI] [PMC free article] [PubMed] [Google Scholar]
- 23.Pang KK, Hughes T. MR imaging of the musculoskeletal soft tissue mass: is heterogeneity a sign of malignancy? J Chin Med Assoc 2003;66(11):655–661 [PubMed] [Google Scholar]
- 24.Ganeshan B, Panayiotou E, Burnand K, Dizdarevic S, Miles K. Tumour heterogeneity in non-small cell lung carcinoma assessed by CT texture analysis: a potential marker of survival. Eur Radiol 2012;22(4):796–802 [DOI] [PubMed] [Google Scholar]
- 25.Asselin MC, O’Connor JP, Boellaard R, Thacker NA, Jackson A. Quantifying heterogeneity in human tumours using MRI and PET. Eur J Cancer 2012;48(4):447–455 [DOI] [PubMed] [Google Scholar]
- 26.Ahmed A, Gibbs P, Pickles M, Turnbull L. Texture analysis in assessment and prediction of chemotherapy response in breast cancer. J Magn Reson Imaging doi:10.1002/jmri.23971 2012. Published online December 13, 2012 [DOI] [PubMed] [Google Scholar]
- 27.Kawata Y, Niki N, Ohmatsu H, et al. Quantitative classification based on CT histogram analysis of non-small cell lung cancer: correlation with histopathological characteristics and recurrence-free survival. Med Phys 2012;39(2):988–1000 [DOI] [PubMed] [Google Scholar]
- 28.Rubin DL. Creating and curating a terminology for radiology: ontology modeling and analysis. J Digit Imaging 2008;21(4):355–362 [DOI] [PMC free article] [PubMed] [Google Scholar]
- 29.Opulencia P, Channin DS, Raicu DS, Furst JD. Mapping LIDC, RadLex™, and lung nodule image features. J Digit Imaging 2011;24(2):256–270 [DOI] [PMC free article] [PubMed] [Google Scholar]
- 30.Channin DS, Mongkolwat P, Kleper V, Rubin DL. The Annotation and Image Mark-up project. Radiology 2009;253(3):590–592 [DOI] [PubMed] [Google Scholar]
- 31.Rubin DL, Mongkolwat P, Kleper V, Supekar K, Channin DS. Medical imaging on the semantic web: annotation and image markup. Presented at the AAAI Spring Symposium Series, Semantic Scientific Knowledge Integration, Palo Alto, Calif, March 26–28, 2008 [Google Scholar]
- 32.Goh V, Ganeshan B, Nathan P, Juttla JK, Vinayan A, Miles KA. Assessment of response to tyrosine kinase inhibitors in metastatic renal cell cancer: CT texture as a predictive biomarker. Radiology 2011;261(1):165–171 [DOI] [PubMed] [Google Scholar]
- 33.Miles KA, Ganeshan B, Griffiths MR, Young RC, Chatwin CR. Colorectal cancer: texture analysis of portal phase hepatic CT images as a potential marker of survival. Radiology 2009;250(2):444–452 [DOI] [PubMed] [Google Scholar]
- 34.Haralick RM, Shanmugam K, Dinstein I. Textural features for image classification. IEEE Trans Syst Man Cybern 1973;3(6):610–621 [Google Scholar]
- 35.Yang X, Knopp MV. Quantifying tumor vascular heterogeneity with dynamic contrast-enhanced magnetic resonance imaging: a review. J Biomed Biotechnol 2011;2011:732848. [DOI] [PMC free article] [PubMed] [Google Scholar]
- 36.Frouin F, Bazin JP, Di Paola M, Jolivet O, Di Paola R. FAMIS: a software package for functional feature extraction from biomedical multidimensional images. Comput Med Imaging Graph 1992;16(2):81–91 [DOI] [PubMed] [Google Scholar]
- 37.Frouge C, Guinebretière JM, Contesso G, Di Paola R, Bléry M. Correlation between contrast enhancement in dynamic magnetic resonance imaging of the breast and tumor angiogenesis. Invest Radiol 1994;29(12):1043–1049 [DOI] [PubMed] [Google Scholar]
- 38.Zagdanski AM, Sigal R, Bosq J, Bazin JP, Vanel D, Di Paola R. Factor analysis of medical image sequences in MR of head and neck tumors. AJNR Am J Neuroradiol 1994;15(7):1359–1368 [PMC free article] [PubMed] [Google Scholar]
- 39.Bonnerot V, Charpentier A, Frouin F, Kalifa C, Vanel D, Di Paola R. Factor analysis of dynamic magnetic resonance imaging in predicting the response of osteosarcoma to chemotherapy. Invest Radiol 1992;27(10):847–855 [DOI] [PubMed] [Google Scholar]
- 40.Furman-Haran E, Grobgeld D, Kelcz F, Degani H. Critical role of spatial resolution in dynamic contrast-enhanced breast MRI. J Magn Reson Imaging 2001;13(6):862–867 [DOI] [PubMed] [Google Scholar]
- 41.Rose CJ, Mills SJ, O’Connor JPB, et al. Quantifying spatial heterogeneity in dynamic contrast-enhanced MRI parameter maps. Magn Reson Med 2009;62(2):488–499 [DOI] [PubMed] [Google Scholar]
- 42.Canuto HC, McLachlan C, Kettunen MI, et al. Characterization of image heterogeneity using 2D Minkowski functionals increases the sensitivity of detection of a targeted MRI contrast agent. Magn Reson Med 2009;61(5):1218–1224 [DOI] [PubMed] [Google Scholar]
- 43.Lloyd MC, Allam-Nandyala P, Purohit CN, Burke N, Coppola D, Bui MM. Using image analysis as a tool for assessment of prognostic and predictive biomarkers for breast cancer: how reliable is it? J Pathol Inform 2010;1:29–36 [DOI] [PMC free article] [PubMed] [Google Scholar]
- 44.Kumar V, Nath K, Berman CG, et al. Variance of SUVs for FDG-PET/CT is greater in clinical practice than under ideal study settings. Clin Nucl Med 2013;38(3):175–182 [DOI] [PMC free article] [PubMed] [Google Scholar]
- 45.Walker-Samuel S, Orton M, Boult JK, Robinson SP. Improving apparent diffusion coefficient estimates and elucidating tumor heterogeneity using Bayesian adaptive smoothing. Magn Reson Med 2011;65(2):438–447 [DOI] [PubMed] [Google Scholar]
- 46.Thews O, Nowak M, Sauvant C, Gekle M. Hypoxia-induced extracellular acidosis increases p-glycoprotein activity and chemoresistance in tumors in vivo via p38 signaling pathway. Adv Exp Med Biol 2011;701:115–122 [DOI] [PubMed] [Google Scholar]
- 47.Thews O, Dillenburg W, Rösch F, Fellner M. PET imaging of the impact of extracellular pH and MAP kinases on the p-glycoprotein (Pgp) activity. Adv Exp Med Biol 2013;765:279–286 [DOI] [PubMed] [Google Scholar]
- 48.Araújo MB, Peterson AT. Uses and misuses of bioclimatic envelope modeling. Ecology 2012;93(7):1527–1539 [DOI] [PubMed] [Google Scholar]
- 49.Larsen PE, Gibbons SM, Gilbert JA. Modeling microbial community structure and functional diversity across time and space. FEMS Microbiol Lett 2012;332(2):91–98 [DOI] [PMC free article] [PubMed] [Google Scholar]
- 50.Shenton W, Bond NR, Yen JD, Mac Nally R. Putting the “ecology” into environmental flows: ecological dynamics and demographic modelling. Environ Manage 2012;50(1):1–10 [DOI] [PubMed] [Google Scholar]
- 51.Clark MC, Hall LO, Goldgof DB, Velthuizen R, Murtagh FR, Silbiger MS. Automatic tumor segmentation using knowledge-based techniques. IEEE Trans Med Imaging 1998;17(2):187–201 [DOI] [PubMed] [Google Scholar]