

Abstract
Revealing the clonal composition of a single tumor is essential for identifying cell subpopulations with metastatic potential in primary tumors or with resistance to therapies in metastatic tumors. Sequencing technologies provide only an overview of the aggregate of numerous cells. Computational approaches to de-mix a collective signal composed of the aberrations of a mixed cell population of a tumor sample into its individual components are not available. We propose an evolutionary framework for deconvolving data from a single genome-wide experiment to infer the composition, abundance and evolutionary paths of the underlying cell subpopulations of a tumor. We have developed an algorithm (TrAp) for solving this mixture problem. In silico analyses show that TrAp correctly deconvolves mixed subpopulations when the number of subpopulations and the measurement errors are moderate. We demonstrate the applicability of the method using tumor karyotypes and somatic hypermutation data sets. We applied TrAp to Exome-Seq experiment of a renal cell carcinoma tumor sample and compared the mutational profile of the inferred subpopulations to the mutational profiles of single cells of the same tumor. Finally, we deconvolve sequencing data from eight acute myeloid leukemia patients and three distinct metastases of one melanoma patient to exhibit the evolutionary relationships of their subpopulations.
INTRODUCTION
The mechanisms of cancer evolution and metastatic onset are still largely unknown. The diversity, complexity and evasive nature of tumor biology are central reasons for the seemingly slow progress in the cure of most cancer types, particularly in controlling the ability of tumor populations to spread. Tumor populations are dynamic aggregates of constantly evolving subclones, each carrying a variety of genomic aberrations (1–35). This genetic heterogeneity is often associated with differences in the biological behavior of different cell subpopulations. Some of these subclones are likely to be the primary instigators of invasion, metastases or relapse following treatment (35–52). An effective characterization of the aggressive potential of tumors at early stages has an enormous potential to guide new clinical interventions and translational research (53–61).
Recently, several efforts have been made to provide a complete genealogical perspective of cancer evolution (62–66). Using fluorescent labeling techniques, or more recently, single-cell sequencing, it is technically possible to separate single cells from tumor samples to investigate their evolutionary patterns (62–71). However, these approaches are limited to either a small number of fluorescent markers (63,72) or to a relatively small number of single cells. On one hand, the identification and selection of uncharacterized subclones in high-throughput experiments is beyond the capabilities of current cell-sorting technologies; on the other hand, isolation and profiling of enough single cells to obtain a statistically representative sample of a tumor composed of millions of cells has, currently, prohibitive costs. For this reason, genomics profiling of tumors still relies on pooling to provide global averaged signals over the subclonal population within a tumor sample (73–76). Computational methods for identifying subclones, quantifying their relative abundance and monitoring their emergence and dynamics could prove extremely useful for the analysis of the heterogeneity of these pooled samples. This problem has been often overlooked due to its mathematical complexity.
We present a mathematical approach to de-mix signals from heterogeneous cell populations into their subclonal components and subsequently unveil the underlying dynamic tumor heterogeneity. Our proposed method is related to the problem of blind source separation (77–86), where both the underlying sources and their relative composition are unknown. In contrast to blind source separation methods, we cannot assume that the underlying sources are statistically independent, we have no prior knowledge of the number of sources and we have at our disposal only one mixture of the unknown sources. This mathematical problem has a vast number of solutions and can be addressed only if additional constraints are imposed. Solutions to this problem can be found by applying Bayesian methods such as hierarchical Dirichlet Processes (66,87). While such approaches typically produce plausible solutions to the problem, they require knowledge of several parameters and prior distributions, which are often not easy to calibrate. Futhermore, stochastic methods are not guaranteed to find the optimal solution(s) to the problem and may miss many solutions. Herein, we introduce biologically meaningful constraints to dramatically reduce the number of solutions to the problem, and we provide an algorithm to find all solutions of this reduced problem. In detail, we assume that tumor cell populations develop in a parsimonious evolutionary process. Furthermore, based on empirical observations, we introduce a sparsity constraint that limits the number of subpopulations. Distinctively from the standard problem of phylogeny (88–99), where each species is observed and measured separately, and differently from cases where multiple aggregate samples have been measured (100–106), our methodology, which we term Tree Approach to Clonality (TrAp), is specifically designed to deconvolve a single aggregate signal into its different subclonal components. TrAp incorporates biologically motivated constraints, which allow us to infer (i) the composition of the subclones in a single aggregate sample, (ii) the abundance of each subclone and (iii) the evolutionary path of the subclones.
The article is organized as follows: we first define the subclonal deconvolution problem and we present an efficient algorithm for finding all its solutions in the ‘Results’ section. Using in silico simulated data we verify that the algorithm is able to correctly deconvolve mixed subclonal populations and that the method is robust to realistic measurement errors. Further, the solution is often unique when the number of populated subclones is moderate. In addition, we also show that TrAp can correctly deconvolve random mixtures of karyotypes of several cells from the same tumor biopsy or from mixture of sequences generated in a study involving somatic hypermutations (SHMs) in B cells. We subsequently compare the mutation profiles of 20 Exome-Seq single-cell experiments to those inferred using an aggregate signal generated by exome sequencing from the same renal cell carcinoma tumor. We then apply the TrAp algorithm to study the response to chemotherapy of eight acute myeloid leukemia (AML) patients. Finally, we apply TrAp to Exome-Seq data from three metastases from three distinct body compartments and compare their subclonal compositions and evolutionary histories.
The subclonal deconvolution problem
We consider a population of cells where each cell can be described by a binary vector, which we call genotype. Each element of the genotype vector has an aberration state modeled as a binary variable, e.g. the presence/absence of a mutated nucleotide in a specific genomic position or the presence/absence of a specific copy number variation event in a specific locus. For each cell, the i-th element of the genotype vector is 1 if the i-th aberration is present in the cell and 0 if the aberration is absent. A subclone is a collection of all cells that have identical genome-wide aberration profile. A subclone is populated in the sample if the fraction of cells sharing the subclone’s genome is >0 and can be detected by the experiment.
We define the subclonal deconvolution problem as the task of de-mixing an aggregate measurement into a linear combination of (unknown) subclonal genotypes. The only information that is required as input is the aggregate frequency vector y, whose elements yi correspond to the frequency of the i-th aberration in the sample cell population. For efficiency, we remove from the genome all genotype entries k that are homogenous within the population (i.e.  or
or  ), as they do not need to be deconvolved. Next, to ensure that the aberration-free noncancerous cells (wildtype) are included in the solution of the problem, we add one dummy aberration to all the normal and cancerous cells in the sample. By construction, the aggregate frequency of this dummy aberration y1 is equal to 1. Finally, without loss of generality, we sort the aggregate frequency vector y in descending order such that
  , where N is equal to the number of aberration events considered including the dummy aberration y1. The subclonal deconvolution problem can be written in matrix notation as
| (1) |
where C is a matrix of size  whose elements
  are 1 if aberration i is present in subclone Cj, and 0 otherwise; N is the size of the vector y; M is the number of subclones; and x is a vector of size M where each element xj corresponds to the frequency of subclone Cj in the sample. We note that, without introducing the wildtype aberration, the wildtype subclone would correspond to a vector of zeros and we would not be able to infer the frequency of the wildtype component using the linear model of Equation (1). Furthermore, because the dummy aberration is present in the wildtype and all other subclones, it follows that (i)
  and (ii)
  . We note that because M, C and x are all unknown in this problem, there is an intractable number of possible solutions. As previously discussed (107), for
  , the system is underdetermined and the aggregate signal cannot be uniquely deconvolved by solving the linear system, and it is not even possible to find parsimonious unique solutions using sparse reconstruction methods. However, by introducing additional biologically motivated constraints to the model, we can dramatically reduce the number of possible solutions, such that the problem may have a tractable number of optimal solutions, ideally only one. We therefore seek the family of solutions (TrAp solutions) that sequentially satisfy the following constraints:
Evolutionarity. The subclones are generated in an evolutionary process starting from a subclone with no aberrations. Every subclone is generated from an existing subclone by adding to it a single new aberration event.
Parsimony. The number of subclones M that are generated during the evolution process is minimal.
Sparsity. The number of populated subclones P (i.e. the number of subclones j for which
 ) is minimal.
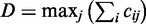
Shallowness. The depth of the evolutionary tree (i.e. the number of generations)
 is minimal.
A schema of a TrAp solution is shown in Figure 1.
Figure 1.
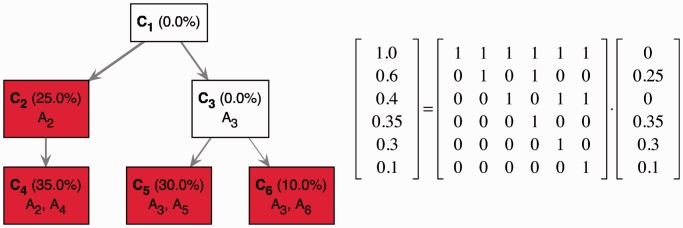
A schema of deconvolution of the mixed signal of four subclones. In this example, the aggregate signal frequency vector y on the left side of the matrix-vector equation represents the frequency of five aberrations in the aggregate sample. To allow the heterogeneous mixture of subclones to include normal cells we introduce a dummy aberration that is present in any cell. The frequency of the dummy aberration y1 is equal to one. The frequencies of the actual five aberrations A2, A3, A4, A5 and A6 encoded in the remaining elements of the vector Y are given by  ,
,  ,
,  ,
,  and
and  , respectively. In this example, the optimal TrAp solution is unique and has four populated subclones: C2 with aberrations
  , C4 with aberrations
  , C5 with aberrations
  and C6 with aberrations
  . The optimal solution is shown both as an evolutionary tree (left) and in matrix form according to Equation (1) (right), where the tree topology is encoded in the binary matrix and the relative composition of the subclones is represented in the column vector.
The evolutionarity constraint is used in many biological systems, in particular when studying development of cell populations (90–97,100–102). The parsimony constraint is typically satisfied because the expected probability of a specific aberration event in a nucleotide or a locus is low and it is therefore unlikely that an event occurs more than once and independently in distant subclones. This constraint is the main criterion used to determine the optimality of maximum parsimony methods commonly used in phylogeny (88,89,93,98,105). The parsimony constraint dramatically reduces the number of possible solutions of Equation (1) because it limits the number of subclones M. The sparsity constraint is justified by the fact that some subclones may die out or may be too rare to be detected. Also, it has been shown in several studies that few subclones acquire an evolutionary advantage and outgrow the other subclones (5,12,108–112), thus reducing the number of populated subclones. The shallowness constraint is justified as strong genomic instability may not be viable, thus evolutionary trees tend to be shallow and wide rather than deep and narrow.
MATERIALS AND METHODS
In this section, we describe the procedures used to preprocess input data for the TrAp algorithm.
Cytogenetic data
The cytogenetic data were obtained from the Mitelman database, which contains 61 846 biopsies as on 15 August 2012. We accessed the database through the Cancer Genome Anatomy Project (CGAP) Web site (113), and we filtered out 29 842 biopsies with uncertain calls (indicated by a ‘?’ in the karyotype data). We focused our search only on aberrations that are binary by nature, namely chromosome deletions and translocations. For each biopsy, we performed 100 in silico simulations in which we mixed the subclones using random nonnegative coefficients.
SHM data
SHM sequencing data were derived from B cells undergoing SHM, a process that leads to high-affinity antibody molecules (114,115). In detail, we analyzed sequences of the V(D)J region extracted from the same germinal center from the sample 11930d16_4print.2, which was sequenced by Anderson et al. (116,117). The sequences were aligned using the alignment tool of the international ImMunoGeneTics information system® (IMGT) (118,119) to properly align the V, D and J regions. We selected eight sequences that were aligned to the same V(D)J sequence  . Because these sequences are from the same germinal center and align to the same V(D)J sequence, they are expected to stem from a single naïve B cell and have evolved through the SHM process. From the sequencing experiment, 20 mutated nucleotides were identified. Furthermore, polyallelic mutations were found at position 170, where both
  and
and  mutations were observed. Next, we considered the seven unique sequences (sequences five and eight were identical) as representatives of the genome of seven different subclones.
Exome capture sequencing data
Exome-capture data (120) were obtained from a recent clear cell renal cell carcinoma (ccRCC) study (64) and from the melanoma patient YUHUY of the Yale cohort, for which DNA from normal circulating lymphocytes and three tumor metastases (TM1, TM3 and TM4) were subjected to exome-capture Illumina Hi-Seq sequencing (121).
Exome-Seq reads from the aggregate samples of the ccRCC patient were combined and aligned to the human reference genome (assembly hg19) using Bowtie (122) with parameters ‘-n3 -k1 -m20 -l32 –chunkmbs 1024 –best –strata’. The frequency and coverage of each point mutation was computed using VarScan (123). We further selected the mutations that were validated by Xu et al. (64) by polymerase chain reaction (PCR) validation (Supplementary Table S3B) and by bioinformatics analysis (Supplementary Table S3A), whose genomic coordinated were realigned to the assembly hg19 using the Lift-Over tool of Galaxy (124).
For the melanoma patient YUHUY (121), we selected 19 mutations that were populated in the normal sample (i.e.  ), had high sequence coverage (i.e. >200 reads covering the specific nucleotide) and were localized on chromosome 18.
RESULTS
The results are divided in four parts. In the first part, we describe our novel TrAp algorithm for subclonal deconvolution of aggregate genomic signals consisting of aberrations’ frequencies (e.g. mutational allele frequencies). We show that the TrAp algorithm always identifies at least one solution. Further, we incorporated into TrAp an error model to handle noisy input data as well as an extension for handling situations where each locus can be affected by distinct consecutive aberrations (e.g. nucleotides which can undergo several consecutive mutations such as  , or
, or  ). In the second part, we simulate noisy aggregate signals constructed by random linear combinations of simulated subclonal aberration profiles. We used these simulated data to show that TrAp can correctly deconvolve mixtures of evolutionarily related subclones even in presence of levels of noise that are typically found in current genomics experiments. In the third part, we generated realistic aggregate signals by mixing subclonal genomic profiles obtained from cytogenetic analyses using random coefficients. We generate these data separately for each patient and show that, for nearly all aggregate samples, TrAp recovered the subclonal components. Similarly, we generated realistic aggregate signals from somatic hypermutated (SHM) regions from B cells. As we show, SHM is a particularly suitable system for the framework of our TrAp algorithm, which successfully recovered all components from the aggregate signals. In the fourth part, we apply our approach to exome-sequencing experiments. We present an analysis of recent single-cell exome sequencing from a renal cell carcinoma study where, besides a collection of 20 single cells, an aggregate has also been measured. Despite the reported difference between the aggregate and mean aberration profile of the single-cell experiments, TrAp could still identify subclones with co-occurring aberrations consistent with some of the co-occurring aberrations found in direct single-cell measurements. We then apply the TrAp algorithm to study the response to chemotherapy of eight AML patients by comparing the subclonal composition before and after treatment. Finally, we analyze three metastases from separate body compartments of a melanoma patient and compare their inferred evolutionary patterns in a genomic region surrounding the Deleted in Colorectal Cancer (DCC) gene.
A brute-force algorithm for solving the subclonal deconvolution problem
To develop a fast algorithm to solve the subclonal deconvolution problem, we first derive some useful properties that every TrAp solution must satisfy (see Supplementary Note A). First, we note that the evolutionarity and sparsity constraint imply that the evolutionary trees must have exactly N clones. We term such a solution an N-solution and its evolutionary tree an N-tree. In this setting, mutations happen only once during the evolutionary process and cannot be lost at later stages in evolution. We therefore can define Ci as the subclone for which the i-th aberration occurs for the first time.
Next, we note (see Supplementary Note B for derivation and a more detailed description) that, if we consider two subclones Ci and Cj such that  (which implies
  because the y vector is sorted), the subclone Ci cannot be a descendant of Cj. This property implies that all evolutionary trees can be generated by a simple iterative procedure, which starts from the wildtype clone C1 and adds the subclone Ci to all trees generated in the step i – 1 (Supplementary Figure S2). The upper bound on the number of possible evolutionary N-trees is thus
  , as every subclone i can only be the direct descendant of i – 1 subclones. This bound is significantly smaller than the number of all possible trees with N labeled vertices, which is
  according to Cailey’s formula (125,126).
The TrAp algorithm
We now rewrite the subclonal deconvolution problem (see Supplementary Note C for derivation) as follows:
| (2) |
where  is the parent indicator matrix, whose element
  (which we call parent indicator variable) is 1 if Ci is the parent of Cj (i.e. if subclone Cj is the result of a single aberration event in subclone Ci), and 0 otherwise. An important corollary of this equation is that the subclone Ci is not populated if and only if
 |
(3) |
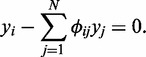
In other words, the clone Ci is not populated when the aggregate frequency yi of aberration i is equal to the sum of the aggregate frequencies of all the direct descendants of the subclone Ci. Therefore, the number of nonpopulated subclones of the N-tree encoded by  is determined by the number of aberrations i that satisfy Equation (3). Moreover, to satisfy the sparsity constraint of a solution, we do not need to know the topology of the whole evolutionary tree, but only the subset of rows of the matrix
  that satisfy Equation (3). We now leverage on this property to efficiently generate sparse solutions to the subclonal deconvolution problem.
First, we group each subset of subclones that satisfy Equation (3) into a first-generation tree
Ti, which we define as the subset of subclones  such that the subclone
  is not populated (i.e.
  ) and that Ni subclones
  are its direct descendants. Each first-generation tree is represented by a row of the
  matrix. For example, there are three first-generation trees for the aggregate signal
  , namely
  ,
,  and
and  (Figure 2). We note that the optimal TrAp solution for this example contains the first-generation trees T1 and T3 (Figure 1). Furthermore, a
  matrix associated with a first-generation tree must follow the evolutionary constraints previously described (
 ), and thus, the first-generation tree also gives complete information about the columns of
  corresponding to the direct descendant subclones
 . For example, the first-generation tree
 implies that
  and
and  for every
  (Figure 2).
Figure 2.

Identification of first-generation trees. In this example, the aggregate signal frequency vector  is consistent with three first-generation trees
  ,
, 
 and
and 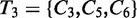 . Each first-generation tree is visualized as a matrix equation
 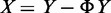 according to Equation (2) (left) and as a partial evolutionary tree (right). In the bottom row, the partial tree PT1 given by the union of the partial trees T1 and T3 is shown. Question marks indicate values that are unknown as they are not specified by the first-generation tree or by the partial tree.
Next, we define a partial tree as a collection of first-generation trees  that can jointly be contained in a full evolutionary tree. Because each first-generation tree can be represented by a row of the
  matrix, a partial tree that is comprised of h first-generation trees can be represented by h rows of the
  matrix. In the example above, the partial tree that contains the first-generation trees T1 and T3 is represented by rows 1 and 3 of the matrix
  in the bottom panel of Figure 2. Similarly, to first-generation trees, the matrix
  associated with a partial tree must follow the evolutionary constraint, which implies that not all combinations of first-generation trees give rise to partial trees. In the example above, the partial trees T1 and T3 can be combined to generate the partial tree
 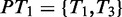 (Figure 2 bottom), whereas the pairs
  and
and  cannot be combined to generate partial trees. Therefore, in the example above, the possible partial trees are
 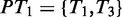 , the empty partial tree
  and the partial trees
  ,
,  and
and  . Moreover, we note that all N-trees that contain a partial tree comprising of h first-generation trees have N – h populated subclones. This implies that TrAp solutions, which must satisfy the sparsity constraint, must also contain one of the partial trees comprising the maximum number of first-generation trees. In the example above, the optimal TrAp solution (Figure 1) contains the partial tree PT1, which is the only partial tree comprising two first-generation trees.
All TrAp solutions contain the maximum number of first-generation trees, thus the TrAp algorithm dramatically reduces the search space by identifying the optimal partial trees which are then used as starting points for rapidly building all the sparsest solutions to the subclonal deconvolution problem. In detail, the TrAp algorithm solves the subclonal deconvolution problem as follows (Figure 3):
Identify all first-generation trees from the aggregate signal vector y.
Combine all first-generation trees to generate all partial trees.
Discard partial trees that do not have the minimum number of populated subclones.
Generate all evolutionary trees consistent with the partial trees comprising the maximum number of first-generation trees. This step is done iteratively for each partial tree, similarly to the way described for the brute-force algorithm. The only difference is that, when the parent clone
 of a first-generation tree
 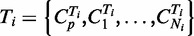 is added to the tree, the subclones
  are automatically added as direct descendants of
  .
.Optimize the shallowness constraint by sorting the generated solutions by the depth of the generated tree.
Figure 3.

Illustration of the usage of first-generation trees and partial trees for deriving the TrAp solution of a mixture of four subclones. In this example, five aberrations were measured from an aggregate sample and their frequencies were  ,
,  ,
,  ,
,  and
and  , respectively. The dummy measurement
  was also added to generate the aggregate signal frequency vector
  . In the first step, TrAp identifies all first-generation trees, namely
  and
and  . In the second step, TrAp generates the possible partial trees, namely
  ,
,  ,
,  and
and  , and consequently selects only
  , as it is the only partial tree that contains a maximum number of first-generation trees. In the third step, TrAp generates evolutionary trees starting from the partial tree
  . To complete the evolutionary tree starting from PT4, the subclone C1 is positioned as the root of the tree. Because C1 is part of the first-generation tree T1, the subclones C2 and C6 are automatically added as direct descendants of C1. Next, C3 is added as a direct descendant of C2. Because C3 is part of the first-generation tree T2, C4 is automatically added as direct descendant of C3. Finally, C5 is added as a direct descendant of C4, generating the optimal TrAp solution to the subclonal deconvolution problem. We remark that the optimal solution generated by the TrAp algorithm is equal to the left solution of Supplementary Figure S1 and to solution
  in Supplementary Figure S2.
The performance of the TrAp algorithm is equivalent to the brute-force approach when there are no first-generation trees (i.e. when all subclones are populated), but it becomes superior to a brute-force approach when  . While the brute-force algorithm generates all the evolutionary trees compatible with the input data, the TrAp algorithm generates only the optimal evolutionary tree(s).
Handling measurement errors
The models presented above show that TrAp is an efficient algorithm for inferring subclonal components from the aggregate measure. In particular, we have shown that in the absence of noise, TrAp returns the exact solution when the underlying subclonal population satisfies reasonable constraints and that the algorithm is always able to find at least one solution. However, experimental measurements are often noisy and can only have finite precision.
In this section, we discuss two approaches to treat noisy input. In both error models, the input to the TrAp algorithm requires an additional vector  of size N whose elements
  are related to the precision of the measure yi. The error related to the dummy variable is denoted by
  and is set to 0 as
  is a constraint of the model and thus
  must vanish.
First, we examine the bound error model in which we assign a threshold to the error  of every underlying aggregate signal
  such that each measured signal
  will be in the range
  . Equation (3) is then modified accordingly and we can state that the subclone Ci defined by aberration i is not populated if and only if
 |
(4) |
Next, assuming normally distributed measurement errors we implement a normal error model using the confidence intervals to determine whether a subclone is populated. Specifically, we assume that the underlying aggregate signal is normally distributed around the observed signal, i.e.  . We substitute each term of the left-hand side of Equation (3) by normally distributed random variables to derive the distribution of the random variable
  with mean
 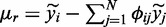 and variance
 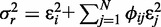 . Using the distribution of r and a desired confidence level
  (default 0.05), we can define that clone Ci is not populated if 0 falls within the confidence interval
  , where
  is the α quantile of the distribution of r.
Once the error model is chosen, the algorithm generates all optimal TrAp-trees in a similar fashion to the noise-free case. The main difference is that in the first step of the TrAp algorithm, Equation (4) [or a confidence interval on the distribution 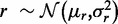 ] is used instead of Equation (3) to identify first-generation trees. Moreover, instead of using back-substitution for finding the vector x, we solve the nonnegative linear least square problem
  with the constraint
  for all nonpopulated subclones k associated with the parents of the first-generation trees. This fitting allows us to obtain a value of exactly zero for all nonpopulated subclones and to distribute measurement error more evenly in the vector x.
Extensions and integrations of the TrAp algorithm
The TrAp algorithm was also generalized to deal with nonbinary aberrations (e.g. multiple distinct point mutations at the same nucleotide). This has been done by reducing this generalized nonbinary problem to multiple binary problems that can be solved using the core TrAp algorithm (detailed explanation and derivation are given in Supplementary Note D, Supplementary Figures S3 and S4). This generalized model was used to infer subclonal composition from a mathematical mixture of the SHM data.
Furthermore, the algorithm can be easily modified by imposing additional constraints that need to be satisfied at each step of the iterative tree reconstruction procedure. The contraints can be used to specify the order in which two mutation occur or whether two aberrations must be on separate evolutionary branches (i.e. they will never co-occur). Such constraints are used in the extension of TrAp to nonbinary aberrations (Supplementary Note D). These constraints can also be specified when additional information is available to the user. For example, the aberration state of two nearby nucleotide positions could be observed simultaneously in a read pair. This additional information can be used to determine if two mutations are mutually exclusive or if one is an ancestor of the other (66). Moreover, if multiple samples are available for a given patient, a unique evolutionary tree inferred from one sample can be used to constrain the evolutionary trees of the remaining samples.
The TrAp algorithm by default returns only the solution(s) that optimize all the constraints. In addition, the user can specify parameters to relax the sparsity and shallowness constraints. For example, all N-solutions whose number of populated subclones is less than or equal to a desired number can be obtained by retaining more partial trees during the third step of the TrAp algorithm. The solutions produced by TrAp (or the brute-force approach) can then be rescored by more advanced user-defined fitting functions to refine the results. These fitting function may include terms that model the biological system under consideration (77) [e.g. some types of aberrations are more common during SHM (115) or during melanoma development in melanocytes (127)] or terms that model the sampling noise of a given experiment. The TrAp algorithm was used to deconvolve systems of up to 25 aberrations. Although many tumors have larger number of nonsynonymous mutations, the effective number relevant for analyzing the tumor can be significantly reduced. This can be done by (i) considering only a subset of medically relevant genes, e.g. by selecting the first tier defined by Mardis et al. (128) or by focusing on expressed genes whose mutations are predicted to be deleterious in proteins or genes that are downregulated relative to normal tissue, (ii) focusing on mutations within selected pathways or (iii) clustering all mutations into groups with similar minor allele frequencies. These reduction approaches allow to identify meaningful aberrations and thus generate trees that are simpler and easier to interpret. Furthermore, studying a smaller number of mutations may be more robust to error and may allow to identify outliers and artifacts in the input data. In the TrAp algorithm, we include a clustering procedure that groups together aberrations with similar frequency (according to the error model chosen) before running the algorithm. More complex clustering methodologies can be applied if replicate samples are available or if multiple samples from the same patient are available. For example, Ding et al. (18) applied MCLUST (129,130) and clustering based on Kernel Density Estimation to identify three to five major clusters of minor allele frequencies in three conditions (normal, tumor, relapse) for eight AML patients. Below, we also reanalyzed Ding et al. (18) data using the minor allele frequencies of the clusters as input to the TrAp algorithm.
Implementation of the TrAp algorithm
TrAp was programed in Java. TrAp makes use of the Java Matrix package JAMA (131) for linear regression and code by Josh Vermaas to solve the nonnegative least square problem using JAMA. The Java Universal Network/Graph Framework (132) is used for creating pictorial representations of evolutionary trees. TrAp is released under the GNU Lesser General Public License 3.0 and can be downloaded from the SourceForge repository at the URL http://sourceforge.net/projects/klugerlab/files/TrAp/.
Deconvolution of simulated noisy aggregates
To confirm that TrAp can correctly infer the subclonal composition from aggregate noisy signals with typical noise levels found in genomic experiments, we performed simulations starting with random in silico evolutionary trees with different numbers of aberrations N and different numbers of populated subclones P. For each tree, we also studied the effect of different magnitudes of measurement errors E and we investigated the operating conditions for which TrAp would correctly identify the true solution.
We performed simulations by sampling genotypes whose size N ranged from 1 to 12 and with underlying number of populated subclones P ranging from 1 to  . The simulations were repeated for measurement error values E equal to
  ,
,  and
and  . For each combination of these quantities, we performed 1000 runs using in silico data as follows: during each run, a random evolutionary tree with N aberrations was generated by randomly assigning a parent subclone Cj (
 ) to each subclone Ci. The set of P populated subclones was then selected by first including all leaves of the tree and then adding the remaining subclones randomly. The frequency of the populated subclones was randomly assigned and the frequency of the nonpopulated clones was set to zero. Next, the aggregate frequency vector
  was calculated from the generated tree. Finally, we perturbed each element of
  by adding an error
  drawn from a uniform distribution
  . The elements
  and the error
  are used as input for the bound error model option of the TrAp algorithm. For each aggregate signal from a random tree, we examined (i) whether the true solution (i.e. the solution associated with the simulated tree), which is by construction one of the possible solutions to the subclonal deconvolution problem, had the minimum number of populated subclones among all solutions (sparsity constraint), (ii) whether the true solution had the minimum number of populated subclones and minimum number of levels of the evolutionary tree among all solutions generated by TrAp (sparsity and shallowness constraints) and (iii) whether the true solution was the only TrAp solution (sparsity and shallowness constraints and uniqueness of the optimal solution).
The results of the simulations show that aggregate signals from sparse trees are deconvolved correctly even in presence of typical noise levels of sequencing experiments (Figure 4). We note that for simulations of nonsparse trees, TrAp generates a large number of possible solutions of which only one is the true solution. Furthermore, in the presence of high levels of noise, the TrAp algorithm identifies a large number of first-generation trees that satisfy Equation (4) and generates solution trees whose number of populated subclones is smaller than the number of populated subclones of the true solution.
Figure 4.

Deconvolution of simulated data. In each table the index of a column represents the number of populated subclones and the index of a row represents the number of mutations. We generated 1000 simulations for any pair of row and column indices (pixel) in these tables. We performed this analysis using different level of noise (error) drawn from a uniform distribution  . The heatmaps (tables) show the percentage of trees in each cell for which the true solution has the minimum number of subclones (left panel), is a TrAp solution (middle panel) and is the only TrAp solution (right panel) if the best solution is unique.
Analysis of simulated mixtures of biological data
Deconvolution of mathematical mixtures of karyotyping data from single tumor biopsies
After showing that our approach can correctly deconvolve aggregate signals of subclones with a tree-like genealogy, we sought to investigate whether actual subclonal populations can be charted on evolutionary trees. For this purpose, we analyzed the Mitelman database, consisting of cytogenetic analyses of >60 000 biopsies (see ‘Materials and Methods’). For each tumor type, we counted how frequently the relationships between cancer clones from the same biopsy could be explained by an evolutionary tree that follows the evolutionarity and parsimony constraints (but not necessarily the sparsity and shallowness constraints). We found that almost all biopsies in the Mitelman database can be represented by evolutionary trees (Table 1), with the notable exception of astrocytoma of grades III and IV (Supplementary Figure S5).
Table 1.
Applicability of the TrAP algorithm for different number of aberration events and underlying subclones
| 1 | 2 | 3 | 4 | >4 | |
|---|---|---|---|---|---|
| 1 | 100% (19078) | n/a | n/a | n/a | n/a |
| 2 | 100% (5150) | 100% (923) | 0% (3) | n/a | n/a |
| 3 | 100% (1830) | 100% (367) | 94% (83) | 0% (2) | n/a |
| 4 | 100% (991) | 100% (182) | 89% (27) | 89% (18) | n/a |
| 5 | 100% (656) | 100% (120) | 88% (33) | 100% (8) | 100% (5) |
| 6 | 100% (445) | 100% (66) | 92% (13) | 100% (6) | 50% (4) |
| 7 | 100% (333) | 100% (58) | 89% (9) | 25% (4) | 100% (2) |
| 8 | 100% (241) | 100% (37) | 86% (7) | 100% (3) | 50% (2) |
| 9 | 100% (228) | 100% (26) | 60% (5) | 0% (1) | 100% (1) |
| 10 | 100% (174) | 100% (14) | 100% (2) | n/a | 50% (2) |
| 11 | 100% (196) | 100% (25) | 67% (3) | 67% (3) | n/a |
| 12 | 100% (156) | 100% (16) | 100% (3) | 0% (1) | 50% (2) |
| 13 | 100% (137) | 100% (21) | 50% (2) | n/a | 100% (1) |
| 14 | 100% (94) | 100% (12) | n/a | 100% (1) | 100% (1) |
| >14 | 100% (152) | 100% (22) | 57% (7) | 25% (4) | 25% (4) |
Entries where the parsimony constraint cannot be satisfied are shown in bold.
We mathematically mix all karyotypes of each single patient from the Mitelman database and apply the TrAp algorithm for each of these mixtures. The ability of the TrAp algorithm to extract the correct underlying clonal or subclonal components depends on the number of actual components (columns) and the multiplicity of aberrations studied in each mixture (rows). The frequency in which TrAp is able to recover the correct underlying components is shown in percentages. The number of mixtures for a given size of aberration multiplex (row) and given number of actual underlying components (column) is shown in parentheses. Note that when the column index is greater than the row index (entries shown in bold), the parsimony constraint cannot be satisfied.
Next, we investigated whether the TrAp algorithm could uniquely deconvolve mixtures of the cancer subclones within a biopsy. As these aggregate signals are obtained by mixing actual subclonal profiles, we consider these signals to be more realistic than our previous in silico simulations. For each biopsy, we generated 1000 in silico mixtures by combining the cytogenetic profiles of each subclone using random nonnegative coefficients. We then applied our TrAp method to deconvolve in silico mixtures of biopsies. Our results (Table 1) show that 81.5% of the aggregate signals simulated from biopsies with three or more subclones were correctly deconvolved (i.e. in at least one TrAp solution the subclones contained in the biopsies were found and were present in the correct proportions) and that in 67.3% of these simulations there was only one TrAp solution to the deconvolution problem. Moreover, the TrAp algorithm inferred also intermediate nodes in the evolutionary tree that did not correspond to any of the cytogenetic profiles for the biopsy, providing a plausible picture of the evolutionary order in which the aberrations occurred. Figure 5 shows the result of two deconvolution simulations, one from a melanoma sample with two subclonal populations (133) and one from an adenocarcinoma sample with three subclonal populations (134). Interestingly, a small number of biopsies showed more clones than aberrations (shown in bold in Table 1). Albeit a tree-like genealogical relationship can be constructed, these biopsies do not satisfy the parsimony constraint because the number of subclones M is greater than the number of mutations N. For this reason, their genealogy cannot be reconstructed by the TrAp algorithm or by any other method that makes use of a similar parsimony constraint (88,89,93,98).
Figure 5.

Deconvolution of random mixtures of three subclones. The boxes represent different subclones, each denoted by the list of its aberrations. The aberration profiles of two subclones identified by cytogenetics in a melanoma biopsy (left) and the aberration profiles of three subclones identified in an adenocarcinoma biopsy (right) have been mixed in silico using random coefficients. In both cases, the mixtures were successfully deconvolved. Aberrations are grouped within the boxes according to the order of occurrence. The reconstructed evolutionary trees suggest intermediate (white boxes), probably rare, subclones that were not reported in the cytogenetic data.
Deconvolution of a mathematical mixture of SHM data with polyallelic mutations in a single nucleotide
SHM introduces mutations that target the variable regions associated with immune adaptivity in the Ig loci. In particular, SHM involves a programmed process of mutations that affects the variable regions of immunoglobulin genes and starts from an initial dividing single cell (a naïve B cell in this case). All descendants of the founder cell accumulate mutations and, at the same time, are subjected to a strong selective pressure. For this reason, SHM is a particularly good biological model system to test our deconvolution method, which imposes tree-like evolutionary constraints.
We considered a data set where 20 mutated nucleotides in the V(D)J region of the Ig locus were measured in eight sequences extracted from the same germinal center (see ‘Materials and Methods’ section) (116). This data set was particularly interesting because of the high number of mutations found and because of the presence of polyallelic mutations.
We mathematically mixed the multi-subclonal data and applied our TrAp algorithm taking into account that the SHM scenario consists of nonbinary aberrations. We mixed these subclones using random nonnegative coefficients and performed 1000 simulations. In all simulations, TrAp was able to recover the original sequences and the solution was unique in 65% of the simulations. The TrAp solution of one simulation is shown in Figure 6. However, even if the solution was not always unique, in >97% of the simulations there were only five or less candidate solutions satisfying the evolutionary, parsimony and sparsity constraints, all of which correctly identified at least six out of seven subclones.
Figure 6.

Deconvolution of a random mixture of eight sequences from SHM data. Eight sequences from the Ig locus of eight cells extracted from the same germinal center were mixed with the random coefficients given by  . Since sequences five and eight are identical, they are grouped in a single clone whose relative frequency is
  . In total, 20 mutated nucleotides were found in the data, and two different mutations were identified at position 170. Mutations are shown using the notation ‘
 ’, e.g., the notation
  indicates that the nucleotide at position 170 was mutated from Adenine to Guanine. The notation
  indicates that the nucleotide at position 170 was mutated twice, first from Adenine to Guanine and then from Guanine to Cytosine. In this example, all seven subclones were correctly deconvolved by the TrAp algorithm, the frequency of the subclones was correctly estimated and the solution was unique.
In addition to the identification of the underlying subclones, the TrAp algorithm generates evolutionary trees, which represent the B cell lineage during the SHM process. The reconstruction of B cell lineage can provide important insights into the mechanisms that regulate adaptive immunity. B cell lineage reconstruction is generally performed using maximum parsimony constraints (98) using the sequences of several Ig loci as input. However, in contrast to these approaches, the TrAp algorithm is able to generate maximum parsimony trees when only the relative frequency of mutations at each nucleotide is available. Therefore, the TrAp algorithm can be used to generate parsimonious evolutionary trees when only partial sequence information is available, e.g. when only short read sequences from a single aggregate sample are available, or when the loci analyzed span a region that is too large to be fully sequenced, or when the loci analyzed are distributed on different chromosomes (e.g. sequences from both Immunoglobulin heavy and light chains).
Analysis of tumor biopsies
Comparison between subclonal aberration profiles inferred from heterogeneous cell populations and single-cell aberration profiles
We analyzed data from a recent study on renal cell carcinoma where two aggregate samples and 20 single cells were isolated from a ccRCC and subjected to exome sequencing. Interestingly, the original study only showed partial similarity between the single cells and the aggregate (64). However, because the single cells and the aggregate used in the experiments are from the same tumor, we sought to investigate whether any subclones inferred by TrAp would share a similar combination of mutations found in any of the single cells.
We applied our TrAp algorithm to the aggregate sample and obtained an evolutionary tree consisting of three main subclones. Due to the lack of extensive validations, we limited ourselves to investigate whether mutations that co-occur in the TrAp solution also co-occur in single-cell samples. We considered the mutations that were validated by bioinformatics analysis [Supplementary Table S3A from Xu et al. (64)] and by PCR validation [Supplementary Table S3B from Xu et al. (64)]. The fraction of correctly estimated co-occurrences was 0.76 for mutations validated by bioinformatics analysis and 0.74 for mutations validated by PCR.
AML data
Next, we used our TrAp algorithm to investigate the clonal evolution of eight AML patients. For each patient, three samples (normal, tumor, relapse) were collected and sequenced by Ding et al. (18). Minor allele frequencies of somatic mutations were estimated from the sequencing data [Supplementary Tables S5a and S6a–g from Ding et al. (18)] and clustered using MCLUST for patient UPN933124 [Supplementary Table S5c from Ding et al. (18)] or Kernel Density Estimation for the other seven patients [Supplementary Table S10 from Ding et al. (18)]. Since the frequency of each cluster was estimated by the median, we used median absolute deviation and a default scale factor of 1.4826 to estimate confidence intervals under the assumption of an underlying normal distribution (135). The aggregate signal yi and measurement error  for each cluster of mutations i were then estimated as
| (5) |
where yj is the estimated aggregate signal of mutation j.
The clonal evolutions inferred by the TrAp algorithm (Supplementary Figures S6–S13) are in agreement with those inferred by Ding et al., who used deductive reasoning to manually derive the subclonal evolution (18). This agreement was expected as all the observations used by Ding et al. to generate the evolutionary trees are corollaries of our evolutionarity and sparsity constraints and are therefore automatically enforced by the TrAp method. In addition, the TrAp program listed all evolutionary trees compatible with the input data and provide additional insights on the possible origin of sublclones in the relapses of patient UPN758168 (Supplementary Figure S7) and UPN452198 (Supplementary Figure S10).
Melanoma data
Finally, we applied our algorithm to investigate evolutionary mechanisms in tumor metastases using exome sequencing data from three tumor metastases (TM1: left lateral chest wall, TM4: pleural cavity and TM3: right axilla) and a matched normal sample (N: left lateral chest wall) of one melanoma patient (121). TrAp can efficiently handle aggregate signal vectors of ∼20 unique frequencies and therefore we perform deconvolution analysis only on one chromosome. We selected chromosome 18, as it contains the tumor suppressor DCC gene, which is known to exhibit a high load of mutations only in melanoma (136), in contrast to low expression, loss of heterozygosity or epigenetic silencing in other tumors.
To apply the TrAp algorithm, we first preprocessed the data and selected 19 mutations on chromosome 18 (see ‘Materials and Methods’ section). We labeled each mutation according to the gene affected and the amino acid change caused by the mutation (e.g. the label DCC.L1099H indicates a mutation in the DCC gene that causes a mutation from a Leucine to a Histidine at position 1099 in the DCC protein). There are six mutations with  frequency in all samples (including the normal): ADNP2.G54G, ALPK2.I2157V, CD226.S307G, DCC.F23L, NETO1.S481N and SLC39A6.E119D. The only other mutation found in the normal sample was TCEB3CL.S301C, which occurs with frequency
  in all samples. Moreover, the mutations ALPK2.R136S, CHST9.S122N, FAM38B.V2463, LAMA1.S1577A, LAMA1.K2002E, MYOM1.T215M, SERPINB10.R246C and SLC14A2.A880T were found in all three tumor samples and shared a similar frequency profile. The mutations DSC3.A28D, DSG1.M11V and IMPACT.D125E were found only in the metastases samples TM3 and TM4 and shared a similar frequency profile. Finally, the mutation DCC.L1099H was found only in the sample TM3.
Since none of the genomic positions analyzed contained polyallelic mutations, we assigned a binary state (normal/mutated) to each selected genomic position and we estimated the aggregate signal and measurement error for each mutation event using a normal approximation as
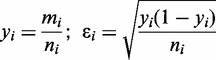 |
(6) |
where ni is total the number of reads covering position i, and mi is the number of reads with a mutation in position i. Finally, the y and  vectors were used as input for the TrAp algorithm. We run the TrAp algorithm using the normal error model option.
Independent runs on the three metastatic samples gave 33 optimal solutions for TM1, 222 for TM3 and only 1 TrAp solution for TM4. These high numbers of solutions are due to the substantial noise of the experiment (in the range 0.005–0.025) and the fact that in samples TM1 and TM3, two of the subclones have similar frequencies and are thus difficult to separate from one another. However, TrAp identified a unique solution in the sample TM4, where the three populated subclones are distributed with significantly different frequencies (Figure 7 middle). Next, we reasoned that the metastatic TM1, TM3 and TM4 samples may share common ancestors and that their evolutionary profiles may be related. We then applied our TrAp algorithm while also imposing that all evolutionary trees must be a subset of one global evolutionary tree. This approach returned a unique solution for each sample, all of which were among the solution sets identified in the previous analyses. We observe that this approach can be very powerful because, in principle, it allows the reconstruction of large trees by combining several snapshots of the related subclonal populations.
Figure 7.

Evolutionary trees inferred from three metastases of a melanoma patient. Each subclone in these trees is represented by a box with a list of mutations that includes only its new mutations (ancestral mutations can be read off by tracing back the mutation lists of all of its ancestors). Mutations are labeled according to the gene affected and the amino acid change caused by the mutation (e.g. the label DCC.L1099H indicates a mutation in the DCC gene that causes a mutation from a Leucine to a Histidine at position 1099 in the DCC protein). Highly expressed genes from this patient are indicated in bold. Mutations in the left branch of TM4 are more abundant than in TM1 and TM3. 44% (19%) of the subclones of TM3 (TM4) have mutations in DSC3, DSG1 and IMPACT. The TM3 subclone has an additional mutation in DCC.
The results of the deconvolution are shown in Figure 7. We observe the presence of two main branches. Mutations in the left branch of TM4 (77%) are more abundant than in TM1 and TM3 (48%). We note that Laminin, alpha 1 (LAMA1), a protein that is involved in cell adhesion, is present in the right branch. 44% (19%) of the subclones of TM3 (TM4) have mutations in Desmocollin-3 (DSC3), Desmoglein-1 (DSG1) and Impact RWD Domain Protein (IMPACT). The TM3 subclone also acquires a second mutation in the DCC gene (DCC.L1099H-L) in addition to the mutation DCC.F23L, which was hereditary. The novel mutation in the DCC gene occurs close to the boundary between the extracellular domain and the transmembrane domain of the protein product. The resulting Histidine amino acid is positively charged, opposed to the Leucine amino acid of the wildtype, which is neutrally charged. Since this change is next to the cell membrane, it may have repercussions on the functionality of the DCC protein product, perhaps causing inactivation, similar to the inactivation caused by loss of heterozygosity and transcript suppression observed in other cancer types.
DISCUSSION
In the present study, we described the TrAp algorithm, a tool for inferring subclonal composition and abundance from a single aggregate measurement experiment. As we have shown, TrAp is robust to noise and it can deconvolve mixtures where multiple mutations occur at the same locus. TrAp efficiently enumerates all possible solutions that are compatible with the model constraints, thus always identifying the sparsest and most parsimonious solution(s). However, TrAp will also generate trees [cf. Supplementary Equation (S1)] in cases where no tree structure can be inferred. As we have shown, such structures, while deviating from the true underlying population structure, can still capture relevant co-occurrences of mutations that are specific to certain subclones. Further, in contrast to parsimonious neighbor-joining approaches, which rely on sampling single subclones from the population (e.g. single-cell experiments), TrAp uses aggregate experiments as input, thus overcoming the issue of small sampling size, which may be insufficient to cover the whole spectrum of subclones in a sample. We successfully deconvolved systems of up to 25 aberrations. Although this number is not large enough to consider all somatic mutations found in a tumor sample, this problem can be circumvented by clustering aberrations with similar frequencies before running the TrAp algorithm.
The level of characterization achieved by subclonal deconvolution holds high potential for personalized therapies. Possible applications include the classification of subclones in primary tumors, the identification of the seeds of metastases, tracing of resistant subclones especially after drug treatments and developing treatment strategies to eliminate resistant subclones. Furthermore, our proposed model can be applied to other medical problems, such as tracing bacterial or viral paths of adaptation within the infected host, detailed genome-wide reconstruction of the epigenetic differentiation program or class specification in the hematopoietic system or in other systems.
SUPPLEMENTARY DATA
Supplementary Data are available at NAR Online.
ACKNOWLEDGEMENTS
We are thankful to Ruth Halaban, Michael Krauthammer and Perry Evans for providing the melanoma sequencing data. We are grateful to Steven Kleinstein, Mohamed Uduman and Gur Yaari for providing the somatic hypermutation data and for helpful discussions. Finally, we thank Jiaqi Jin and Kelly Stanton for critical readings of the manuscript.
FUNDING
American-Italian Cancer Foundation [Post-Doctoral Research Fellowship to F.S.]; National Science Foundation [IGERT0333389 to M.M.]; NIH [R0-1 CA158167 to Y.K.]; American Cancer Society Award [M130572 to F.S.]; Yale Cancer Center translational research pilot funds [to F.P. and F.S.]; the Peter T. Rowley Breast Cancer Research Projects funded by the New York State Department of Health FAU [0812160900 to Y.K.]. Funding for open access charge: The Peter T. Rowley Breast Cancer Research Projects funded by the New York State Department of Health [FAU 0812160900].
Conflict of interest statement. None declared.
REFERENCES
- 1.Nowell P. The clonal evolution of tumor cell populations. Science. 1976;194:23–28. doi: 10.1126/science.959840. [DOI] [PubMed] [Google Scholar]
- 2.Greaves M, Maley CC. Clonal evolution in cancer. Nature. 2012;481:306–313. doi: 10.1038/nature10762. [DOI] [PMC free article] [PubMed] [Google Scholar]
- 3.Anderson K, Lutz C, van Delft FW, Bateman CM, Guo Y, Colman SM, Kempski H, Moorman AV, Titley I, Swansbury J, et al. Genetic variegation of clonal architecture and propagating cells in leukaemia. Nature. 2011;469:356–361. doi: 10.1038/nature09650. [DOI] [PubMed] [Google Scholar]
- 4.Cairns J. Mutation selection and the natural history of cancer. Sci. Aging Knowledge Environ. 2006;2006:cp1. [Google Scholar]
- 5.Klein CA. Parallel progression of primary tumours and metastases. Nat. Rev. Cancer. 2009;9:302–312. doi: 10.1038/nrc2627. [DOI] [PubMed] [Google Scholar]
- 6.Gerlinger M, Rowan AJ, Horswell S, Larkin J, Endesfelder D, Gronroos E, Martinez P, Matthews N, Stewart A, Tarpey P, et al. Intratumor heterogeneity and branched evolution revealed by multiregion sequencing. N. Engl. J. Med. 2012;366:883–892. doi: 10.1056/NEJMoa1113205. [DOI] [PMC free article] [PubMed] [Google Scholar]
- 7.Campbell PJ, Pleasance ED, Stephens PJ, Dicks E, Rance R, Goodhead I, Follows GA, Green AR, Futreal PA, Stratton MR. Subclonal phylogenetic structures in cancer revealed by ultra-deep sequencing. Proc. Natl Acad. Sci. USA. 2008;105:13081–13086. doi: 10.1073/pnas.0801523105. [DOI] [PMC free article] [PubMed] [Google Scholar]
- 8.Hanahan D, Weinberg RA. Hallmarks of cancer: the next generation. Cell. 2011;144:646–674. doi: 10.1016/j.cell.2011.02.013. [DOI] [PubMed] [Google Scholar]
- 9.Podlaha O, Riester M, De S, Michor F. Evolution of the cancer genome. Trends Genet. 2012;28:155–163. doi: 10.1016/j.tig.2012.01.003. [DOI] [PMC free article] [PubMed] [Google Scholar]
- 10.Shah SP, Roth A, Goya R, Oloumi A, Ha G, Zhao Y, Turashvili G, Ding J, Tse K, Haffari G, et al. The clonal and mutational evolution spectrum of primary triple-negative breast cancers. Nature. 2012;486:395–399. doi: 10.1038/nature10933. [DOI] [PMC free article] [PubMed] [Google Scholar]
- 11.Notta F, Mullighan CG, Wang JCY, Poeppl A, Doulatov S, Phillips LA, Ma J, Minden MD, Downing JR, Dick JE. Evolution of human BCR—ABL1 lymphoblastic leukaemia-initiating cells. Nature. 2011;469:362–367. doi: 10.1038/nature09733. [DOI] [PubMed] [Google Scholar]
- 12.Driessens G, Beck B, Caauwe A, Simons BD, Blanpain C. Defining the mode of tumour growth by clonal analysis. Nature. 2012;488:527–530. doi: 10.1038/nature11344. [DOI] [PMC free article] [PubMed] [Google Scholar]
- 13.Chen J, Li Y, Yu TS, McKay RM, Burns DK, Kernie SG, Parada LF. A restricted cell population propagates glioblastoma growth after chemotherapy. Nature. 2012;488:522–526. doi: 10.1038/nature11287. [DOI] [PMC free article] [PubMed] [Google Scholar]
- 14.Schepers AG, Snippert HJ, Stange DE, vanden Born M, van Es JH, vande Wetering M, Clevers H. Lineage tracing reveals Lgr5+ stem cell activity in mouse intestinal adenomas. Science. 2012;337:730–735. doi: 10.1126/science.1224676. [DOI] [PubMed] [Google Scholar]
- 15.Loeb LA. Human cancers express mutator phenotypes: origin, consequences and targeting. Nat. Rev. Cancer. 2011;11:450–457. doi: 10.1038/nrc3063. [DOI] [PMC free article] [PubMed] [Google Scholar]
- 16.Park SY, Gönen M, Kim HJ, Michor F, Polyak K. Cellular and genetic diversity in the progression of in situ human breast carcinomas to an invasive phenotype. J. Clin. Invest. 2010;120:636–644. doi: 10.1172/JCI40724. [DOI] [PMC free article] [PubMed] [Google Scholar]
- 17.Walter MJ, Shen D, Ding L, Shao J, Koboldt DC, Chen K, Larson DE, McLellan MD, Dooling D, Abbott R, et al. Clonal architecture of secondary acute myeloid leukemia. N. Engl. J. Med. 2012;366:1090–1098. doi: 10.1056/NEJMoa1106968. [DOI] [PMC free article] [PubMed] [Google Scholar]
- 18.Ding L, Ley TJ, Larson DE, Miller CA, Koboldt DC, Welch JS, Ritchey JK, Young MA, Lamprecht T, McLellan MD, et al. Clonal evolution in relapsed acute myeloid leukaemia revealed by whole-genome sequencing. Nature. 2012;481:506–510. doi: 10.1038/nature10738. [DOI] [PMC free article] [PubMed] [Google Scholar]
- 19.Merlo LM, Shah NA, Li X, Blount PL, Vaughan TL, Reid BJ, Maley CC. A comprehensive survey of clonal diversity measures in Barrett’s esophagus as biomarkers of progression to esophageal adenocarcinoma. Cancer Prev. Res. (Phila.) 2010;3:1388–1397. doi: 10.1158/1940-6207.CAPR-10-0108. [DOI] [PMC free article] [PubMed] [Google Scholar]
- 20.Bedard PL, Sotiriou C. Decoding the evolution of a breast cancer genome. EMBO Mol. Med. 2010;2:3–5. doi: 10.1002/emmm.200900054. [DOI] [PMC free article] [PubMed] [Google Scholar]
- 21.Bellamy WT, Dalton WS, Gleason MC, Grogan TM, Trent JM. Development and characterization of a melphalan-resistant human multiple myeloma cell line. Cancer Res. 1991;51:995–1002. [PubMed] [Google Scholar]
- 22.Read AF, Day T, Huijben S. The evolution of drug resistance and the curious orthodoxy of aggressive chemotherapy. Proc. Natl Acad. Sci. USA. 2011;108(Suppl. 2):10871–10877. doi: 10.1073/pnas.1100299108. [DOI] [PMC free article] [PubMed] [Google Scholar]
- 23.Stratton M. Evolution of the Cancer Genome. Eur. J. Cancer. 2011;47:S35. [Google Scholar]
- 24.Yates LR, Campbell PJ. Evolution of the cancer genome. Nat. Rev. Genet. 2012;13:795–806. doi: 10.1038/nrg3317. [DOI] [PMC free article] [PubMed] [Google Scholar]
- 25.Crespi B, Summers K. Evolutionary biology of cancer. Trends Ecol. Evol. 2005;20:545–552. doi: 10.1016/j.tree.2005.07.007. [DOI] [PubMed] [Google Scholar]
- 26.Rodriguez-Brenes IA, Komarova NL, Wodarz D. Evolutionary dynamics of feedback escape and the development of stem-cell-driven cancers. Proc. Natl Acad. Sci. USA. 2011;108:18983–18988. doi: 10.1073/pnas.1107621108. [DOI] [PMC free article] [PubMed] [Google Scholar]
- 27.Iacobuzio-Donahue CA. Genetic evolution of pancreatic cancer: lessons learnt from the pancreatic cancer genome sequencing project. Gut. 2012;61:1085–1094. doi: 10.1136/gut.2010.236026. [DOI] [PMC free article] [PubMed] [Google Scholar]
- 28.Anderson GR, Stoler DL, Kahlenberg MS, Petrelli NJ. Genomic instability in sporadic colorectal cancer—A destabilized genome producing accelerated cellular evolution as the fundamental nature of cancer. In: Mihich E, Croce C, editors. The Biology of Tumors. New York: Springer; 1998. pp. 51–56. [Google Scholar]
- 29.Marusyk A, Almendro V, Polyak K. Intra-tumour heterogeneity: a looking glass for cancer? Br. J. Cancer. 2012;12:323–334. doi: 10.1038/nrc3261. [DOI] [PubMed] [Google Scholar]
- 30.Hazlehurst LA, Foley NE, Gleason-Guzman MC, Hacker MP, Cress AE, Greenberger LW, De Jong MC, Dalton WS. Multiple mechanisms confer drug resistance to mitoxantrone in the human 8226 myeloma cell line. Cancer Res. 1999;59:1021–1028. [PubMed] [Google Scholar]
- 31.Zhang QC, Austin RH. Physics of Cancer: The Impact of Heterogeneity. Annu. Rev. Condensed Matter Phys. 2012;3:363–382. [Google Scholar]
- 32.Hampton OA, Den Hollander P, Miller CA, Delgado DA, Li J, Coarfa C, Harris RA, Richards S, Scherer SE, Muzny DM, et al. A sequence-level map of chromosomal breakpoints in the MCF-7 breast cancer cell line yields insights into the evolution of a cancer genome. Genome Res. 2009;19:167–177. doi: 10.1101/gr.080259.108. [DOI] [PMC free article] [PubMed] [Google Scholar]
- 33.Silva AS, Gatenby RA. A theoretical quantitative model for evolution of cancer chemotherapy resistance. Biol. Direct. 2010;5:25. doi: 10.1186/1745-6150-5-25. [DOI] [PMC free article] [PubMed] [Google Scholar]
- 34.Parisi F, Micsinai M, Strino F, Ariyan S, Narayan D, Bacchiocchi A, Cheng E, Xu F, Li P, Kluger H, et al. Integrated analysis of tumor samples sheds light on tumor heterogeneity. Yale J. Biol. Med. 2012;85:347–361. [PMC free article] [PubMed] [Google Scholar]
- 35.Mullighan CG, Phillips LA, Su X, Ma J, Miller CB, Shurtleff SA, Downing JR. Genomic analysis of the clonal origins of relapsed acute lymphoblastic leukemia. Science. 2008;322:1377–1380. doi: 10.1126/science.1164266. [DOI] [PMC free article] [PubMed] [Google Scholar]
- 36.Fidler IJ, Kripke ML. Metastasis results from preexisting variant cells within a malignant tumor. Science. 1977;197:893–895. doi: 10.1126/science.887927. [DOI] [PubMed] [Google Scholar]
- 37.Bouabdallah R, Abéna P, Chetaille B, Aurran-Schleinitz T, Sainty D, Dubus P, Arnoulet C, Coso D, Xerri L, Gastaut JA. True histiocytic lymphoma following B-acute lymphoblastic leukaemia: case report with evidence for a common clonal origin in both neoplasms. Br. J. Haematol. 2001;113:1047–1050. doi: 10.1046/j.1365-2141.2001.02841.x. [DOI] [PubMed] [Google Scholar]
- 38.Feldman AL, Berthold F, Arceci RJ, Abramowsky C, Shehata BM, Mann KP, Lauer SJ, Pritchard J, Raffeld M, Jaffe ES. Clonal relationship between precursor T-lymphoblastic leukaemia/lymphoma and Langerhans-cell histiocytosis. Lancet Oncol. 2005;6:435–437. doi: 10.1016/S1470-2045(05)70211-4. [DOI] [PubMed] [Google Scholar]
- 39.Feldman AL, Arber DA, Pittaluga S, Martinez A, Burke JS, Raffeld M, Camos M, Warnke R, Jaffe ES. Clonally related follicular lymphomas and histiocytic/dendritic cell sarcomas: evidence for transdifferentiation of the follicular lymphoma clone. Blood. 2008;111:5433–5439. doi: 10.1182/blood-2007-11-124792. [DOI] [PMC free article] [PubMed] [Google Scholar]
- 40.Shah SP, Morin RD, Khattra J, Prentice L, Pugh T, Burleigh A, Delaney A, Gelmon K, Guliany R, Senz J, et al. Mutational evolution in a lobular breast tumour profiled at single nucleotide resolution. Nature. 2009;461:809–813. doi: 10.1038/nature08489. [DOI] [PubMed] [Google Scholar]
- 41.Lambert G, Estévez-Salmeron L, Oh S, Liao D, Emerson BM, Tlsty TD, Austin RH. An analogy between the evolution of drug resistance in bacterial communities and malignant tissues. Nat. Rev. Cancer. 2011;11:375–382. doi: 10.1038/nrc3039. [DOI] [PMC free article] [PubMed] [Google Scholar]
- 42.Barretina J, Caponigro G, Stransky N, Venkatesan K, Margolin AA, Kim S, Wilson CJ, Lehar J, Kryukov GV, Sonkin D, et al. The Cancer Cell Line Encyclopedia enables predictive modelling of anticancer drug sensitivity. Nature. 2012;483:603–607. doi: 10.1038/nature11003. [DOI] [PMC free article] [PubMed] [Google Scholar]
- 43.Dalton WS, Durie BG, Alberts DS, Gerlach JH, Cress AE. Characterization of a new drug-resistant human myeloma cell line that expresses P-glycoprotein. Cancer Res. 1986;46:5125–5130. [PubMed] [Google Scholar]
- 44.Durrett R, Moseley S. Evolution of resistance and progression to disease during clonal expansion of cancer. Theor. Popul. Biol. 2010;77:42–48. doi: 10.1016/j.tpb.2009.10.008. [DOI] [PubMed] [Google Scholar]
- 45.Iwasa Y, Nowak MA, Michor F. Evolution of resistance during clonal expansion. Genetics. 2006;172:2557–2566. doi: 10.1534/genetics.105.049791. [DOI] [PMC free article] [PubMed] [Google Scholar]
- 46.Gerlinger M, Swanton C. How Darwinian models inform therapeutic failure initiated by clonal heterogeneity in cancer medicine. Br. J. Cancer. 2010;103:1139–1143. doi: 10.1038/sj.bjc.6605912. [DOI] [PMC free article] [PubMed] [Google Scholar]
- 47.Boyd SD, Marshall EL, Merker JD, Maniar JM, Zhang LN, Sahaf B, Jones CD, Simen BB, Hanczaruk B, Nguyen KD, et al. Measurement and clinical monitoring of human lymphocyte clonality by massively parallel VDJ pyrosequencing. Sci. Transl. Med. 2009;1 doi: 10.1126/scitranslmed.3000540. 12ra23. [DOI] [PMC free article] [PubMed] [Google Scholar]
- 48.Greulich P, Waclaw B, Allen RJ. Mutational pathway determines whether drug gradients accelerate evolution of drug-resistant cells. Phys. Rev. Lett. 2012;109:088101. doi: 10.1103/PhysRevLett.109.088101. [DOI] [PubMed] [Google Scholar]
- 49.Aktipis CA, Kwan VSY, Johnson KA, Neuberg SL, Maley CC. Overlooking evolution: a systematic analysis of cancer relapse and therapeutic resistance research. PLoS One. 2011;6:e26100. doi: 10.1371/journal.pone.0026100. [DOI] [PMC free article] [PubMed] [Google Scholar]
- 50.Campbell PJ, Yachida S, Mudie LJ, Stephens PJ, Pleasance ED, Stebbings LA, Morsberger LA, Latimer C, McLaren S, Lin ML, et al. The patterns and dynamics of genomic instability in metastatic pancreatic cancer. Nature. 2010;467:1109–1113. doi: 10.1038/nature09460. [DOI] [PMC free article] [PubMed] [Google Scholar]
- 51.Saunders NA, Simpson F, Thompson EW, Hill MM, Endo-Munoz L, Leggatt G, Minchin RF, Guminski A. Role of intratumoural heterogeneity in cancer drug resistance: molecular and clinical perspectives. EMBO Mol. Med. 2012;4:675–684. doi: 10.1002/emmm.201101131. [DOI] [PMC free article] [PubMed] [Google Scholar]
- 52.Roesch A, Fukunaga-Kalabis M, Schmidt EC, Zabierowski SE, Brafford PA, Vultur A, Basu D, Gimotty P, Vogt T, Herlyn M. A temporarily distinct subpopulation of slow-cycling melanoma cells is required for continuous tumor growth. Cell. 2010;141:583–594. doi: 10.1016/j.cell.2010.04.020. [DOI] [PMC free article] [PubMed] [Google Scholar]
- 53.Fidler IJ, Kripke ML. Genomic analysis of primary tumors does not address the prevalence of metastatic cells in the population. Nat. Genet. 2003;34:23–23. doi: 10.1038/ng0503-23a. [DOI] [PubMed] [Google Scholar]
- 54.Gatenby RA, Silva AS, Gillies RJ, Frieden BR. Adaptive therapy. Cancer Res. 2009;69:4894–4903. doi: 10.1158/0008-5472.CAN-08-3658. [DOI] [PMC free article] [PubMed] [Google Scholar]
- 55.Huang S, Hölzel M, Knijnenburg T, Schlicker A, Roepman P, McDermott U, Garnett M, Grernrum W, Sun C, Prahallad A, et al. MED12 controls the response to multiple cancer drugs through regulation of TGF-β receptor signaling. Cell. 2012;151:937–950. doi: 10.1016/j.cell.2012.10.035. [DOI] [PMC free article] [PubMed] [Google Scholar]
- 56.Avner BS, Fialho AM, Chakrabarty AM. Overcoming drug resistance in multi-drug resistant cancers and microorganisms: a conceptual framework. Bioengineered. 2012;3:262–270. doi: 10.4161/bioe.21130. [DOI] [PMC free article] [PubMed] [Google Scholar]
- 57.Lee MJ, Ye AS, Gardino AK, Heijink AM, Sorger PK, MacBeath G, Yaffe MB. Sequential application of anticancer drugs enhances cell death by rewiring apoptotic signaling networks. Cell. 2012;149:780–794. doi: 10.1016/j.cell.2012.03.031. [DOI] [PMC free article] [PubMed] [Google Scholar]
- 58.Xia Z, Zhang L, Chen Q, Royal C, Yu Z, Liu Z, Adam BL. Stable reversal of multidrug resistance in colon cancer cells by RNA interference targeting the MDR1 gene. Mol. Med. Report. 2009;2:579–584. doi: 10.3892/mmr_00000140. [DOI] [PubMed] [Google Scholar]
- 59.Szakács G, Paterson JK, Ludwig JA, Booth-Genthe C, Gottesman MM. Targeting multidrug resistance in cancer. Nat. Rev. Drug Discov. 2006;5:219–234. doi: 10.1038/nrd1984. [DOI] [PubMed] [Google Scholar]
- 60.Diaz-Cano SJ. Tumor heterogeneity: mechanisms and bases for a reliable application of molecular marker design. Int. J. Mol. Sci. 2012;13:1951–2011. doi: 10.3390/ijms13021951. [DOI] [PMC free article] [PubMed] [Google Scholar]
- 61.Lee AJX, Swanton C. Tumour heterogeneity and drug resistance: personalising cancer medicine through functional genomics. Biochem. Pharmacol. 2012;83:1013–1020. doi: 10.1016/j.bcp.2011.12.008. [DOI] [PubMed] [Google Scholar]
- 62.Navin N, Kendall J, Troge J, Andrews P, Rodgers L, McIndoo J, Cook K, Stepansky A, Levy D, Esposito D, et al. Tumour evolution inferred by single-cell sequencing. Nature. 2011;472:90–94. doi: 10.1038/nature09807. [DOI] [PMC free article] [PubMed] [Google Scholar]
- 63.Irish JM, Hovland R, Krutzik PO, Perez OD, Bruserud Ø, Gjertsen BT, Nolan GP. Single cell profiling of potentiated phospho-protein networks in cancer cells. Cell. 2004;118:217–228. doi: 10.1016/j.cell.2004.06.028. [DOI] [PubMed] [Google Scholar]
- 64.Xu X, Hou Y, Yin XY, Bao L, Tang AF, Song LT, Li FQ, Tsang S, Wu K, Wu HJ, et al. Single-cell exome sequencing reveals single-nucleotide mutation characteristics of a Kidney Tumor. Cell. 2012;148:886–895. doi: 10.1016/j.cell.2012.02.025. [DOI] [PMC free article] [PubMed] [Google Scholar]
- 65.Hou Y, Song LT, Zhu P, Zhang B, Tao Y, Xu X, Li FQ, Wu K, Liang J, Shao D, et al. single-cell exome sequencing and monoclonal evolution of a JAK2-negative myeloproliferative neoplasm. Cell. 2012;148:873–885. doi: 10.1016/j.cell.2012.02.028. [DOI] [PubMed] [Google Scholar]
- 66.Nik-Zainal S, Van Loo P, Wedge DC, Alexandrov LB, Greenman CD, Lau KW, Raine K, Jones D, Marshall J, Ramakrishna M, et al. The life history of 21 breast cancers. Cell. 2012;149:994–1007. doi: 10.1016/j.cell.2012.04.023. [DOI] [PMC free article] [PubMed] [Google Scholar]
- 67.Navin N, Hicks J. Future medical applications of single-cell sequencing in cancer. Genome Med. 2011;3:31. doi: 10.1186/gm247. [DOI] [PMC free article] [PubMed] [Google Scholar]
- 68.Sjö LD, Poulsen CB, Hansen M, Møller MB, Ralfkiaer E. Profiling of diffuse large B-cell lymphoma by immunohistochemistry: identification of prognostic subgroups. Eur. J. Haematol. 2007;79:501–507. doi: 10.1111/j.1600-0609.2007.00976.x. [DOI] [PubMed] [Google Scholar]
- 69.Varma M, Jasani B. Diagnostic utility of immunohistochemistry in morphologically difficult prostate cancer: review of current literature. Histopathology. 2005;47:1–16. doi: 10.1111/j.1365-2559.2005.02188.x. [DOI] [PubMed] [Google Scholar]
- 70.Yamamoto N, Yang M, Jiang P, Xu M, Tsuchiya H, Tomita K, Moossa AR, Hoffman RM. Determination of clonality of metastasis by cell-specific color-coded fluorescent-protein imaging. Cancer Res. 2003;63:7785–7790. [PubMed] [Google Scholar]
- 71.Attolini CSO, Michor F. Evolutionary theory of cancer. Ann. N. Y. Acad. Sci. 2009;1168:23–51. doi: 10.1111/j.1749-6632.2009.04880.x. [DOI] [PubMed] [Google Scholar]
- 72.Navin N, Krasnitz A, Rodgers L, Cook K, Meth J, Kendall J, Riggs M, Eberling Y, Troge J, Grubor V, et al. Inferring tumor progression from genomic heterogeneity. Genome Res. 2010;20:68–80. doi: 10.1101/gr.099622.109. [DOI] [PMC free article] [PubMed] [Google Scholar]
- 73.Halaban R, Zhang W, Bacchiocchi A, Cheng E, Parisi F, Ariyan S, Krauthammer M, McCusker JP, Kluger Y, Sznol M. PLX4032, a selective BRAFV600E kinase inhibitor, activates the ERK pathway and enhances cell migration and proliferation of BRAFWT melanoma cells. Pigment Cell Melanoma Res. 2010;23:190–200. doi: 10.1111/j.1755-148X.2010.00685.x. [DOI] [PMC free article] [PubMed] [Google Scholar]
- 74.Banerji S, Cibulskis K, Rangel-Escareno C, Brown KK, Carter SL, Frederick AM, Lawrence MS, Sivachenko AY, Sougnez C, Zou L, et al. Sequence analysis of mutations and translocations across breast cancer subtypes. Nature. 2012;486:405–409. doi: 10.1038/nature11154. [DOI] [PMC free article] [PubMed] [Google Scholar]
- 75.Matsushita H, Vesely MD, Koboldt DC, Rickert CG, Uppaluri R, Magrini VJ, Arthur CD, White JM, Chen YS, Shea LK, et al. Cancer exome analysis reveals a T-cell-dependent mechanism of cancer immunoediting. Nature. 2012;482:400–404. doi: 10.1038/nature10755. [DOI] [PMC free article] [PubMed] [Google Scholar]
- 76.Varela I, Tarpey P, Raine K, Huang D, Ong CK, Stephens P, Davies H, Jones D, Lin ML, Teague J, et al. Exome sequencing identifies frequent mutation of the SWI/SNF complex gene PBRM1 in renal carcinoma. Nature. 2011;469:539–542. doi: 10.1038/nature09639. [DOI] [PMC free article] [PubMed] [Google Scholar]
- 77.Alexandrov LB, Nik-Zainal S, Wedge DC, Campbell PJ, Stratton MR. Deciphering signatures of mutational processes operative in human cancer. Cell Rep. 2013;3:246–259. doi: 10.1016/j.celrep.2012.12.008. [DOI] [PMC free article] [PubMed] [Google Scholar]
- 78.Lee DD, Seung HS. Learning the parts of objects by non-negative matrix factorization. Nature. 1999;401:788–791. doi: 10.1038/44565. [DOI] [PubMed] [Google Scholar]
- 79.Hyvärinen A. Fast and robust fixed-point algorithms for independent component analysis. IEEE Trans. Neural. Netw. 1999;10:626–634. doi: 10.1109/72.761722. [DOI] [PubMed] [Google Scholar]
- 80.Attias H. Independent factor analysis. Neural. Comput. 1999;11:803–851. doi: 10.1162/089976699300016458. [DOI] [PubMed] [Google Scholar]
- 81.Li JJ, Jiang CR, Brown JB, Huang H, Bickel PJ. Sparse linear modeling of next-generation mRNA sequencing (RNA-Seq) data for isoform discovery and abundance estimation. Proc. Natl Acad. Sci. USA. 2011;108:19867–19872. doi: 10.1073/pnas.1113972108. [DOI] [PMC free article] [PubMed] [Google Scholar]
- 82.Gong T, Hartmann N, Kohane IS, Brinkmann V, Staedtler F, Letzkus M, Bongiovanni S, Szustakowski JD. Optimal deconvolution of transcriptional profiling data using quadratic programming with application to complex clinical blood samples. PLoS One. 2011;6:e27156. doi: 10.1371/journal.pone.0027156. [DOI] [PMC free article] [PubMed] [Google Scholar]
- 83.Repsilber D, Kern S, Telaar A, Walzl G, Black GF, Selbig J, Parida SK, Kaufmann SHE, Jacobsen M. Biomarker discovery in heterogeneous tissue samples -taking the in-silico deconfounding approach. BMC Bioinformatics. 2010;11:27. doi: 10.1186/1471-2105-11-27. [DOI] [PMC free article] [PubMed] [Google Scholar]
- 84.Erkkilä T, Lehmusvaara S, Ruusuvuori P, Visakorpi T, Shmulevich I, Lähdesmäki H. Probabilistic analysis of gene expression measurements from heterogeneous tissues. Bioinformatics. 2010;26:2571–2577. doi: 10.1093/bioinformatics/btq406. [DOI] [PMC free article] [PubMed] [Google Scholar]
- 85.Quon G, Morris Q. ISOLATE: a computational strategy for identifying the primary origin of cancers using high-throughput sequencing. Bioinformatics. 2009;25:2882–2889. doi: 10.1093/bioinformatics/btp378. [DOI] [PMC free article] [PubMed] [Google Scholar]
- 86.Shen-Orr SS, Tibshirani R, Khatri P, Bodian DL, Staedtler F, Perry NM, Hastie T, Sarwal MM, Davis MM, Butte AJ. Cell type-specific gene expression differences in complex tissues. Nat. Methods. 2010;7:287–289. doi: 10.1038/nmeth.1439. [DOI] [PMC free article] [PubMed] [Google Scholar]
- 87.Dunson DB. Nonparametric Bayes applications to biostatistics. In: Hjort NL, Holmes C, Müller P, Walker SG, editors. Bayesian Nonparametrics. Vol. 28. Cambridge: Cambridge University Press; 2010. pp. 223–273. [Google Scholar]
- 88.Farris JS. Estimation of conservatism of characters by constancy within biological populations. Evolution. 1966;20:587–591. doi: 10.1111/j.1558-5646.1966.tb03389.x. [DOI] [PubMed] [Google Scholar]
- 89.Kluge AG, Farris JS. Quantitative phyletics and the evolution of anurans. Syst. Biol. 1969;18:1–32. [Google Scholar]
- 90.Huelsenbeck JP, Ronquist F, Nielsen R, Bollback JP. Bayesian inference of phylogeny and its impact on evolutionary biology. Science. 2001;294:2310–2314. doi: 10.1126/science.1065889. [DOI] [PubMed] [Google Scholar]
- 91.Doyon JP, Ranwez V, Daubin V, Berry V. Models, algorithms and programs for phylogeny reconciliation. Brief. Bioinform. 2011;12:392–400. doi: 10.1093/bib/bbr045. [DOI] [PubMed] [Google Scholar]
- 92.Chen SC, Lindsay BG. Building mixture trees from binary sequence data. Biometrika. 2006;93:843–860. [Google Scholar]
- 93.Kannan L, Wheeler WC. Maximum Parsimony on Phylogenetic networks. Algorithms Mol. Biol. 2012;7:9. doi: 10.1186/1748-7188-7-9. [DOI] [PMC free article] [PubMed] [Google Scholar]
- 94.von Heydebreck A, Gunawan B, Füzesi L. Maximum likelihood estimation of oncogenetic tree models. Biostatistics. 2004;5:545–556. doi: 10.1093/biostatistics/kxh007. [DOI] [PubMed] [Google Scholar]
- 95.Hjelm M, Höglund M, Lagergren J. New probabilistic network models and algorithms for oncogenesis. J. Comput. Biol. 2006;13:853–865. doi: 10.1089/cmb.2006.13.853. [DOI] [PubMed] [Google Scholar]
- 96.Radmacher MD, Simon R, Desper R, Taetle R, Schäffer AA, Nelson MA. Graph models of oncogenesis with an application to melanoma. J. Theor. Biol. 2001;212:535–548. doi: 10.1006/jtbi.2001.2395. [DOI] [PubMed] [Google Scholar]
- 97.Greenman CD, Pleasance ED, Newman S, Yang F, Fu B, Nik-Zainal S, Jones D, Lau KW, Carter N, Edwards PA, et al. Estimation of rearrangement phylogeny for cancer genomes. Genome Res. 2012;22:346–361. doi: 10.1101/gr.118414.110. [DOI] [PMC free article] [PubMed] [Google Scholar]
- 98.Clement M, Posada D, Crandall KA. TCS: a computer program to estimate gene genealogies. Mol. Ecol. 2000;9:1657–1659. doi: 10.1046/j.1365-294x.2000.01020.x. [DOI] [PubMed] [Google Scholar]
- 99.Chen Z, Collins AM, Wang Y, Gaëta BA. Clustering-based identification of clonally-related immunoglobulin gene sequence sets. Immunome Res. 2010;6(Suppl. 1):S4. doi: 10.1186/1745-7580-6-S1-S4. [DOI] [PMC free article] [PubMed] [Google Scholar]
- 100.Desper R, Jiang F, Kallioniemi OP, Moch H, Papadimitriou CH, Schäffer AA. Inferring tree models for oncogenesis from comparative genome hybridization data. J. Comput. Biol. 1999;6:37–51. doi: 10.1089/cmb.1999.6.37. [DOI] [PubMed] [Google Scholar]
- 101.Desper R, Jiang F, Kallioniemi OP, Moch H, Papadimitriou CH, Schaffer AA. Distance-based reconstruction of tree models for oncogenesis. J. Comput. Biol. 2000;7:789–803. doi: 10.1089/10665270050514936. [DOI] [PubMed] [Google Scholar]
- 102.Sprouffske K, Pepper J, Maley CC. Accurate reconstruction of the temporal order of mutations in neoplastic progression. Cancer. Prev. Res. 2011;4:1135–1144. doi: 10.1158/1940-6207.CAPR-10-0374. [DOI] [PMC free article] [PubMed] [Google Scholar]
- 103.Tolliver D, Tsourakakis C, Subramanian A, Shackney S, Schwartz R. Robust unmixing of tumor states in array comparative genomic hybridization data. Bioinformatics. 2010;26:i106–i114. doi: 10.1093/bioinformatics/btq213. [DOI] [PMC free article] [PubMed] [Google Scholar]
- 104.Schwartz R, Shackney SE. Applying unmixing to gene expression data for tumor phylogeny inference. BMC Bioinformatics. 2010;11:42. doi: 10.1186/1471-2105-11-42. [DOI] [PMC free article] [PubMed] [Google Scholar]
- 105.Catanzaro D, Ravi R, Schwartz R. A mixed integer linear programming model to reconstruct phylogenies from single nucleotide polymorphism haplotypes under the maximum parsimony criterion Algorithms Mol. Biol. 2013;8:3. doi: 10.1186/1748-7188-8-3. [DOI] [PMC free article] [PubMed] [Google Scholar]
- 106.Subramanian A, Shackney S, Schwartz R. Inference of tumor phylogenies from genomic assays on heterogeneous samples. J. Biomed. Biotechnol. 2012;2012:797812. doi: 10.1155/2012/797812. [DOI] [PMC free article] [PubMed] [Google Scholar]
- 107.Parisi F, Ariyan S, Narayan D, Bacchiocchi A, Hoyt K, Cheng E, Xu F, Li P, Halaban R, Kluger Y. Detecting copy number status and uncovering subclonal markers in heterogeneous tumor biopsies. BMC Genomics. 2011;12:230. doi: 10.1186/1471-2164-12-230. [DOI] [PMC free article] [PubMed] [Google Scholar]
- 108.Yao A, Rubin H. Automatic enumeration and characterization of heterogeneous clonal progression in cell transformation. Proc. Natl Acad. Sci. USA. 1993;90:10524–10528. doi: 10.1073/pnas.90.22.10524. [DOI] [PMC free article] [PubMed] [Google Scholar]
- 109.Malaise EP, Chavaudra N, Tubiana M. The relationship between growth rate, labelling index and histological type of human solid tumours. Eur. J. Cancer. 1973;9:305–312. doi: 10.1016/0014-2964(73)90099-6. [DOI] [PubMed] [Google Scholar]
- 110.Bozic I, Antal T, Ohtsuki H, Carter H, Kim D, Chen S, Karchin R, Kinzler KW, Vogelstein B, Nowak MA. Accumulation of driver and passenger mutations during tumor progression. Proc. Natl Acad. Sci. USA. 2010;107:18545–18550. doi: 10.1073/pnas.1010978107. [DOI] [PMC free article] [PubMed] [Google Scholar]
- 111.Kimmel M. Evolution and cancer: a mathematical biology approach. Biol. Direct. 2010;5:29. doi: 10.1186/1745-6150-5-29. [DOI] [PMC free article] [PubMed] [Google Scholar]
- 112.Moghaddasi FL, Bezak E, Marcu L. In silico modelling of tumour margin diffusion and infiltration: review of current status. Comput. Math. Methods Med. 2012;2012:672895. doi: 10.1155/2012/672895. [DOI] [PMC free article] [PubMed] [Google Scholar]
- 113.Mitelman F, Johansson B, Mertens F. Mitelman Database of Chromosome Aberrations and Gene Fusions in Cancer. 2012 http://cgap.nci.nih.gov/Chromosomes/Mitelman (10 July 2013, date last accessed) [Google Scholar]
- 114.Liu M, Duke JL, Richter DJ, Vinuesa CG, Goodnow CC, Kleinstein SH, Schatz DG. Two levels of protection for the B cell genome during somatic hypermutation. Nature. 2008;451:841–845. doi: 10.1038/nature06547. [DOI] [PubMed] [Google Scholar]
- 115.Teng G, Papavasiliou FN. Immunoglobulin Somatic Hypermutation. Annu. Rev. Genet. 2007;41:107–120. doi: 10.1146/annurev.genet.41.110306.130340. [DOI] [PubMed] [Google Scholar]
- 116.Anderson SM, Khalil A, Uduman M, Hershberg U, Louzoun Y, Haberman AM, Kleinstein SH, Shlomchik MJ. Taking advantage: high-affinity B cells in the germinal center have lower death rates, but similar rates of division, compared to low-affinity cells. J. Immunol. 2009;183:7314–7325. doi: 10.4049/jimmunol.0902452. [DOI] [PMC free article] [PubMed] [Google Scholar]
- 117.Kleinstein SH. Computational laboratory for immunology & pathology. 2012 http://clip.med.yale.edu/trees/laser.html (10 July 2013, date last accessed) [Google Scholar]
- 118.Robinson J, Malik A, Parham P, Bodmer JG, Marsh SGE. IMGT/HLA Database – a sequence database for the human major histocompatibility complex. Tissue Antigens. 2000;55:280–287. doi: 10.1034/j.1399-0039.2000.550314.x. [DOI] [PubMed] [Google Scholar]
- 119.Lefranc MP, Giudicelli V, Kaas Q, Duprat E, Jabado-Michaloud J, Scaviner D, Ginestoux C, Clément O, Chaume D, Lefranc G. IMGT, the international ImMunoGeneTics information system®. Nucleic Acids Res. 2005;33:D593–D597. doi: 10.1093/nar/gki065. [DOI] [PMC free article] [PubMed] [Google Scholar]
- 120.Parla JS, Iossifov I, Grabill I, Spector MS, Kramer M, McCombie WR. A comparative analysis of exome capture. Genome Biol. 2011;12:R97. doi: 10.1186/gb-2011-12-9-r97. [DOI] [PMC free article] [PubMed] [Google Scholar]
- 121.Krauthammer M, Kong Y, Ha BH, Evans P, Bacchiocchi A, McCusker JP, Cheng E, Davis MJ, Goh G, Choi M, et al. Exome sequencing identifies recurrent somatic RAC1 mutations in melanoma. Nat. Genet. 2012;44:1006–1014. doi: 10.1038/ng.2359. [DOI] [PMC free article] [PubMed] [Google Scholar]
- 122.Langmead B, Trapnell C, Pop M, Salzberg SL. Ultrafast and memory-efficient alignment of short DNA sequences to the human genome. Genome Biol. 2009;10:R25. doi: 10.1186/gb-2009-10-3-r25. [DOI] [PMC free article] [PubMed] [Google Scholar]
- 123.Koboldt DC, Chen K, Wylie T, Larson DE, McLellan MD, Mardis ER, Weinstock GM, Wilson RK, Ding L. VarScan: variant detection in massively parallel sequencing of individual and pooled samples. Bioinformatics. 2009;25:2283–2285. doi: 10.1093/bioinformatics/btp373. [DOI] [PMC free article] [PubMed] [Google Scholar]
- 124.Giardine B, Riemer C, Hardison RC, Burhans R, Elnitski L, Shah P, Zhang Y, Blankenberg D, Albert I, Taylor J, et al. Galaxy: a platform for interactive large-scale genome analysis. Genome Res. 2005;15:1451–1455. doi: 10.1101/gr.4086505. [DOI] [PMC free article] [PubMed] [Google Scholar]
- 125.Borchardt CW. Über eine Interpolationsformel für eine Art Symmetrischer Functionen und über Deren Anwendung. Math. Abh. der Akademie der Wissenschaften zu Berlin. 1860:1–20. [Google Scholar]
- 126.Cayley A. A theorem on trees. Q. J. Math. 1889;23:376–378. [Google Scholar]
- 127.Pfeifer GP, You YH, Besaratinia A. Mutations induced by ultraviolet light. Mutat. Res. 2005;571:19–31. doi: 10.1016/j.mrfmmm.2004.06.057. [DOI] [PubMed] [Google Scholar]
- 128.Mardis ER, Ding L, Dooling DJ, Larson DE, McLellan MD, Chen K, Koboldt DC, Fulton RS, Delehaunty KD, McGrath SD, et al. Recurring mutations found by sequencing an acute myeloid leukemia genome. N. Engl. J. Med. 2009;361:1058–1066. doi: 10.1056/NEJMoa0903840. [DOI] [PMC free article] [PubMed] [Google Scholar]
- 129.Fraley C, Raftery AE. MCLUST: Software for model-based cluster analysis. J. Classif. 1999;16:297–306. [Google Scholar]
- 130.Fraley C, Raftery AE. Enhanced model-based clustering, density estimation, and discriminant analysis software: MCLUST. J. Classif. 1999;20:263–286. [Google Scholar]
- 131.Hicklin J, Moler C, Webb P, Boisvert R, Miller B, Pozo R, Remington K. JAMA: A Java matrix package. 2000 http://math.nist.gov/javanumerics/jama/ (10 July 2013, date last accessed) [Google Scholar]
- 132.Fisher D, O’Madadhain J, Smyth P, White S, Boey Y-B. Analysis and Visualization of Network Data using JUNG. J. Stat. Softw. 2005 http://www.ics.uci.edu/∼smyth/kddpapers/UCI_KD-D_JUNG_preprint.pdf (10 July 2013, date last accessed) [Google Scholar]
- 133.Thompson FH, Emerson J, Olson S, Weinstein R, Leavitt SA, Leong SP, Emerson S, Trent JM, Nelson MA, Salmon SE, et al. Cytogenetics of 158 patients with regional or disseminated melanoma Subset analysis of near-diploid and simple karyotypes. Cancer Genet. Cytogenet. 1995;83:93–104. doi: 10.1016/0165-4608(95)00057-v. [DOI] [PubMed] [Google Scholar]
- 134.Junker K, Schlichter A, Junker U, Knöfel B, Kosmehl H, Schubert J, Claussen U. Cytogenetic, histopathologic, and immunologic studies of multifocal renal cell carcinoma. Cancer. 1997;79:975–981. [PubMed] [Google Scholar]
- 135.Huber PJ. Robust Statistics. New York: Wiley; 1981. p. 181. [Google Scholar]
- 136.Bernet A, Fitamant J. Netrin-1 and its receptors in tumour growth promotion. Expert. Opin. Ther. Targets. 2008;12:995–1007. doi: 10.1517/14728222.12.8.995. [DOI] [PubMed] [Google Scholar]
Associated Data
This section collects any data citations, data availability statements, or supplementary materials included in this article.