

Abstract
Inactivation of the B1 proton pump subunit (ATP6V1B1) in intercalated cells (ICs) leads to type I distal renal tubular acidosis (dRTA), a disease associated with salt- and potassium-losing nephropathy. Here we show that mice deficient in ATP6V1B1 (Atp6v1b1–/– mice) displayed renal loss of NaCl, K+, and water, causing hypovolemia, hypokalemia, and polyuria. We demonstrated that NaCl loss originated from the cortical collecting duct, where activity of both the epithelial sodium channel (ENaC) and the pendrin/Na+-driven chloride/bicarbonate exchanger (pendrin/NDCBE) transport system was impaired. ENaC was appropriately increased in the medullary collecting duct, suggesting a localized inhibition in the cortex. We detected high urinary prostaglandin E2 (PGE2) and ATP levels in Atp6v1b1–/– mice. Inhibition of PGE2 synthesis in vivo restored ENaC protein levels specifically in the cortex. It also normalized protein levels of the large conductance calcium-activated potassium channel and the water channel aquaporin 2, and improved polyuria and hypokalemia in mutant mice. Furthermore, pharmacological inactivation of the proton pump in β-ICs induced release of PGE2 through activation of calcium-coupled purinergic receptors. In the present study, we identified ATP-triggered PGE2 paracrine signaling originating from β-ICs as a mechanism in the development of the hydroelectrolytic imbalance associated with dRTA. Our data indicate that in addition to principal cells, ICs are also critical in maintaining sodium balance and, hence, normal vascular volume and blood pressure.
Introduction
The distal parts of the nephron, i.e., the connecting tubule (CNT) and the collecting duct, play a critical role in renal acid excretion, and thus in acid-base homeostasis (1, 2). Acid secretion is achieved by α–intercalated cells (α-ICs), a highly specialized renal cell type expressing an apical vacuolar H+-ATPase (v-H+-ATPase) and a basolateral Cl–/HCO3– exchanger kAE1 (3, 4). Protons generated from the hydration of CO2 within these cells are extruded actively across the apical membrane by the pump, while bicarbonate ions, which are also produced by this process, are translocated across the basolateral membrane by AE1. Dysfunction of either the pump or the anion exchanger can block proton secretion (1, 2). This failure of α-ICs to decrease urine pH results in insufficient acid excretion and accumulation of acid in the body. This defect characterizes “classical” (or type I) distal renal tubular acidosis (dRTA). Accordingly, inactivating mutations of ATP6V1B1 (5) or ATP6V0A4 (6) genes, which encode the Β1 or the A4 subunits of the proton pump, respectively, or mutations of SLC4A1 (7, 8), the gene encoding for the Cl–/HCO3– exchanger kAE1, have been identified in patients with the inherited form of type I dRTA (4).
The characteristics of dRTA are not limited to abnormal acid-base balance, i.e., to acidemia of variable intensity, but often include a salt- and potassium-losing nephropathy that may lead to renal hypokalemia and dehydration (9, 10). dRTA is also almost invariably complicated by a marked hypercalciuria resulting in kidney stones, bone demineralization, nephrocalcinosis, and ultimately chronic renal failure. Since α-ICs are dedicated to acid secretion and are not thought to play a role in sodium absorption or in potassium secretion, the pathophysiology of the aforementioned sodium and potassium losses observed in patients suffering from dRTA is not well understood. These losses were initially believed to be consecutive to a direct effect of acidosis to depress several transporters along the nephron (11). However, Sebastian et al. demonstrated that sustained correction of acidemia in patients suffering from type I dRTA does not reverse the abnormalities in renal sodium or potassium handling (9, 10). Based on these observations, the authors concluded that impairments in renal sodium and potassium conservation may not be a reversible consequence of acidosis but instead may be consecutive to chronic interstitial nephropathy and nephrocalcinosis. However, the molecular defects that lead to inactivation of the proton pump, i.e., inactivating mutations of ATP6V1B1 or ATP6V0A4, which are frequent mutations observed in human patients, are not expected to affect only α-ICs. In fact, the proteins encoded by these genes are also expressed by the β (or base-secreting) subtype of ICs (β-ICs) that is also present in the distal nephron (12, 13). These cells share some of the characteristics with the α-ICs but with an opposite polarity, i.e., they express the v-H+-ATPase basolaterally and the Cl–/HCO3– exchanger pendrin (SLC26A4) at their apical membrane (14). Until recently, β-ICs were thought to be exclusively involved in base secretion. However, this paradigm has been challenged by recent observations showing that β-ICs exhibit electroneutral NaCl absorption (15, 16) and participate in the renal regulation of extracellular volume and blood pressure (17, 18). In β-ICs, apical Cl– influx, which occurs through the Cl–/HCO3– exchanger pendrin, is linked to apical Na+ influx by the Na+-driven Cl–/HCO3– exchanger NDCBE (15, 16). Thus, in theory, mutations that directly affect the proton pump are expected to impair both α-IC and β-IC functions, thereby affecting not only acid secretion but also NaCl absorption.
Finberg et al. generated a mouse model with disruption of the Atp6v1b1 gene encoding for the β1 subunit of the H+-ATPase as a model of human dRTA (19). As expected from human studies, mice with Atp6v1b1 disruption (Atp6v1b1–/–) exhibit an impaired response to acid loading (19). However, these mice slightly differ from patients, in that they do not have overt acidemia under standard laboratory conditions. They also do not exhibit hypercalciuria and develop neither nephrocalcinosis nor interstitial nephritis. Hence, these knockout mice represent an interesting model to study the mechanisms that account for impaired sodium and potassium conservation in patients with dRTA consecutive to dysfunction of the proton pump, and particularly, to assess the involvement of β-IC dysfunction in this model.
Therefore, our goal was to determine whether Atp6v1b1 disruption leads to a salt- and potassium-losing nephropathy as observed in human dRTA, and then to determine the mechanisms by which dysfunction of the proton pump affects the transport of Na+, Cl–, and K+. Here we report that impaired renal sodium and potassium conservation observed in type I dRTA is not the consequence of acidosis or of chronic interstitial nephritis, but is instead the consequence of the proton pump defect in β-ICs. We demonstrate that in mice with Atp6v1b1 disruption, β-ICs impair functions of neighboring principal cells (PCs), which normally transport sodium, water, and potassium, through the paracrine ATP/prostaglandin E2 (ATP/PGE2) signaling cascade. Furthermore, gain of ATP-triggered PGE2 signaling alters electrolytes and water balance in a paracrine manner. Beyond the inherited distal tubular acidosis, our findings also challenge the existing paradigm on the exclusive role of PCs and offer the new view that ICs and PCs are both critical in maintaining sodium balance and, thus, normal vascular volume.
Results
Atp6v1b1–/– mice have an impaired ability to conserve Na+, Cl–, K+, and water despite the absence of interstitial nephritis or nephrocalcinosis.
To test whether Atp6v1b1–/– mice have an impaired renal ability to conserve Na+ and Cl–, physiological blood and urine parameters were measured in Atp6v1b1–/– mice and their wild-type counterparts (Atp6v1b1+/+) that were pair-fed either a normal (0.3% Na+) or a Na+-free diet (all data are summarized in Supplemental Table 1; supplemental material available online with this article; doi: 10.1172/JCI63492DS1). As shown in Figure 1, urinary excretion of Na+ and Cl– was similar in both groups when the animals were fed a normal diet. During the first 24 hours of NaCl restriction, Atp6v1b1–/– mice excreted more Na+ (Figure 1A) and Cl– (Figure 1B) than pair-fed wild-type mice. However, within 3 days of NaCl restriction, all mice reached steady state, resulting in similar rates of Na+ and Cl– excretion in both genotypes. We also observed that Atp6v1b1–/– mice, even when fed a normal-salt diet, exhibited hallmarks of vascular dehydration, as evident from increased plasma renin activity (PRA) (Figure 1C) and plasma protein concentrations (45.7 ± 0.8 g/l in Atp6v1b1+/+ vs. 50.2 ± 1.2 g/l in Atp6v1b1–/–, n = 10 and 9, respectively; P = 0.005) (Supplemental Table 1). In addition, Atp6v1b1–/– mice exhibited lower systolic blood pressure (112.4 ± 2.8 mmHg in Atp6v1b1+/+ vs. 95.4 ± 2.5 mmHg in Atp6v1b1–/–, n = 10 and 6, respectively; P < 0.001). The development of marked secondary hyperaldosteronism in Atp6v1b1–/– mice subjected to NaCl restriction (Figure 1D) further suggests the presence of vascular dehydration in these animals. Taken together, these observations indicate that Atp6v1b1–/– mice have vascular dehydration and an impaired renal ability to conserve both Na+ and Cl–, and hence, that they have salt-losing nephropathy.
Figure 1. Effects of dietary NaCl restriction and renal K+ and water handling in Atp6v1b1–/– mice.

(A) Time course of renal excretion of Na+ in Atp6v1b1–/– and Atp6v1b1+/+ mice fed a normal-salt diet and then switched to a NaCl-restricted diet. (B) Time course of renal Cl– excretion. (C) Plasma renin concentration was measured on a normal-salt diet and after 6 days of NaCl restriction. (D) Time course of urinary excretion of aldosterone. (E) Plasma [K+] was measured in Atp6v1b1–/– and Atp6v1b1+/+ mice fed a normal-salt diet or after 6 days of NaCl restriction. (F) Time course of renal K+ excretion when animals used for measurements of plasma [K+] shown in E were switched from normal to NaCl-restricted diet. (G) Time course of urine output. (H) Time course of urine osmolality. Data are presented as means ± SEM; n = 8 for Atp6v1b1+/+ and n = 7 for Atp6v1b1–/–. Statistical significance was assessed using an unpaired Student’s t test. *P < 0.05, **P < 0.01, and ***P < 0.001 vs. Atp6v1b1+/+.
Under basal conditions Atp6v1b1–/– mice exhibited a lower plasma K+ concentration (Figure 1E) than control mice but an inappropriately normal urinary excretion of K+ (Figure 1F). Moreover, when animals were subjected to NaCl restriction (i.e., under conditions of maximal stimulation of aldosterone), urinary excretion of K+ in mutant animals was exacerbated and became higher (i.e., inappropriate for hypokalemia) than in controls (Figure 1F), demonstrating a renal defect in K+ conservation.
In addition, we noticed that Atp6v1b1–/– mice exhibited polyuria that was also dramatically magnified by salt restriction (Figure 1G). Figure 1H shows that urine produced by Atp6v1b1–/– mice had a lower osmolality (1,160 ± 124 mOsmol/kg; n = 7) than that of wild-type mice (2,151 ± 31 mOsmol/kg; n = 8) under a normal-Na+ diet. A Na+-depleted diet had no significant effect on urine osmolalities (2,437 ± 236 mOsmol/kg in wild-type mice vs. 971 ± 211 mOsmol/kg in knockout mice; n = 8 and 6, respectively).
These experiments demonstrate that Atp6v1b1 disruption leads to a complex tubulopathy, which recapitulates major features observed in some patients suffering from classic type I dRTA and which have been attributed to chronic interstitial nephritis. However, careful examination by light microscopy of kidney sections from Atp6v1b1–/– mice demonstrated the absence of interstitial nephritis, and no evidence of microscopic nephrocalcinosis was found in sections examined after Von Kossa staining (Supplemental Figure 1).
Atp6v1b1 gene deletion inhibits epithelial Na channel in the cortical collecting duct but not in the medullary collecting duct.
Atp6v1b1 disruption leads to markedly reduced proton pump activity in α-ICs (19, 20) and possibly also in β-ICs. Pharmacologic blockade of the pump has been shown to inhibit pendrin-dependent Cl– absorption by cortical collecting duct (CCDs) (21). Therefore, we hypothesized that Atp6v1b1 disruption should reduce the electroneutral NaCl transport system via β-ICs that we recently described and that requires normal pendrin activity (16). To test this hypothesis, Na+ and Cl– transepithelial fluxes (JNa and JCl, respectively) were measured in CCDs isolated from Atp6v1b1–/– mice fed either a normal or low-salt diet. In a previous study we showed that CCDs isolated from wild-type mice fed a normal-salt diet do not exhibit any detectable transport activity, whereas CCDs isolated from mice fed a salt-depleted diet absorb NaCl through the epithelial Na+ channel (ENaC) in PCs and the pendrin/Ndcbe transport system in ICs (16). As Atp6v1b1–/– mice fed a normal-salt diet exhibited higher PRA (similar to that of wild-type mice maintained on salt-depleted diet for 6 days), one would have expected their CCDs to absorb NaCl similarly as CCDs from wild-type mice maintained on a salt-depleted diet. However, CCDs isolated from Atp6v1b1–/– mice were not able to absorb Na+ or Cl– (JNa = –4.23 ± 4.43 and JCl = –4.05 ± 6.92 pmol/min/mm; n = 5). This was also the case for CCDs isolated from Atp6v1b1–/– mice fed a salt-depleted diet (Figure 2A), in which JNa and JCl were approximately 10-fold less than in Atp6v1b1+/+ mice fed a salt-depleted diet. These results suggest that in addition to impairing electroneutral Na+ absorption through ICs, Atp6v1b1 disruption also inhibits Na+ absorption mediated by ENaC through the neighboring PCs. Since ENaC is expressed exclusively in PCs, Atp6v1b1 disruption was not expected to directly affect electrogenic Na+ absorption by CCD.
Figure 2. Differential effects of Atp6v1b1 disruption on the cortical and MCD.

(A) Effects of Atp6v1b1 disruption on NaCl transport in the CCD. JNa and JCl were measured in CCDs isolated from Atp6v1b1+/+ mice and Atp6v1b1–/– mice fed a salt-depleted diet for 2 weeks. n = 5–7 tubules from different mice in each group. *P < 0.05. ***P < 0.001, 2-tailed unpaired Student’s t test. (B) Effects of Atp6v1b1 disruption on ENaC and pendrin expression in the CCD. α-ENaC, γ-ENaC, and pendrin protein abundance were assessed with Western blot of protein extracted from the renal cortex of Atp6v1b1–/– and Atp6v1b1+/+ mice. (C) Effects of Atp6v1b1 disruption on ENaC expression in the MCD. α-ENaC and γ-ENaC protein abundance was assessed with Western blot of protein extracted from the renal medulla of Atp6v1b1–/– and Atp6v1b1+/+ mice. (B and C) Lanes were loaded with a protein sample from different mice, with 15 μg (B) and 5 μg (C) proteins per lane; equal loading confirmed by parallel Coomassie-stained gels. The α-ENaC antibody recognized 2 bands at 90 and 100 kDa. Bands at 90 kDa (arrows) were not detected in kidneys from α-ENaC knockout mice, and were quantified. The γ-ENaC antibody recognized a doublet band at 85–80 kDa and a large band centered around 70 kDa (brackets). Bar graphs summarize densitometric analyses of doublet 85-kDa and broad 70-kDa bands. *P < 0.05, **P < 0.01, ***P < 0.001 vs. Atp6v1b1+/+, unpaired Student’s t test. (D) Effect of amiloride on urinary Na+ excretion in Atp6v1b1+/+ and Atp6v1b1–/– mice. Urines were collected before and 6 hours after amiloride injection (1.45 mg/kg BW) into Atp6v1b1+/+ and Atp6v1b1–/– mice. *P < 0.05 vs. Atp6v1b1+/+ after amiloride injection; **P < 0.01, ***P < 0.001 vs. basal state; 1-way ANOVA.
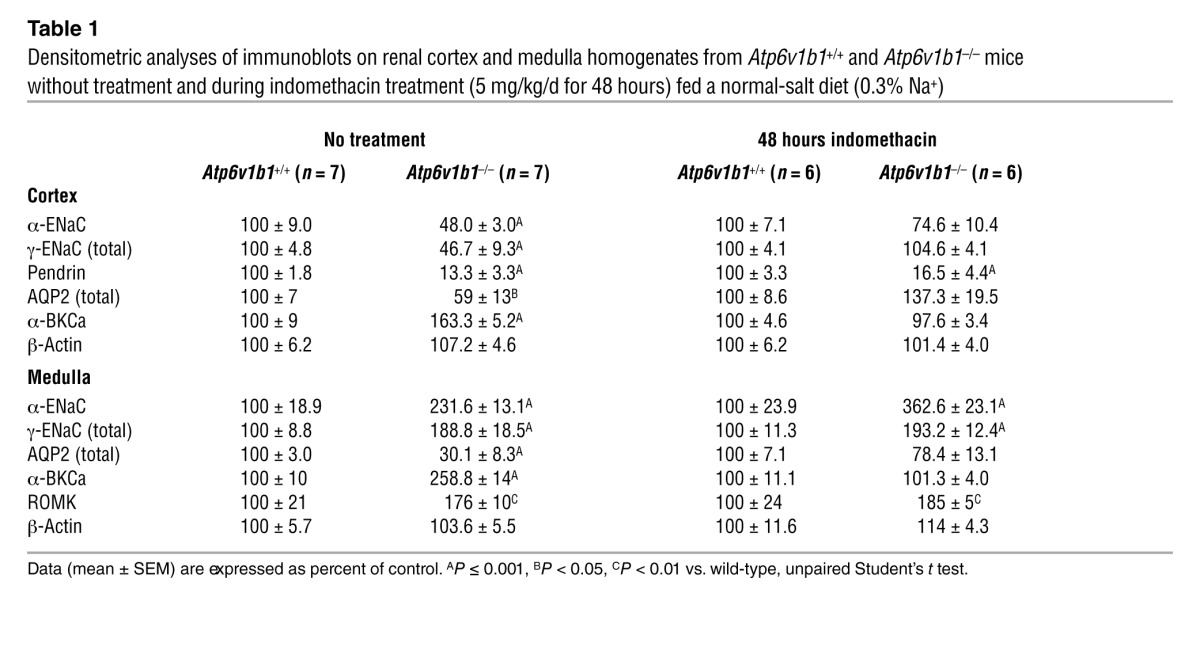
To dissect the mechanisms by which Atp6v1b1 disruption impairs NaCl reabsorption in the CCD, we next performed semiquantitative immunoblotting to measure pendrin and ENaC protein abundance in the renal cortex of Atp6v1b1–/– mice under basal conditions. Figure 2B shows that abundances of both α-ENaC and γ-ENaC were approximately 50% lower in knockout mice than in wild-type mice. Pendrin protein level was reduced by 80% when compared with controls (Figure 2B). Data are summarized in Table 1. Taken together, our results demonstrate that Atp6v1b1 disruption inhibits electroneutral NaCl absorption by reducing pendrin expression in β-ICs, but also impairs PC function by decreasing ENaC expression and function. Of interest, mice with gene disruption of pendrin have been shown to exhibit similar alterations in ENaC abundance as Atp6v1b1–/– mice (22). We next studied the effects of Atp6v1b1 disruption in the medullary collecting duct (MCD), a nephron segment that contains exclusively PCs and α-ICs but does not have β-ICs. Figure 2C and Table 1 show that in the renal medulla, in contrast to our observations in the renal cortex, abundance of both α and γ subunits of ENaC were dramatically increased in knockout mice, as expected from mice with secondary hyperaldosteronism. Unfortunately, we could not measure Na+ fluxes in MCDs, as this segment is not easily accessible for in vitro microperfusion. Alternatively, we estimated total ENaC activity in Atp6v1b1–/– mice by assessing the effects of an acute injection of amiloride (1.45 mg/kg of BW) on urinary excretion of Na+. Amiloride injection significantly increased urine Na+ excretion in both genotypes and was only slightly less effective in Atp6v1b1–/– mice than in controls (Figure 2D), indicating that ENaC-dependent Na+ absorption in the distal nephron is slightly lower in Atp6v1b1–/– mice. These results suggest that decreased ENaC activity in the CNT/CCD is almost fully compensated by increased ENaC activity in the MCD. In summary, our results show that β-IC dysfunction consecutive with Atp6v1b1 disruption inhibits NaCl absorption and impairs the sensitivity of PCs to renin-angiotensin-aldosterone system activation in the CCD, while PCs in the MCD have a normal response to hyperaldosteronism. Our results strongly suggest that a factor originating from the β-ICs locally reduces ENaC activity in the cortex.
Table 1.
Densitometric analyses of immunoblots on renal cortex and medulla homogenates from Atp6v1b1+/+ and Atp6v1b1–/– mice without treatment and during indomethacin treatment (5 mg/kg/d for 48 hours) fed a normal-salt diet (0.3% Na+)
Atp6v1b1–/– mice have increased expression of the large-conductance calcium-activated potassium channel in collecting ducts.
In the CNT and the collecting duct, K+ secretion occurs through 2 types of apical K+ channels: the renal outer medullary K+ (ROMK) channel and the large-conductance calcium-activated K+ channel (BKCa).
Movement of K+ across the apical membrane through selective apical K+ channels required a favorable electrical driving force, which is provided by electrogenic reabsorption of Na+ through ENaC. Since ENaC was found upregulated in the MCD (Figure 2C), we tested whether K+ leak could occur through ROMK in the MCD of Atp6v1b1–/– mice. We next analyzed the abundance of ROMK protein in the medulla. As detailed in Supplemental Figure 2A, in the medulla, anti-ROMK antibody detected a triplet around 37 kDa in which the upper band was shown to correspond to the molecular form of ROMK expressed exclusively in the collecting duct. We found that ROMK protein abundance was markedly increased in MCD from Atp6v1b1–/– mice (Table 1 and Supplemental Figure 2B). The BKCa mediates the flow-induced K+ secretion in the collecting duct (23). Elevated urinary flow in Atp6v1b1–/– mice may activate BKCa channels and K+ secretion. When assessed with immunoblotting, the protein level of the α subunit of the BKCa channel was increased by 1.6- and 2.6-fold in cortical and medullary samples from Atp6v1b1–/– mice, respectively (Figure 3A and Table 1). These results show increases in K+ channel expression in Atp6v1b1–/– mice, which parallel upregulation of ENaC in the MCD.
Figure 3. BKCa and AQP2 protein expression assessed in Atp6v1b1–/– and Atp6v1b1+/+ mice.

(A) Western blot for α-BKCa on renal cortex (left) or renal medulla (right). Each lane was loaded with a protein sample from a different mouse; 15 μg and 5 μg proteins were loaded per gel lane for cortical samples and medullary samples, respectively. (B) Western blot for AQP2 on renal medulla. Bracket and asterisk show the glycosylated 37-kDa and the unglycosylated 25-kDa forms of AQP2, respectively. Each lane was loaded with a protein sample from a different mouse; 5 μg proteins were loaded per gel lane. Equal loading was confirmed by parallel Coomassie-stained gels. Bar graphs summarize densitometric analyses. For AQP2, bar graphs summarize bracketed and asterisked bands. ***P < 0.01 vs. Atp6v1b1+/+, unpaired Student’s t test. (C) Immunohistochemistry of kidney sections showing AQP2 staining in renal medulla from Atp6v1b1+/+ and Atp6v1b1–/– mice. Scale bars: 250 μm.
Expression of aquaporin 2 was dramatically decreased in collecting ducts of Atp6v1b1–/– mice.
Accumulation of aquaporin 2 (AQP2) in the apical plasma membrane increases water permeability of the collecting duct, allowing water to be reabsorbed from the collecting duct lumen and increasing the concentration of the urine. Immunoblotting studies showed that renal medulla AQP2 protein level was dramatically reduced (by 70%) in Atp6v1b1–/– mice as compared with control mice (Figure 3B and Table 1). In the cortex, AQP2 protein level in Atp6v1b1–/– mice was decreased by 40% (Supplemental Figure 3A and Table 1). These results were confirmed by immunofluorescence on kidney sections (Figure 3C and Supplemental Figure 3B). These results suggest that water loss in Atp6v1b1–/– mice is likely a consequence of downregulation of AQP2.
Abnormal prostaglandin E2 release impairs ENaC regulation in CCDs.
Increased urine PGE2 excretion is often associated with salt- and water-losing nephropathies (24). The collecting duct is a major site of PGE2 synthesis in the kidney, where PGE2 inhibits both salt and water absorption (25, 26). We next measured PGE2 excretion in the urine of Atp6v1b1–/– mice and their controls. Urinary PGE2 was increased 2-fold in Atp6v1b1–/– mice (Figure 4A). To test whether PC dysfunction in our model could arise from an abnormal PGE2 release, we treated Atp6v1b1–/– mice with indomethacin, an unselective inhibitor of cyclooxygenases, the enzyme responsible for prostaglandin generation. Urinary PGE2 excretion of Atp6v1b1–/– mice was significantly decreased 24 hours after the first injection of indomethacin (5 mg/kg BW/d) and a maximal 60% decrease was observed after 2 days. At day 2, indomethacin improved the polyuria and normalized urine osmolality (Table 2), and abolished the difference in plasma potassium concentration (without indomethacin treatment: 4.10 ± 0.07 mM in Atp6v1b1+/+ mice vs. 3.54 ± 0.08 mM in Atp6v1b1–/– mice, n = 25 and 24, respectively; P < 0.0001; following indomethacin treatment: 4.11 ± 0.07 mM in Atp6v1b1+/+ mice vs. 3.90 ± 0.09 mM in Atp6v1b1–/– mice, n = 24 and 27, respectively; NS). Urinary Na+ and K+ excretions also decreased in response to indomethacin treatment in mutant mice (Table 2). Indomethacin reduced differences in PRA between wild-type and mutant mice (without indomethacin, PRA in Atp6v1b1–/– mice was 6-fold that of Atp6v1b1+/+ mice; with indomethacin, PRA was 2.3-fold that of Atp6v1b1+/+ mice; P = 0.047) and abolished the difference in hematocrit (without indomethacin treatment: 41% ± 1% in Atp6v1b1+/+ mice vs. 44% ± 1% in Atp6v1b1–/– mice, n = 38 and 40, respectively; P < 0.01; following indomethacin treatment: 40% ± 1% in Atp6v1b1+/+ mice vs. 39 ± 2% in Atp6v1b1–/– mice, n = 16 and 17, respectively; NS). Indomethacin treatment had no significant effect in wild-type mice. Western blot analyses shown in Figure 5, A and C, indicate that protein abundance for α- and γ-ENaC in cortical homogenates was no longer downregulated, and was even slightly higher for γ-ENaC in treated Atp6v1b1–/– mice when compared with control mice. In contrast, pendrin expression remained low (Table 1) in treated Atp6v1b1–/– mice. Expression of α- and γ-ENaC in the MCD was still increased in treated Atp6v1b1–/– mice (Figure 5, B and D) when compared with control mice as well as the expression of ROMK (Table 1). These results demonstrate that abnormal ENaC regulation in the CCD is due to a disturbance in PGE2 paracrine signaling, whereas the reduction of pendrin is a direct consequence of proton pump dysfunction. Expression of AQP2 was also normalized by indomethacin treatment in both cortical and medullary samples (Figure 5, E and F, and Table 1). After indomethacin treatment, the expression of the α subunit of the BKCa channel was not different from that of control mice in both cortical and medullary samples (Figure 5, G and H, and Table 1). All densitometric analyses of immunoblots are summarized in Table 1. Taken together, these results indicate that renal K+ loss in Atp6v1b1–/– mice is likely a consequence of activation of flow-activated BKCa potassium channels.
Figure 4. Effects of Atp6v1b1 disruption on urine excretion of PGE2 and ATP.

(A and B) Urinary excretion of PGE2 (A) and ATP (B) in Atp6v1b1–/– and Atp6v1b1+/+ mice. Data are means ± SEM. For PGE2, n = 26–27 mice in each group. For ATP, n = 15 mice in each group. **P < 0.01 vs. Atp6v1b1+/+; ***P < 0.001 vs. Atp6v1b1+/+, unpaired Student’s t test with Welch’s correction.
Table 2.
Physiologic parameters from Atp6v1b1–/– mice before and during indomethacin treatment
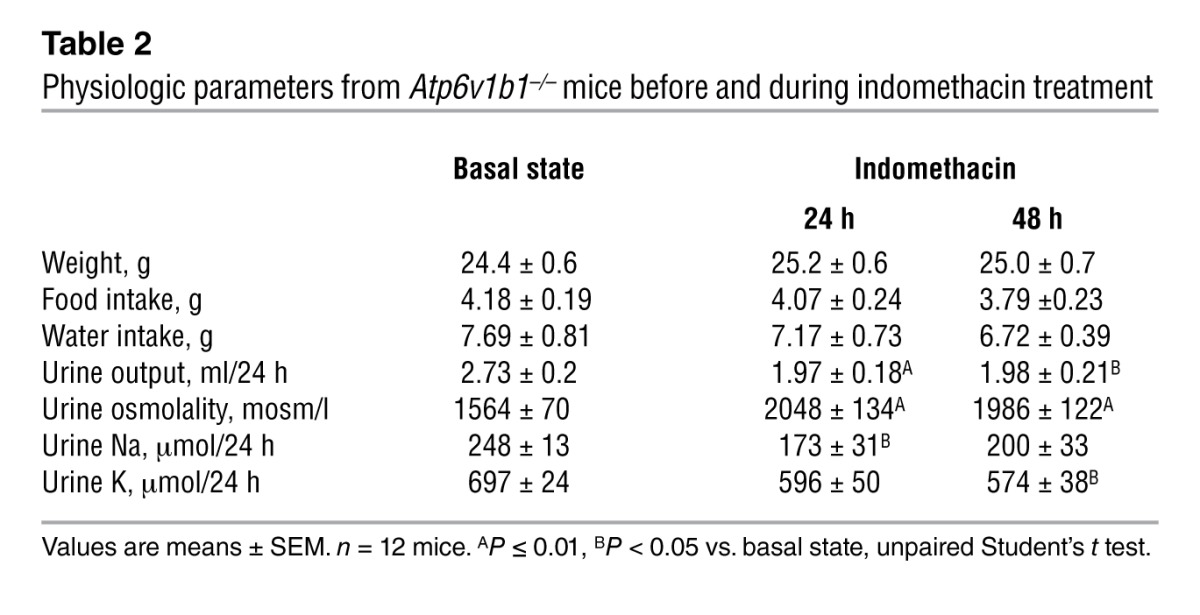
Figure 5. Effects of 2 days of indomethacin injection on the protein abundance of ENaC, AQP2, and BKCa in Atp6v1b1–/– and Atp6v1b1+/+ mice.

(A–H) Protein abundance of α-ENaC subunit (A and B), γ-ENaC subunit (C and D), AQP2 (E and F), and α-BKCa (G and H) was assessed with Western blot analysis of protein extracted from renal cortex (A, C, E, and G) or medulla (B, D, F, and H) of Atp6v1b1–/– and Atp6v1b1+/+ mice after 2 days of indomethacin injections. Each lane was loaded with a protein sample from a different mouse; 15 μg and 5 μg proteins were loaded per gel lane for cortical samples and medullary samples, respectively. Equal loading was confirmed with parallel Coomassie-stained gels. Bar graphs summarize densitometric analyses. ***P < 0.001 vs. Atp6v1b1+/+. In A and B, arrow indicates the 90-kDa–specific band for α-ENaC. In E and F, bar graphs summarize bands indicated by brackets (glycosylated 37-kDa form of AQP2) and asterisks (unglycosylated 25-kDa form of AQP2).
Inactivation of the basolateral H+-ATPase induced ATP-dependent PGE2 release by the CCD.
The preceding experiments suggest that PGE2 reduced ENaC activity in CCD PCs. To get a better insight into the mechanism by which PGE2 regulates ENaC function in CCD PCs, we measured PGE2 release into the tubular fluid in freshly isolated microperfused wild-type CCDs in response to pharmacologic inhibition of basolateral H+-ATPases in β-ICs using the previously established PGE2 biosensor technique (27, 28). We used HEK cells overexpressing the calcium-coupled PGE2 receptor E-prostanoid 1 (EP1) as PGE2 biosensors by loading them with Fluo-4/Fura Red to measure cytosolic calcium and positioning them in direct contact with the tubular fluid (Figure 6A). As shown in Figure 6B, addition of bafilomycin A1 to the bathing solution inhibiting basolateral H+-ATPases in β-ICs caused significant elevation in HEK-EP1 biosensor cell calcium, indicating luminal PGE2 release. The selective EP1 receptor inhibitor SC51322 added to the luminal perfusate blocked bafilomycin-induced biosensor responses, indicating PGE2 specificity (Figure 6B).
Figure 6. Paracrine signaling in the isolated microperfused CCD.

(A and B) Measurement of bafilomycin A1–induced luminal PGE2 release in the isolated microperfused CCD using a biosensor technique. (A) HEK cells overexpressing the EP1 receptor were loaded with Fluo-4 and Fura Red, held by a holding pipette (HP1), and positioned in the lumen of the split-open microperfused CNT/CCD, in contact with the tubular fluid. PP, CCD perfusion pipette; HP2, holding pipette to keep the tubule end in position. DIC image and fluorescence overlay are shown. (B) Summary of PGE2 biosensor responses. Fold change in Fluo-4/Fura Red fluorescence ratio is shown as index of PGE2 release. Addition of 40 nM bafilomycin (baf) to the bathing solution caused elevation in HEK-EP1 biosensor cell calcium indicating luminal PGE2 release. The effects of bafilomycin were prevented by the addition of the purinergic (ATP) receptor blocker suramin (50 μM) to the tubular perfusate. Similarly, the selective PGE2 EP1 receptor inhibitor SC51322 (SC; 10 μM) added to the luminal perfusate blocked bafilomycin-induced biosensor responses indicating PGE2 specificity. Addition of the ATP scavenger apyrase (50 U/ml) to the tubular perfusate also abolished PGE2 biosensor responses consistent with its dependence on luminal ATP release. *P < 0.05 bafilomycin vs. baseline (ctrl). Numbers per group are indicated in parentheses. (C and D) Fluorescence imaging of bafilomycin-induced purinergic calcium signaling in the isolated microperfused CCD. CCDs were perfusion-loaded with Fluo-4 and Fura Red. (C) Gradient pseudocolor images show CCD [Ca2+]i levels before (left) and after (right) addition of 40 nM bafilomycin to bathing solution. Bafilomycin caused significant elevations in CCD [Ca2+]i, most significantly in ICs, which were identified based on anatomical considerations (lower cell density and higher cell volume compared with PCs). (D) Summary of bafilomycin-induced changes in CCD [Ca2+]i. The purinergic (ATP) receptor blocker suramin added to the tubular perfusate (50 μM) abolished the effects of bafilomycin. *P < 0.05 bafilomycin vs. bafilomycin and suramin; n = 5/group.
Luminal ATP via activation of P2Y2 receptors is known to mediate inhibition of Na+ absorption via ENaC in mouse CCD (29, 30). Recent studies have shown that local ATP can act either directly or via a signaling cascade that involves generation of active prostanoids, particularly PGE2 (31–33), exerting natriuretic effects on the CCD. We thus tested the effect of the addition of the purinergic (ATP) receptor blocker suramin to the tubular perfusate and showed that bafilomycin-induced PGE2 release was prevented by suramin (Figure 6B). Similarly, addition of the ATP scavenger apyrase (50 U/ml) to the tubular perfusate abolished PGE2 biosensor responses consistent with its dependence on luminal ATP release (Figure 6B). Of note, as PGE2, urinary ATP excretion was increased by 3.1-fold in Atp6v1b1–/– mice (Figure 4). Daily injection of indomethacin to Atp6v1b1–/– mice for 2 days, which normalized ENaC expression in the cortex (Figure 5, A and C), had no significant effect on urinary ATP excretion (0.36 ± 0.12 pmol/min before vs. 0.54 ± 0.20 pmol/min after indomethacin injection, n = 7) while decreasing PGE2 excretion by 60%. These results suggest that ATP had no direct effect on ENaC expression but rather acted through PGE2 generation in our model.
When CCDs were loaded with the calcium-sensitive ratiometric fluorophore pair Fluo-4 and Fura Red, the addition of bafilomycin to the bathing solution caused significant elevations in CCD [Ca2+]i, most significantly in ICs (Figure 6C). Suramin added to the tubular perfusate completely abolished the effects of bafilomycin (Figure 6D). These experiments evidence a significant intracellular calcium elevation in ICs, which reflects activation of luminal purinergic receptors in response to inactivation of the basolateral H+-ATPase.
Overall, inhibition of basolateral H+-ATPase in β-ICs leads to ATP release, which then triggers PGE2 release by acting on luminal calcium-coupled purinergic P2 receptors, presumably P2Y2 receptors, the main luminal P2 receptor subtype expressed in the distal nephron.
Discussion
Type I dRTA is associated with a salt- and potassium-losing nephropathy that can lead to renal hypokalemia and dehydration (9, 10). dRTA is also almost invariably complicated by a marked hypercalciuria resulting in kidney stones, bone demineralization, nephrocalcinosis, and ultimately chronic renal failure. Mice with disruption of the Atp6v1b1 gene encoding the B1 subunit of the H+-ATPase develop an abnormal response to an acid load (19), which is the direct consequence of impaired proton secretion as expected from dysfunction of α-ICs. Our current results demonstrate that Atp6v1b1–/– mice, like patients with severe type I dRTA, have a salt-losing nephropathy that leads to severe vascular dehydration when the animals are fed a NaCl-depleted diet. However, in the absence of nephrocalcinosis, this cannot be attributed solely to chronic interstitial nephritis but instead reflects abnormal NaCl handling by renal epithelial cells. In a previous study (16), we showed that CCDs isolated from mice with secondary hyperaldosteronism absorb Na+ through ENaC in PCs and through the Na+-driven Cl–/HCO3– exchanger NDCBE in ICs. Cl– absorption has been shown to occur in β-ICs through the Na+-independent Cl–/HCO3– exchanger pendrin (18, 34). Here, we demonstrate that, despite marked hypovolemia, CCDs isolated from Atp6v1b1–/– mice did not absorb NaCl, indicating that ENaC and NDCBE/pendrin activities are both impaired. Accordingly, expressions of pendrin, α-ENaC, and γ-ENaC were decreased in the cortex of Atp6v1b1–/– mice. Reduction in protein expression as assessed by immunoblotting of renal cortex likely reflects changes in ENaC and pendrin expression in the CNTs as well. In contrast, in the renal medulla, protein abundances of both α- and γ-ENaC were dramatically increased as expected in hypovolemic animals. In vivo injection of amiloride further shows that global ENaC activity was only slightly altered in these mice, indicating that increased ENaC activity in the MCD almost fully compensated for decreased ENaC activity in the CNT/CCD of Atp6v1b1–/– mice. We conclude that β-IC dysfunction consecutive to Atp6v1b1 disruption impairs the sensitivity of PCs to renin-angiotensin-aldosterone system activation in the CCD, while PCs in the MCD have a normal response to hyperaldosteronism.
Unlike human dRTA patients, Atp6v1b1–/– mice do not develop spontaneous acidosis. It has been shown that the B2 subunit, which is normally co-expressed with the B1 subunit in ICs, compensates for the lack of the B1 subunit of the H+-ATPase in α-ICs and that its activity is sufficient to maintain acid base homeostasis in Atp6v1b1–/– mice under basal conditions but not in conditions of acid load (20, 35) or stimulation of angiotensin II (36). Our data showing no electroneutral NaCl transport in the CCD of Atp6v1b1–/– mice suggested that the B2 isoform is not capable of compensating for the absence of B1 in β-ICs under all circumstances (normal- and low-salt diet), conditions that may require angiotensin II mediated regulation of H+-ATPases.
Our results provide an explanation for hypokalemia in patients suffering from type I dRTA. K+ is freely filtered at the glomerulus and is almost totally reabsorbed by the proximal tubule and the loop of Henle. The amount of K+ excreted by the kidney is then determined by mechanisms beyond the early distal tubule, where either reabsorption or secretion of K+ can occur. The 2 main mechanisms identified yet that account for K+ secretion in the distal nephron are the small conductance K+ channel ROMK and the BKCa (37). Apical ROMK channels are expressed in PCs and K+ secretion through ROMK channels depends on electrogenic Na+ transport. BK channels have been primarily detected in apical membrane of ICs (38, 39), where basolateral Na-K-2Cl cotransporters (40, 41) may provide a mechanism for K+ uptake, thereby allowing K+ secretion through these cells. It is unlikely that K+ secretion occurs through excessive activity of ROMK in CCD of Atp6v1b1–/– mice, since ENaC activity in this tubule segment is blocked, as indicated by our microperfusion data (see Figure 2A). Upregulation of ENaC in the OMCD of Atp6v1b1–/– mice is expected to drive excessive K+ secretion through ROMK. High luminal flow rates are known to enhance K+ secretion due to activation of BKCa channels (23). Thus, elevated urinary flow in mutant mice probably activates BKCa potassium channels and K+ secretion. In line with this hypothesis, we found that BKCa expression was increased in mutant mice and that a reduction of urinary flow in Atp6v1b1–/– mice by indomethacin normalized expression level of BKCa and decreased urinary K+ excretion in Atp6v1b1–/– mice. This data also indicates that PGE2, which antagonizes the actions of vasopressin in the distal nephron (26), is responsible for the dramatic decreased expression of the AQP2 water channel seen in Atp6v1b1–/– mice and hence their urinary concentration defect.
Our findings showing differential regulation of ENaC in the CNT/CCD system and MCD suggest that ENaC expression and activity in the CNT and the CCD are modulated by β-ICs. This is in line with recent studies showing that pendrin-null mice have an impaired ability to conserve Na+ during dietary NaCl restriction and reduced ENaC expression (22). It has been shown that pendrin can increase ENaC abundance and function in part by increasing luminal HCO3 concentration and/or pH (42). However, it is unlikely that this mechanism can fully explain reduced cortical ENaC activity and expression observed in Atp6v1b1–/– mice. In fact, Atp6v1b1–/– mice exhibited much higher urinary pH than control mice (6.6 ± 0.03 vs. 5.8 ± 0.02, n = 7 and 8, respectively; P < 0.0001). Moreover, indomethacin, which decreased urinary PGE2 excretion in Atp6v1b1–/– mice, normalized ENaC expression specifically in the renal cortex. Indomethacin also tended to decrease urinary Na+ excretion in these mice and reduced differences in PRA and hematocrit between wild-type and mutant mice. Furthermore, we demonstrate that inactivation of the H+-ATPase induces PGE2 release by isolated microperfused CCD. Considering these data, and because PGE2 has been repeatedly shown to decrease electrogenic Na+ transport in isolated and microperfused CCDs (25, 26, 43), we propose that PGE2 production has a primary role in downregulating ENaC expression and function in the CCD of Atp6v1b1 deficient mice. This autocrine/paracrine function of PGE2 in regulating Na+ transport in the CCD has been recently evidenced in isolated and microperfused tubules by Flores et al. (44). The authors showed that indomethacin enhanced flow-stimulated Na+ absorption in microperfused CCDs and concluded that flow-activated PGE2 release inhibits Na+ absorption. Opposing regulations of ENaC in the CCD and the MCD highlight the importance of this paracrine PGE2 signaling in antagonizing the action of the renin-angiotensin-aldosterone system on ENaC in the CCD.
The present studies demonstrate that PGE2 release by isolated microperfused CCDs in response to the preferential inactivation of the basolateral H+-ATPase requires activation of luminal G protein-coupled purinergic (ATP) receptor. Such ATP-induced PGE2 release has been observed in other cell types including astrocytes (33), vascular smooth vessel cells (31), and inner MCD cells (32).
In the mouse kidney, ATP-permeable hemichannel connexin 30 (Cx30), which has been localized solely to the apical membrane of β-ICs of the distal nephron (45), is involved in ATP release from the collecting duct cells (15, 28). More recently, pannexin 1 channels (Panx1), expressed at the apical membrane of ICs, has also been proposed to regulate ATP release as Panx1-deficient mice excrete less ATP than their wild-type littermates (15, 46). Thus, ATP released via Cx30 and/or Panx1 is theoretically available for autocrine and paracrine signaling to ICs and PCs, respectively. The calcium-coupled P2Y2 receptor is the main luminal P2 receptor subtype expressed in the distal nephron and was located in PCs using confocal microscopy imaging (47). With calcium imaging experiments on isolated CCDs, we also evidence a strong intracellular calcium elevation in ICs in response to the preferential inactivation of the basolateral H+-ATPase, which was abolished in the presence of luminal suramin. These data strongly suggest that ICs themselves respond to purinergic signaling.
In the collecting duct, luminal ATP via activation of P2Y2 receptors inhibits Na+ ENaC-dependent Na+ transport (29, 30). Activation of purinergic P2 receptors also decreases AVP-induced water permeability and downregulates AQP2 (48, 49). Our experiments showing that indomethacin treatment restores normal protein levels of ENaC and AQP2 in the renal cortex of Atp6v1b1–/– mice but has no effect on urinary ATP excretion suggest that ATP acts through PGE2 generation in CCDs of Atp6v1b1–/– mice. However, we cannot rule out the possibility of a direct effect of ATP on ENaC activity through a reduction in channel open probability.
The effects of PGE2 are mediated by a distinct class of G protein–coupled receptors referred to as EP receptors. Among the 3 EP receptor subtypes that have been localized in the CCD (e.g., EP1, EP3, and EP4), activation of EP1 receptors by basolateral PGE2 increases intracellular calcium levels and inhibits Na+ absorption in the in vitro microperfused CCD (25). Basolateral PGE2 through Gi protein–coupled EP3 receptors inhibits vasopressin-stimulated water permeability of this epithelium (26). PGE2 produced by the cortical collecting cells and released across the basolateral membrane of these cells may enter the bloodstream by diffusing into the peritubular capillaries and could potentially circulate and activate their remote EP3 receptors in the medulla. Alternatively, activation of the renin-angiotensin-alsosterone system has been suggested to induce PGE2 synthesis in the renal medulla (50). In addition to this well-known basolateral effect of PGE2, there is evidence for luminal prostaglandin receptors in the CCD, activation of which suppresses ENaC-mediated Na+ transport (43). As indicated by our biosensor experiments, which measured luminal PGE2, PGE2 release also occurs through luminal cell membranes of the CCD. Luminal PGE2 has been reported to increase cAMP production in culture CCD cells (51, 52), suggesting that the effects of luminal PGE2 are mediated by Gs protein coupled EP receptors. EP2 and EP4 are coupled to the Gs protein and signal by increasing intracellular cAMP levels, but only the EP4 receptor has been localized in the CCD (53). Thus, PGE2 release through luminal and basolateral cell membranes of the CCD may inhibit Na+ transport through activation of EP1 and EP4 receptors and water transport through EP3 receptor activation.
The importance of the intratubular paracrine factor ATP as a regulator of electrolytes and water balance in the distal nephron is emerging (15). In contrast to aldosterone, which is a powerful stimulatory factor of Na+ absorption through PCs, ATP as PGE2 exerts an inhibitory effect on Na+ absorption. The importance of these paracrine factors in blood pressure regulation is highlighted by previous studies showing that disruption of the purinergic P2Y2 receptor or the microsomal PGE synthase 1, a key enzyme in PGE2 synthesis, leads to salt-sensitive hypertension in mice (54, 55). In the present study, we identified β-ICs as an important site of ATP release, which triggers through P2Y2 receptor activation the local production and release of PGE2. We also show that β-ICs can downregulate ENaC in the neighboring PCs through this PGE2/ATP signaling. Genetic ablation of Cx30 in mice causes a salt-sensitive increase in blood pressure (28). Impairment of this paracrine signaling originating from β-ICs may be involved in the pathogenesis of several forms of salt-sensitive hypertension.
This paracrine ATP/PGE2 signaling originating from β-ICs for modulating Na+ absorption in the CCD seems well adapted to acutely modulate Na+ absorption in response to tubular NaCl overloading. Indeed, the distal nephron is challenged daily by variations in tubular fluid NaCl concentration as a direct consequence of dietary salt intake. Urinary ATP levels have been shown to increase with dietary Na+ intake (56, 57). We propose a paradigm in which β-ICs would sense the increase in NaCl delivery to the distal nephron and in turn release ATP/PGE2 to decrease Na+ absorption by adjacent PCs. We have reported that pendrin is primarily regulated in response to chronic changes in Cl– balance (i.e., pendrin expression is decreased when Cl– excretion increases) (58, 59). Thus, coordinated inhibition of Na+ and Cl– absorption through both PCs and ICs will allow the body to get rid of the excess of NaCl brought about by the diet.
In conclusion, we demonstrate that impaired renal sodium and potassium conservation observed in type I (or pump-defect type) dRTA is not the consequence of acidosis or of chronic interstitial nephritis, but is instead the consequence of the dysfunction of the proton pump in the β-IC. We propose a new paradigm where dysfunction of the proton pump in α-IC results in an acidification defect while dysfunction of the pump in β-ICs is responsible for renal loss of NaCl, K+, and water (Figure 7). In light of the present study, it would be of interest to measure urinary prostaglandin excretion in human dRTA patients in future studies and to determine whether indomethacin treatment would improve dehydration and hypokalemia in these patients.
Figure 7. Schematic description of the consequence of v-H+-ATPase dysfunction on Na+, K+, and water transport in the CNT/CCD and the MCD.

Atp6v1b1 disruption impairs both electroneutral Na+ absorption through β-ICs and ENaC-mediated Na+ absorption through the neighboring PCs. Local ATP/PGE2 signaling cascade is responsible for decreased ENaC protein and activity as well as AQP2 protein and contributes to Na+ and water losses, thereby promoting high tubular flow. ENaC inhibition in the CNT/CCD likely blocks K+ secretion through ROMK. In contrast, PCs in the MCD have a normal response to hyperaldosteronism (i.e. increased ENaC expression). Increased ENaC activity in the MCD is expected to favor K+ secretion through ROMK. High tubular flow activates BKCa potassium channels and K+ secretion, leading to renal K+ loss in Atp6v1b1–/– mice. Indeed, indomethacin, which reduced urinary flow and restored AQP2 protein levels in Atp6v1b1–/– mice, also normalized protein levels of BKCa and decreased urinary K+ excretion in Atp6v1b1–/– mice, leading to normal plasma potassium concentration.
Methods
Animals.
Atp6v1b1–/– mice were provided by R. Lifton (Yale University, New Haven, Connecticut, USA). Mice heterozygous for Atp6v1b1 gene disruption were crossed, and wild-type (Atp6v1b1+/+) and homozygous knockout mice (Atp6v1b1–/–) were genotyped in their offspring by PCR of tail biopsies. In all experiments, controls consisted of wild-type littermates.
Physiological studies.
All experiments were performed using age- and sex-matched Atp6v1b1+/+ and Atp6v1b1–/– littermates mice (3–5 months old). For urine collection, mice were housed in metabolic cages (Techniplast). Mice were given deionized water ad libitum and pair-fed with standard laboratory chow containing 0.3% of sodium (INRA). They were first allowed to adapt for 3–5 days to the cages. At steady state, urine collection was performed daily under mineral oil in the urine collector for electrolyte measurements. Mice were then switched to a NaCl-free diet (INRA). After the switch, urines were collected for the 6 first hours and for the subsequent 18 hours, and then each 24 hours for 7 days. Urine creatinine (modified kinetic Jaffé colorimetric method) was measured with a Konelab 20i auto-analyzer (Thermo Electron Corporation). Urinary chloride was measured with a DL 55 titrator (Mettler Toledo). Urinary Na+ and K+ were measured by flame photometry (IL943; Instruments Laboratory). Urine osmolalities were measured with a freezing point osmometer (Roebling). Plasma renin concentration was determined using radioimmunoassay of angiotensin I generated by incubation of the plasma at pH 8.5 in the presence of an excess of rat angiotensinogen (60). Urine aldosterone was measured via RIA (DPC Dade Behring). Urinary PGE2 was measured by EIA (Prostaglandin E2 EIA kit; Cayman Chemical). Urinary ATP was measured on diluted urines using the FLAA kit from Sigma-Aldrich. Blood collection by tail incision on anesthetized mice by peritoneal injection of a mixture (0.1 ml/g body weight) of ketamine (Imalgene; Rhône Mérieux; 10%) and xylazine (Rompun; Bayer AG; 5%) was performed for K+ measurement with an ABL 77 pH/blood-gas analyzer (Radiometer). Blood gases analyses were performed by retro-orbital puncture, and pH, PCO2, PO2, Na+, and Cl– were measured with an ABL 77 pH/blood-gas analyzer (Radiometer). Blood bicarbonate concentration was calculated from the measured values using the Henderson-Hasselbach equation.
For indomethacin treatment, indomethacin (Sigma-Aldrich) dissolved in ethanol (10% volume) and saline was injected intraperitoneally once a day for up to 6 days (5 mg/kg BW/d). Urines were collected daily and keep frozen at –80°C.
Blood pressure measurements in conscious mice.
Systolic blood pressure was measured in conscious mice fed a normal-salt diet using a computerized tail-cuff system after 1 week of daily training, as described elsewhere (61). Then at least 10 measurements were performed every day for at least 7 consecutive days. Only the last 4 days were kept for analyses. If the variability of the measurements made in a single day exceeded the SD by more than 20%, the measurements for that day were discarded and replaced by an additional day of measurement. This method has been extensively validated and correlates well with direct measurements of intra-arterial pressure (61).
Immunoblot analyses.
Animals were sacrificed with ketamine and xylazine (0.1 and 0.01 mg•g BW–1, respectively). Kidneys were removed and cut into 5-mm slices, and the cortex and medulla were excised under a stereoscopic microscope and placed into ice-cold isolation buffer (250 mM sucrose, 20 mM Tris-Hepes, pH 7.4) containing protease inhibitors (in μg/ml): 4 aprotinin, 4 leupeptin, 1.5 pepstatin A, and 28 4-(2- aminoethyl)-benzenesulfonyl fluoride (AEBSF). Minced renal tissues were homogenized in a Dounce homogenizer (pestle A, 5 passes) followed by 10 passes through a Teflon-glass homogenizer rotating at 1,000 rpm. The homogenate was centrifuged at 1,000 g for 10 minutes (rotor JS-13.1; Beckman), and the supernatant was centrifuged at 360,000 g for 40 minutes at 4°C (rotor 70.1 Ti; Beckman). The pellet was resuspended in isolation buffer. Protein contents were determined using the Bradford protein assay (microBradford; BioRad Laboratories).
Membrane proteins were solubilized in SDS-loading buffer (62.5 mM Tris HCl, pH 6.8, 2% SDS, 100 mM dithiotreitol, 10% glycerol and bromophenol blue), incubated at room temperature for 30 minutes. Electrophoresis was initially performed for all samples on 7.5% polyacrylamide minigels (XCell SureLock Mini-cell; Invitrogen Life Technologies), which were stained with Coomassie blue to provide quantitative assessment of loading (Supplemental Figure 4), as previously described (58). For immunoblotting, proteins were transferred electrophoretically (XCell II Blot Module; Invitrogen Life Technologies) for 1.5 h at 4°C from unstained gels to nitrocellulose membranes (Amersham) and then stained with 0.5% Ponceau S in acetic acid to check uniformity of protein transfer onto the nitrocellulose membrane. Membranes were first incubated in 5% nonfat dry milk in PBS, pH 7.4, for 1 h at room temperature to block nonspecific binding of antibody, followed by overnight at 4°C with the primary antibody (anti-Pendrin 1:10,000; anti-AQP2 1:100; anti–α-ENaC 1:10,000; anti–γ-ENaC 1:30,000; anti-ROMK 1:2,000; anti-BKCa α subunit 1:500; anti β-actin 1:500,000) in PBS containing 1% nonfat dry milk. After four 5-min washes in PBS containing 0.1% Tween-20, membranes were incubated with 1:10,000 dilution of goat anti-rabbit IgG (Bio-Rad) or horse anti-goat IgG (Vector Laboratories) conjugated to horseradish peroxidase in PBS containing 5% nonfat dry milk for 2 hours at room temperature. Blots were washed as described above, and luminol-ECL (PerkinElmer Life Science Products) was used to visualize bound antibodies before exposure to Hyperfilm ECL (Amersham). The autoradiography was digitized with the use of a laser scanner (Perfection 1650; Epson), and quantification of each band was performed via densitometry using NIH Image software. Densitometric values were normalized to the mean for the control group that was defined as 100% and results were expressed as mean ± SEM.
Antibodies against α and γ subunits of ENaC were a gift from J. Loffing (University of Zurich, Zurich, Switzerland). Antibody against α-ENaC was raised against the N terminus of mouse α-ENaC (MLDHTRAPELNLDLDLDVSNC) (62). Antibody against γ-ENaC has been described elsewhere (63). Antibodies against pendrin (64) were a gift from P. Aronson (Yale University, New Haven, Connecticut, USA). Antibodies against AQP2 used for immunoblotting were purchased from Santa Cruz Biotechnology. Antibodies against ROMK and BK α subunit were purchased from Alomone labs. Antibodies against β-actin were purchased from Abcam.
Immunofluorescence labeling on kidney tissue.
Mouse kidneys were fixed in situ by perfusion of 4% paraformaldehyde in PBS. Coronal kidney sections containing all kidney zones were then postfixed for 4–6 h at 4°C in 4% paraformaldehyde and then embedded in paraffin. Subsequently, 4-μm sections of the paraffin block were deparaffinized in toluene and rehydrated through graded ethanol. Rehydration was completed in TBS, pH 7.6. Slides were then placed in a plastic tank filled with Target Retrieval Solution (Dako) and heated 45 minutes in a water bath at 98°C. These steps unmasked antigens and allowed immunostaining of paraformaldehyde-fixed paraffin sections, as determined in preliminary experiments (data not shown). To reduce nonspecific binding, sections were rinsed in TBS for 10 minutes and incubated with background-reducing buffer (Dako) for 20 minutes. Mouse kidney sections were then labeled with the rabbit polyclonal AQP2 antibody as follows. Anti-AQP2 was applied for 1 hour at room temperature. After 3 washes, sections were incubated with a 1:1,000 dilution (in background-reducing buffer) of donkey anti-rabbit IgG coupled to Cy3 (Jackson Immunoresearch Laboratories, Inc.) in TBS, 30 minutes at room temperature, followed by 3 TBS washes. Rabbit anti-AQP2 antibodies (AQP2 H7661) were a gift from S. Frische (Aarhus University, Aarhus, Denmark) and were used by de Seigneux et al. (65).
In vitro microperfusion of mouse CCDs and transepithelial ion flux measurement.
Kidneys were removed and cut into 1- to 2-mm coronal slices that were transferred into a chilled dissection medium containing (in mM): 118 NaCl, 25 NaHCO3, 2.0 K2HPO4, 1.2 MgSO4, 2.0 calcium lactate, 1.0 sodium citrate, 5.5 glucose, and 12 creatinine, pH 7.4, and gassed with 95% O2/5% CO2. CCD segments were isolated from cortico-medullary rays under a dissecting microscope with a sharpened forceps. Because CCDs are highly heterogeneous, relatively short segments (0.45–0.6 mm) were dissected to maximize the reproducibility of the isolation procedure. In vitro microperfusion was performed as described by Burg et al. (66): isolated CCDs were rapidly transferred to a 1.2-ml temperature- and environment-controlled chamber, mounted on an inverted microscope, and then perfused and bathed initially at room temperature with dissection solution. The specimen chamber was continuously suffused with 95% O2/5% CO2 to maintain pH at 7.4. Once secure, the inner perfusion pipette was advanced, and the tubule was opened with a slight positive pressure. The opposite end of the tubule was then pulled into a holding collection pipette. In the holding collection pipette, 2–3 cm of water-saturated mineral oil contributed to maintain the tubule open at a low flow rate of perfusion. The perfusing and collecting end of the segment was sealed into a guard pipette using Dow Corning 200 dielectric fluid (Dow Corning Corp.). The tubules were then warmed to 37°C and equilibrated for 20 minutes while the collection rate was adjusted to a rate of 2 nl/min. The length of each segment was measured using an eyepiece micrometer. Because CCDs from mice are frequently unstable and collapse rapidly, measurements were conducted during the first 90 minutes of perfusion. Usually, collections from 4 periods of 15 minutes were performed in which 25 to 30 nanoliters of fluid were collected. The volume of the collections was determined under water-saturated mineral oil with calibrated volumetric pipettes. For [Na+] and [creatinine] measurements, 20 nl were required, while 2–3 nanoliters were used for [Cl–] determinations.
[Na+] and [creatinine] measurements were performed by HPLC and [Cl–] was measured by microcoulometry as previously described (16, 67, 68).
Creatinine was used as the volume marker and therefore was added to the perfusion solutions (both perfusate and bath) at a concentration of 12 mM. The rate of fluid absorption (Jv) was calculated as Jv = (Vperf – Vcoll) / L, with Vperf = Crcoll / Crperf × Vcoll, where Crcoll and Crperf are the concentrations of creatinine in the collected fluid and perfusate, respectively, Vcoll is the collection rate at the end of the tubule, and L is the length of the tubule.
For each collection, Na+ flux (JNa) was calculated and reported to the length of the tubule: JNa = [([Na]perf × Vperf) – ([Na]coll × Vcoll)] / L and JCl = [([Cl]perf × Vperf) – ([Cl]coll × Vcoll)] / L, where perf indicates perfusate and coll indicates collection fluid. Therefore, positive values indicate net absorption, whereas negative values indicate net secretion of the ion. For each tubule, the mean of the 4 collection periods was used.
Fluorescence microscopy.
The [Ca2+]i of HEK/EP1 biosensor cells was measured as described previously (27). On average, 3–4 HEK/EP1 biosensor cells were placed at the tubule exit, and almost all biosensor cells produced PGE2-induced calcium elevations.
Statistics.
Experimental results are summarized as means ± SEM. All statistical comparisons were made using the unpaired Student’s t test (2-tailed) or ANOVA followed by a Bonferroni’s post hoc test when appropriate. A P value less than 0.05 was considered significant.
Study approval.
All the experimental procedures were approved by the ethics committee at the University Pierre et Marie Curie (agreement Ce5/2010/053) and were performed in accordance with the NIH Guide for the Care and Use of Laboratory Animals and with the French Government animal welfare policy (agreement RA024647151FR).
Supplementary Material
Acknowledgments
We thank Luciana Morla for technical assistance. R. Chambrey and D. Eladari are funded by INSERM, by CNRS, by the Transatlantic Network for Hypertension of the Fondation Leducq, by grant “subvention de recherche 2010 AMGEN” from the Société de Néphrologie (to R. Chambrey), by grant subvention de recherche 2010 from the Association pour l’Information et la Recherche sur les Maladies Rénales Génétiques (to R. Chambrey), and by grants from l’Agence Nationale de la Recherche (ANR) (ANR BLANC 2012-R13011KK to R. Chambrey and ANR BLANC 2010-R10164DD to D. Eladari). N. Cornière is funded by la Fondation pour la Recherche Médicale (DEA20100619499). M. Jayat is funded by the CODDIM from the Region Ile de France. Some of these studies were funded by NIH grant DK64324 and an American Heart Association Established Investigator Award (to J. Peti-Peterdi). C.A. Wagner is supported by a grant from the Swiss National Science Foundation (31003A_138143/1).
Footnotes
Conflict of interest: The authors have declared that no conflict of interest exists.
Citation for this article: J Clin Invest. 2013;123(10):4219–4231. doi:10.1172/JCI63492.
See the related Commentary beginning on page 4139.
References
- 1.Alper SL. Genetic diseases of acid-base transporters. Annu Rev Physiol. 2002;64:899–923. doi: 10.1146/annurev.physiol.64.092801.141759. [DOI] [PubMed] [Google Scholar]
- 2.Wagner CA, Devuyst O, Bourgeois S, Mohebbi N. Regulated acid-base transport in the collecting duct. Pflugers Arch. 2009;458(1):137–156. doi: 10.1007/s00424-009-0657-z. [DOI] [PubMed] [Google Scholar]
- 3.Alper SL, Natale J, Gluck S, Lodish HF, Brown D. Subtypes of intercalated cells in rat kidney collecting duct defined by antibodies against erythroid band 3 and renal vacuolar H+-ATPase. Proc Natl Acad Sci U S A. 1989;86(14):5429–5433. doi: 10.1073/pnas.86.14.5429. [DOI] [PMC free article] [PubMed] [Google Scholar]
- 4.Wagner CA, Finberg KE, Breton S, Marshansky V, Brown D, Geibel JP. Renal vacuolar H+-ATPase. Physiol Rev. 2004;84(4):1263–1314. doi: 10.1152/physrev.00045.2003. [DOI] [PubMed] [Google Scholar]
- 5.Karet FE, et al. Mutations in the gene encoding B1 subunit of H+-ATPase cause renal tubular acidosis with sensorineural deafness. Nat Genet. 1999;21(1):84–90. doi: 10.1038/5022. [DOI] [PubMed] [Google Scholar]
- 6.Smith AN, et al. Mutations in ATP6N1B, encoding a new kidney vacuolar proton pump 116-kD subunit, cause recessive distal renal tubular acidosis with preserved hearing. Nat Genet. 2000;26(1):71–75. doi: 10.1038/79208. [DOI] [PubMed] [Google Scholar]
- 7.Bruce LJ, et al. Familial distal renal tubular acidosis is associated with mutations in the red cell anion exchanger (Band 3, AE1) gene. J Clin Invest. 1997;100(7):1693–1707. doi: 10.1172/JCI119694. [DOI] [PMC free article] [PubMed] [Google Scholar]
- 8.Karet FE, et al. Mutations in the chloride-bicarbonate exchanger gene AE1 cause autosomal dominant but not autosomal recessive distal renal tubular acidosis. Proc Natl Acad Sci U S A. 1998;95(11):6337–6342. doi: 10.1073/pnas.95.11.6337. [DOI] [PMC free article] [PubMed] [Google Scholar]
- 9.Sebastian A, McSherry E, Morris RC. Renal potassium wasting in renal tubular acidosis (RTA): its occurrence in types 1 and 2 RTA despite sustained correction of systemic acidosis. J Clin Invest. 1971;50(3):667–678. doi: 10.1172/JCI106537. [DOI] [PMC free article] [PubMed] [Google Scholar]
- 10.Sebastian A, McSherry E, Morris RC. Impaired renal conservation of sodium and chloride during sustained correction of systemic acidosis in patients with type 1, classic renal tubular acidosis. J Clin Invest. 1976;58(2):454–469. doi: 10.1172/JCI108490. [DOI] [PMC free article] [PubMed] [Google Scholar]
- 11.Gill JR, Bell NH, Bartter FC. Impaired conservation of sodium and potassium in renal tubular acidosis and its correction by buffer anions. Clin Sci. 1967;33(3):577–592. [PubMed] [Google Scholar]
- 12.Finberg KE, Wagner CA, Stehberger PA, Geibel JP, Lifton RP. Molecular cloning and characterization of Atp6v1b1, the murine vacuolar H+ -ATPase B1-subunit. Gene. 2003;318:25–34. doi: 10.1016/S0378-1119(03)00790-X. [DOI] [PubMed] [Google Scholar]
- 13.Stehberger PA, et al. Localization and regulation of the ATP6V0A4 (a4) vacuolar H+-ATPase subunit defective in an inherited form of distal renal tubular acidosis. J Am Soc Nephrol. 2003;14(12):3027–3038. doi: 10.1097/01.ASN.0000099375.74789.AB. [DOI] [PubMed] [Google Scholar]
- 14.Royaux IE, et al. Pendrin, encoded by the Pendred syndrome gene, resides in the apical region of renal intercalated cells and mediates bicarbonate secretion. Proc Natl Acad Sci U S A. 2001;98(7):4221–4226. doi: 10.1073/pnas.071516798. [DOI] [PMC free article] [PubMed] [Google Scholar]
- 15.Eladari D, Chambrey R, Peti-Peterdi J. A new look at electrolyte transport in the distal tubule. Annu Rev Physiol. 2012;74:325–349. doi: 10.1146/annurev-physiol-020911-153225. [DOI] [PMC free article] [PubMed] [Google Scholar]
- 16.Leviel F, et al. The Na+-dependent chloride-bicarbonate exchanger SLC4A8 mediates an electroneutral Na+ reabsorption process in the renal cortical collecting ducts of mice. J Clin Invest. 2010;120(5):1627–1635. doi: 10.1172/JCI40145. [DOI] [PMC free article] [PubMed] [Google Scholar]
- 17.Verlander JW, et al. Deoxycorticosterone upregulates PDS (Slc26a4) in mouse kidney: role of pendrin in mineralocorticoid-induced hypertension. Hypertension. 2003;42(3):356–362. doi: 10.1161/01.HYP.0000088321.67254.B7. [DOI] [PubMed] [Google Scholar]
- 18.Wall SM, et al. NaCl restriction upregulates renal Slc26a4 through subcellular redistribution: role in Cl- conservation. Hypertension. 2004;44(6):982–987. doi: 10.1161/01.HYP.0000145863.96091.89. [DOI] [PubMed] [Google Scholar]
- 19.Finberg KE, et al. The B1-subunit of the H(+) ATPase is required for maximal urinary acidification. Proc Natl Acad Sci U S A. 2005;102(38):13616–13621. doi: 10.1073/pnas.0506769102. [DOI] [PMC free article] [PubMed] [Google Scholar]
- 20.Paunescu TG, et al. Compensatory membrane expression of the V-ATPase B2 subunit isoform in renal medullary intercalated cells of B1-deficient mice. Am J Physiol Renal Physiol. 2007;293(6):F1915–F1926. doi: 10.1152/ajprenal.00160.2007. [DOI] [PubMed] [Google Scholar]
- 21.Pech V, Kim YH, Weinstein AM, Everett LA, Pham TD, Wall SM. Angiotensin II increases chloride absorption in the cortical collecting duct in mice through a pendrin-dependent mechanism. Am J Physiol Renal Physiol. 2007;292(3):F914–F920. doi: 10.1152/ajprenal.00361.2006. [DOI] [PubMed] [Google Scholar]
- 22.Kim YH, et al. Reduced ENaC protein abundance contributes to the lower blood pressure observed in pendrin-null mice. Am J Physiol Renal Physiol. 2007;293(4):F1314–F1324. doi: 10.1152/ajprenal.00155.2007. [DOI] [PubMed] [Google Scholar]
- 23.Satlin LM, Carattino MD, Liu W, Kleyman TR. Regulation of cation transport in the distal nephron by mechanical forces. Am J Physiol Renal Physiol. 2006;291(5):F923–F931. doi: 10.1152/ajprenal.00192.2006. [DOI] [PubMed] [Google Scholar]
- 24.Hao CM, Breyer MD. Physiological regulation of prostaglandins in the kidney. Annu Rev Physiol. 2008;70:357–377. doi: 10.1146/annurev.physiol.70.113006.100614. [DOI] [PubMed] [Google Scholar]
- 25.Guan Y, et al. Prostaglandin E2 inhibits renal collecting duct Na+ absorption by activating the EP1 receptor. J Clin Invest. 1998;102(1):194–201. doi: 10.1172/JCI2872. [DOI] [PMC free article] [PubMed] [Google Scholar]
- 26.Hebert RL, Jacobson HR, Fredin D, Breyer MD. Evidence that separate PGE2 receptors modulate water and sodium transport in rabbit cortical collecting duct. Am J Physiol. 1993;265(5 pt 2):F643–F650. doi: 10.1152/ajprenal.1993.265.5.F643. [DOI] [PubMed] [Google Scholar]
- 27.Peti-Peterdi J, et al. Luminal NaCl delivery regulates basolateral PGE2 release from macula densa cells. J Clin Invest. 2003;112(1):76–82. doi: 10.1172/JCI18018. [DOI] [PMC free article] [PubMed] [Google Scholar]
- 28.Sipos A, Vargas SL, Toma I, Hanner F, Willecke K, Peti-Peterdi J. Connexin 30 deficiency impairs renal tubular ATP release and pressure natriuresis. J Am Soc Nephrol. 2009;20(8):1724–1732. doi: 10.1681/ASN.2008101099. [DOI] [PMC free article] [PubMed] [Google Scholar]
- 29.Lehrmann H, Thomas J, Kim SJ, Jacobi C, Leipziger J. Luminal P2Y2 receptor-mediated inhibition of Na+ absorption in isolated perfused mouse CCD. J Am Soc Nephrol. 2002;13(1):10–18. doi: 10.1681/ASN.V13110. [DOI] [PubMed] [Google Scholar]
- 30.Pochynyuk O, et al. Paracrine regulation of the epithelial Na+ channel in the mammalian collecting duct by purinergic P2Y2 receptor tone. J Biol Chem. 2008;283(52):36599–36607. doi: 10.1074/jbc.M807129200. [DOI] [PMC free article] [PubMed] [Google Scholar]
- 31.Lin CC, et al. Functional coupling expression of COX-2 and cPLA2 induced by ATP in rat vascular smooth muscle cells: role of ERK1/2, p38 MAPK, and NF-kappaB. Cardiovasc Res. 2009;82(3):522–531. doi: 10.1093/cvr/cvp069. [DOI] [PubMed] [Google Scholar]
- 32.Welch BD, Carlson NG, Shi H, Myatt L, Kishore BK. P2Y2 receptor-stimulated release of prostaglandin E2 by rat inner medullary collecting duct preparations. Am J Physiol Renal Physiol. 2003;285(4):F711–F721. doi: 10.1152/ajprenal.00096.2003. [DOI] [PubMed] [Google Scholar]
- 33.Xia M, Zhu Y. Signaling pathways of ATP-induced PGE2 release in spinal cord astrocytes are EGFR transactivation-dependent. Glia. 2011;59(4):664–674. doi: 10.1002/glia.21138. [DOI] [PubMed] [Google Scholar]
- 34.Wall SM, et al. Localization of pendrin in mouse kidney. Am J Physiol Renal Physiol. 2003;284(1):F229–F241. doi: 10.1152/ajprenal.00147.2002. [DOI] [PubMed] [Google Scholar]
- 35.Vedovelli L, et al. Altered V-ATPase expression in renal intercalated cells isolated from B1 subunit-deficient mice by fluorescence-activated cell sorting. Am J Physiol Renal Physiol. 2013;304(5):F522–F532. doi: 10.1152/ajprenal.00394.2012. [DOI] [PMC free article] [PubMed] [Google Scholar]
- 36.Rothenberger F, Velic A, Stehberger PA, Kovacikova J, Wagner CA. Angiotensin II stimulates vacuolar H+ -ATPase activity in renal acid-secretory intercalated cells from the outer medullary collecting duct. J Am Soc Nephrol. 2007;18(7):2085–2093. doi: 10.1681/ASN.2006070753. [DOI] [PubMed] [Google Scholar]
- 37.Hebert SC, Desir G, Giebisch G, Wang W. Molecular diversity and regulation of renal potassium channels. Physiol Rev. 2005;85(1):319–371. doi: 10.1152/physrev.00051.2003. [DOI] [PMC free article] [PubMed] [Google Scholar]
- 38.Najjar F, et al. Dietary K+ regulates apical membrane expression of maxi-K channels in rabbit cortical collecting duct. Am J Physiol Renal Physiol. 2005;289(4):F922–F932. doi: 10.1152/ajprenal.00057.2005. [DOI] [PubMed] [Google Scholar]
- 39.Palmer LG, Frindt G. High-conductance K channels in intercalated cells of the rat distal nephron. Am J Physiol Renal Physiol. 2007;292(3):F966–F973. doi: 10.1152/ajprenal.00191.2006. [DOI] [PubMed] [Google Scholar]
- 40.Ginns SM, et al. Immunolocalization of the secretory isoform of Na-K-Cl cotransporter in rat renal intercalated cells. J Am Soc Nephrol. 1996;7(12):2533–2542. doi: 10.1681/ASN.V7122533. [DOI] [PubMed] [Google Scholar]
- 41.Liu W, et al. Role of NKCC in BK channel-mediated net K(+) secretion in the CCD. Am J Physiol Renal Physiol. 2011;301(5):F1088–F1097. doi: 10.1152/ajprenal.00347.2011. [DOI] [PMC free article] [PubMed] [Google Scholar]
- 42.Pech V, et al. Pendrin modulates ENaC function by changing luminal HCO3. J Am Soc Nephrol. 2010;21(11):1928–1941. doi: 10.1681/ASN.2009121257. [DOI] [PMC free article] [PubMed] [Google Scholar]
- 43.Ando Y, Asano Y. Luminal prostaglandin E2 modulates sodium and water transport in rabbit cortical collecting ducts. Am J Physiol. 1995;268(6 pt 2):F1093–F1101. doi: 10.1152/ajprenal.1995.268.6.F1093. [DOI] [PubMed] [Google Scholar]
- 44.Flores D, Liu Y, Liu W, Satlin LM, Rohatgi R. Flow-induced prostaglandin E2 release regulates Na and K transport in the collecting duct. Am J Physiol Renal Physiol. 2012;303(5):F632–F638. doi: 10.1152/ajprenal.00169.2012. [DOI] [PMC free article] [PubMed] [Google Scholar]
- 45.McCulloch F, Chambrey R, Eladari D, Peti-Peterdi J. Localization of connexin 30 in the luminal membrane of cells in the distal nephron. Am J Physiol Renal Physiol. 2005;289(6):F1304–F1312. doi: 10.1152/ajprenal.00203.2005. [DOI] [PubMed] [Google Scholar]
- 46.Hanner F, Lam L, Nguyen MT, Yu A, Peti-Peterdi J. Intrarenal localization of the plasma membrane ATP channel pannexin1. Am J Physiol Renal Physiol. 2012;303(10):F1454–F1459. doi: 10.1152/ajprenal.00206.2011. [DOI] [PMC free article] [PubMed] [Google Scholar]
- 47.Deetjen P, Thomas J, Lehrmann H, Kim SJ, Leipziger J. The luminal P2Y receptor in the isolated perfused mouse cortical collecting duct. J Am Soc Nephrol. 2000;11(10):1798–1806. doi: 10.1681/ASN.V11101798. [DOI] [PubMed] [Google Scholar]
- 48.Kishore BK, Chou CL, Knepper MA. Extracellular nucleotide receptor inhibits AVP-stimulated water permeability in inner medullary collecting duct. Am J Physiol. 1995;269(6 pt 2):F863–F869. doi: 10.1152/ajprenal.1995.269.6.F863. [DOI] [PubMed] [Google Scholar]
- 49.Wildman SS, et al. Nucleotides downregulate aquaporin 2 via activation of apical P2 receptors. J Am Soc Nephrol. 2009;20(7):1480–1490. doi: 10.1681/ASN.2008070686. [DOI] [PMC free article] [PubMed] [Google Scholar]
- 50.Zusman RM, Keiser HR. Prostaglandin biosynthesis by rabbit renomedullary interstitial cells in tissue culture. Stimulation by angiotensin II, bradykinin, and arginine vasopressin. J Clin Invest. 1977;60(1):215–223. doi: 10.1172/JCI108758. [DOI] [PMC free article] [PubMed] [Google Scholar]
- 51.Garcia-Perez A, Smith WL. Apical-basolateral membrane asymmetry in canine cortical collecting tubule cells. Bradykinin, arginine vasopressin, prostaglandin E2 interrelationships. J Clin Invest. 1984;74(1):63–74. doi: 10.1172/JCI111419. [DOI] [PMC free article] [PubMed] [Google Scholar]
- 52.Sakairi Y, Jacobson HR, Noland TD, Breyer MD. Luminal prostaglandin E receptors regulate salt and water transport in rabbit cortical collecting duct. Am J Physiol. 1995;269(2 pt 2):F257–F265. doi: 10.1152/ajprenal.1995.269.2.F257. [DOI] [PubMed] [Google Scholar]
- 53.Jensen BL, Stubbe J, Hansen PB, Andreasen D, Skott O. Localization of prostaglandin E(2) EP2 and EP4 receptors in the rat kidney. Am J Physiol Renal Physiol. 2001;280(6):F1001–F1009. doi: 10.1152/ajprenal.2001.280.6.F1001. [DOI] [PubMed] [Google Scholar]
- 54.Facemire CS, Griffiths R, Audoly LP, Koller BH, Coffman TM. The impact of microsomal prostaglandin e synthase 1 on blood pressure is determined by genetic background. Hypertension. 2010;55(2):531–538. doi: 10.1161/HYPERTENSIONAHA.109.145631. [DOI] [PMC free article] [PubMed] [Google Scholar]
- 55.Rieg T, et al. Mice lacking P2Y2 receptors have salt-resistant hypertension and facilitated renal Na+ and water reabsorption. FASEB J. 2007;21(13):3717–3726. doi: 10.1096/fj.07-8807com. [DOI] [PubMed] [Google Scholar]
- 56.Mironova E, Peti-Peterdi J, Bugaj V, Stockand JD. Diminished paracrine regulation of the epithelial Na+ channel by purinergic signaling in mice lacking connexin 30. J Biol Chem. 2011;286(2):1054–1060. doi: 10.1074/jbc.M110.176552. [DOI] [PMC free article] [PubMed] [Google Scholar]
- 57.Stockand JD, et al. Purinergic inhibition of ENaC produces aldosterone escape. J Am Soc Nephrol. 2010;21(11):1903–1911. doi: 10.1681/ASN.2010040377. [DOI] [PMC free article] [PubMed] [Google Scholar]
- 58.Quentin F, et al. The Cl-/HCO3- exchanger pendrin in the rat kidney is regulated in response to chronic alterations in chloride balance. Am J Physiol Renal Physiol. 2004;287(6):F1179–F1188. doi: 10.1152/ajprenal.00211.2004. [DOI] [PubMed] [Google Scholar]
- 59.Vallet M, et al. Pendrin regulation in mouse kidney primarily is chloride-dependent. J Am Soc Nephrol. 2006;17(8):2153–2163. doi: 10.1681/ASN.2005101054. [DOI] [PubMed] [Google Scholar]
- 60.Menard J, Catt KJ. Measurement of renin activity, concentration and substrate in rat plasma by radioimmunoassay of angiotensin I. Endocrinology. 1972;90(2):422–430. doi: 10.1210/endo-90-2-422. [DOI] [PubMed] [Google Scholar]
- 61.Ito M, et al. Regulation of blood pressure by the type 1A angiotensin II receptor gene. Proc Natl Acad Sci U S A. 1995;92(8):3521–3525. doi: 10.1073/pnas.92.8.3521. [DOI] [PMC free article] [PubMed] [Google Scholar]
- 62.Sorensen MV, et al. Rapid dephosphorylation of the renal sodium chloride cotransporter in response to oral potassium intake in mice. Kidney Int. 2013;83(5):811–824. doi: 10.1038/ki.2013.14. [DOI] [PubMed] [Google Scholar]
- 63.Wagner CA, et al. Mouse model of type II Bartter’s syndrome. II. Altered expression of renal sodium- and water-transporting proteins. Am J Physiol Renal Physiol. 2008;294:F1373–F1380. doi: 10.1152/ajprenal.00613.2007. [DOI] [PubMed] [Google Scholar]
- 64.Knauf F, Yang CL, Thomson RB, Mentone SA, Giebisch G, Aronson PS. Identification of a chloride-formate exchanger expressed on the brush border membrane of renal proximal tubule cells. Proc Natl Acad Sci U S A. 2001;98(16):9425–9430. doi: 10.1073/pnas.141241098. [DOI] [PMC free article] [PubMed] [Google Scholar]
- 65.de Seigneux S, Malte H, Dimke H, Frokiaer J, Nielsen S, Frische S. Renal compensation to chronic hypoxic hypercapnia: downregulation of pendrin and adaptation of the proximal tubule. Am J Physiol Renal Physiol. 2007;292(4):F1256–F1266. doi: 10.1152/ajprenal.00220.2006. [DOI] [PubMed] [Google Scholar]
- 66.Burg M, Grantham J, Abramow M, Orloff J. Preparation and study of fragments of single rabbit nephrons. Am J Physiol. 1966;210(6):1293–1298. doi: 10.1152/ajplegacy.1966.210.6.1293. [DOI] [PubMed] [Google Scholar]
- 67.Chambrey R, et al. Renal intercalated cells are rather energized by a proton than a sodium pump. Proc Natl Acad Sci U S A. 2013;110(19):7928–7933. doi: 10.1073/pnas.1221496110. [DOI] [PMC free article] [PubMed] [Google Scholar]
- 68.El Moghrabi S, et al. Tissue kallikrein permits early renal adaptation to potassium load. Proc Natl Acad Sci U S A. 2010;107(30):13526–13531. doi: 10.1073/pnas.0913070107. [DOI] [PMC free article] [PubMed] [Google Scholar]
Associated Data
This section collects any data citations, data availability statements, or supplementary materials included in this article.