

Significance
The ability to culture and image microbes on the single-cell level has provided insight into many biological phenomena. Single-cell studies were made possible through the development of microfluidic devices, which have been restricted to culturing a handful of strains at a time. We developed a microfluidic microchemostat array capable of culturing 1,152 yeast strains and demonstrate that the platform is capable of large-scale analysis by imaging the entire yeast-GFP library under numerous environmental conditions. Aside from identifying novel regulatory mechanisms, large-scale single-cell analysis will be useful for cellular engineering.
Keywords: microfluidics, cell arrays, high-content imaging, DNA damage response, yeast proteomics
Abstract
Observing cellular responses to perturbations is central to generating and testing hypotheses in biology. We developed a massively parallel microchemostat array capable of growing and observing 1,152 yeast-GFP strains on the single-cell level with 20 min time resolution. We measured protein abundance and localization changes in 4,085 GFP-tagged strains in response to methyl methanesulfonate and analyzed 576 GFP strains in five additional conditions for a total of more than 10,000 unique experiments, providing a systematic view of the yeast proteome in flux. We observed that processing bodies formed rapidly and synchronously in response to UV irradiation, and in conjunction with 506 deletion-GFP strains, identified four gene disruptions leading to abnormal ribonucleotide-diphosphate reductase (Rnr4) localization. Our microchemostat platform enables the large-scale interrogation of proteomes in flux and permits the concurrent observation of protein abundance, localization, cell size, and growth parameters on the single-cell level for thousands of microbial cultures in one experiment.
Observing proteins in the cellular milieu has been a long-standing technical challenge in biology. One major advance was the development of GFP, enabling the visualization of proteins in vivo (1). High-content imaging has been primarily applied to mammalian cells, using either reverse transfection arrays or microtiter-based systems in which the slow doubling time of mammalian cells enables long-term imaging under static conditions (2, 3).
The Saccharomyces cerevisiae GFP fusion library covering 4,159 proteins provided the first static view of global protein abundance, localization, and noise (4, 5). This library was recently used to establish the static differences in protein abundance and localization in response to DNA replication stress induced by methyl methanesulfonate (MMS) and hydroxyurea (HU) (6), in response to DTT, H2O2, and nitrogen starvation (7), and 800 cytoplasmic proteins were analyzed upon entry into stationary phase (8). These three recent large-scale screens all relied on standard microtiter plates for imaging the yeast strains at a single time point before and after perturbation. Meanwhile, microfluidic devices emerged as powerful tools for conducting complex time-lapse experiments on small to medium scales (9, 10), enabling the analysis of cellular network responses (11) and the implementation of synthetically engineered systems (12). However, it has thus far been technically impossible to interrogate thousands of continuously growing microbial strains with high spatiotemporal resolution in a single experiment.
Despite the fact that a wealth of systems-level information is available for S. cerevisiae, the single-cell temporal dynamics of protein abundance and localization has not yet been measured on a systems scale. To enable such analyses we developed a microfluidic platform capable of growing and observing 1,152 yeast strains with a temporal resolution of 20 min. We explored the dynamic behavior of ∼2/3 of the yeast proteome by imaging 4,085 yeast-GFP strains during a switch to 0.03% MMS. A subset of 576 strains that exhibited abundance or localization changes in response to MMS were interrogated in five additional conditions: HU, low MMS, MMS pulses, UV pulses, and hyperosmotic shock. We generated 506 deletion-GFP strains that allowed us to identify components regulating processing body (P-body) formation in response to UV irradiation. We confirmed that Wtm1 regulates Rnr4 nuclear localization, which is a key effector of the UV response. We additionally identified two gene deletions, tsa1Δ and rtt101Δ, that led to increased cytoplasmic localization of Rnr4 and two gene deletions, rai1Δ and nam7Δ, that led to increased nuclear localization. We thus establish P-body formation as an intricate component of the UV stress response and provide insights into Rnr4 regulation.
Results
Massively Parallel Microchemostat Device.
We developed a microfluidic device containing an array of 1,152 microchemostats (Fig. 1 A and B and SI Appendix, Figs. S1–S5). These 1,152 microchemostats are subdivided into three independent sections of 384 microchemostats each, and medium supply can be switched between two sources. Yeast strains are arrayed on a standard microscope coverslip using a DNA array spotter (Fig. 1C and SI Appendix, Figs. S1 and S4). The cell array is aligned to the microfluidic device, and the device is then primed with medium, which is continuously flowed through the medium supply channels. No fluid flow occurs through the microchemostats, and nutrients are supplied by diffusion to each growth chamber (SI Appendix, Fig. S5). The arrayed cells start to divide and eventually occupy all available space in the michrochemostat. Once the microchemostats are confluent, cells are prevented from escaping the bottom of the growth chamber by the shallow sieve channels. Cells thus are pushed out the top of each microchemostat, where they are carried away by the medium stream and consequently eluted from the device. Michrochemostat cross-contamination is avoided because there is no active flow through the microchemostats. Furthermore, once the growth chambers are confluent, cells cannot invade other microchemostats (SI Appendix, Movie S1). Details of cell arraying, device priming, and on-chip cell culturing are given in the SI Appendix, and SI Appendix, Movies S1–S3 show on-chip cell growth.
Fig. 1.

A massively parallel microchemostat array for culturing 1,152 yeast strains. (A) Design of the microchemostat array with flow and control layers in blue and red, respectively. (B) Detailed schematic of a pair of microchemostats. (C) Illustration of the chip programming process.
To achieve high-quality imaging each strain was grown as a monolayer by using an active method to push down on the 5-μm-high microchemostat roof (Fig. 1B and SI Appendix, Fig. S1). The microfluidic device was placed on an automated fluorescence microscope to image each microchemostat in phase contrast and fluorescence at 90× magnification and 20-min time resolution (SI Appendix, Fig. S3). We determined the on-chip doubling time to be 129 min, which is comparable to a batch doubling time of 120 min (SI Appendix, Fig. S7).
Image Analysis.
Image analysis was accomplished with a custom-written software pipeline that automatically conducts all processing steps, including chamber segmentation, cell segmentation, background correction, signal deconvolution, and protein localization analysis (SI Appendix, Figs. S8–S13). Cell segmentation is accomplished in two steps. First the images were segmented using a watershed, followed by the precise segmentation of cells using ovuscules and e-snakes (SI Appendix, Fig. S8B). Using a virtual cell sorting algorithm, we achieved a specificity of 92.3% for correctly segmented cells (SI Appendix, Figs. S8C and S12).
Aside from being extremely labor intensive, we found that manual annotation of protein localization can be error prone, with often limited overlap between two independent annotations. To eliminate our dependency on manual scoring we developed algorithms to quantify protein localization (SI Appendix, Fig. S8 D and E). We implemented a fuzzy classification approach that returns the probability of a cell to display any mixture of six main spatial patterns defined as (i) periphery (cell membrane), (ii) structure (endoplasmic reticulum, golgi, vacuole, etc.), (iii) punctate (cytoplasmic or nuclear foci), (iv) disk (nuclear and nucleolar), (v) corona (cytoplasmic), and (vi) homogeneous (no detectable localization) (SI Appendix, Fig. S8D). This classifier allowed us to determine subcellular protein localization, to detect protein localization changes, and to quantify the timing of localization changes. The probability vectors of the six spatial patterns carry sufficient information to distinguish similar subcellular localizations, such as nuclear (Hhf1) and nucleolar (Utp10) (SI Appendix, Fig. S8E), and can be mapped back to physiologically relevant localization classes as defined by Huh et al. (5) (SI Appendix, Figs. S8F and S31–S34). The analysis returned a comprehensive set of data including single-cell protein abundance, noise, localization, and morphological features such as cell size (SI Appendix, Fig. S8G and Movie S4). Details can be found in SI Appendix.
Data Overview and Platform Performance.
With 22 microchemostat devices we captured 23,040 movies, of which 16,731 (72.6%) passed a stringent quality filter (SI Appendix, Table S2). These 16,731 movies consisted of 21 × 106 images, from which we analyzed a total of 1.5 × 10⁸ cells, with an average of 199 cells quantified per image. By comparison, the original University of California, San Francisco (UCSF) yeast-GFP collection consisted of 14,562 images (5), the study by Tkach et al. collected 74,664 images (6), and the entire University of Washington - Yeast Resource Center (UW-YRC) currently contains ∼1.2 × 10⁶ images. Overall we performed the equivalent of more than 10,000 unique experiments. All data can be accessed at cellbase.epfl.ch.
We imaged the complete GFP library (4,159 strains) growing for 6 h in standard conditions (SD-his, 20 g/L glucose), followed by a switch to medium containing 0.03% MMS for 7 h. We achieved a coverage of 4,085 strains (98.2%) (SI Appendix, Fig. S17). On the basis of this dataset, we manually selected a subset of 576 strains for which we observed protein abundance or localization changes in response to MMS. This subset was further analyzed under five additional conditions: (i) 0.2 M HU, (ii) low MMS (0.0075%), (iii) MMS pulses, (iv) UV pulses, and (v) hyperosmotic shock (1 M sorbitol).
We used 2,580 duplicate movies to assess the repeatability of our measurement. The mean and SD of the raw intensity values correlated well between two independent repeats ( ) and were stable over the entire recording period (SI Appendix, Fig. S16). The correlations were slightly weaker after deconvolution owing to low protein abundance in many strains (
 ,
,  , and
, and  ) (Fig. 2A), and the relationship between protein noise and abundance was similar to that in previous experiments (SI Appendix, Fig. S14) (4, 13, 14). Our measurements were also in good agreement with a FACS measurement (
 ; SI Appendix, Fig. S20) (4), a recent microscopy study (
 ; SI Appendix, Fig. S21) (6), and with two methods for determining absolute protein abundance: tandem affinity purification (TAP) western (
 ) (15) and mass spectrometry (
 ) (SI Appendix, Fig. S14) (16). The latter correlations allowed us to derive a calibration curve converting arbitrary fluorescence values to absolute numbers of proteins per cell.
Fig. 2.

(A) Scatter plot of the median data points before MMS treatment for two repeat experiments ( ,
,  for linear data;
  ,
,  for log-transformed data;
  , Spearman correlation coefficient; n, number of data points). (B) Mean abundance for 2,534 strains. Abundance is normalized to the median of the pre-MMS data points. The orange line shows the global median. The red and blue lines represent a threefold increase/decrease threshold. (C) Abundance fold change vs. pre-MMS abundance. The gray scale shows the significance of the fold change for each protein. Dashed lines show the P = 0.01 significance threshold. A total of 124 proteins fell above both significance thresholds (P value <0.01 and fold change >3). (D) Protein accumulation rate plotted vs. induction time for the 124 up-regulated proteins. SDs are shown with gray lines (n varies from 1 to 16). (Inset) Correlation between protein timing and mRNA timing.
Protein Abundance Changes.
To identify proteins whose abundance changed upon MMS treatment, we compared the mean abundance values of the last three time points with pre-MMS levels. A total of 124 proteins exhibited a significant fold increase (P < 0.01, >threefold) (Fig. 2 B and C). Surprisingly, no proteins were observed with a significant fold decrease. Cells thus accumulated protein upon MMS treatment (Fig. 2B, orange line). A similar result was recently observed for ∼2,500 proteins measured from bulk populations by mass spectrometry in response to osmotic shock (17). At steady state, protein abundance is determined by synthesis, degradation, and dilution rates. Cells arrested within 1 h upon exposure to MMS, effectively eliminating dilution (SI Appendix, Fig. S22). We note that low-abundance proteins could be actively degraded but that their absolute change in abundance is below the current sensitivity limit. Nevertheless, no medium- or high-abundance proteins were observed to significantly decrease upon MMS treatment. The same was observed for the subset of 576 proteins measured in the five additional stress conditions (SI Appendix, Figs. S26–S30), suggesting that yeast cells rely on dilution for the removal of medium- to high-abundance proteins, rather than expending energy in active degradation, under the stress conditions examined here.
We determined the timing and accumulation rates of the 124 up-regulated proteins. Accumulation rates ranged over 3 orders of magnitude, from ∼100 to 100,000 proteins⋅cell−1⋅h−1. The rate was independent of initial protein abundance and inversely correlated with time to induction (Rs = −0.60; Fig. 2D). For proteins that increased in low MMS or MMS pulses, the time to induction was longer compared with high MMS, and accumulation rates were lower, showing that timing and rates are interdependent (SI Appendix, Fig. S25).
It is known from gene expression studies that mRNA levels are globally altered within 30 min after MMS exposure (SI Appendix, Fig. S24) (18). We tested whether mRNA induction times correlated with observed protein induction times but found that mRNA and protein induction times did not correlate ( ; Fig. 2D and SI Appendix, Fig. S24). This suggests that yeast cells optimize protein accumulation to temporally control the increase in protein abundance rather than timing transcript induction. A poor correlation was also observed between protein and mRNA fold changes in our dataset (SI Appendix, Fig. S23) and by Tkach et al. (6), but a similar comparison of protein and mRNA levels during a diauxic shift showed better correlations between fold change and timing (16). Posttranscriptional mechanisms therefore seem to play a significant role in determining protein induction timing and abundance levels in response to MMS. An additional confounding factor may be the fact that MMS arrests cells, which may amplify differences between mRNA and protein. Protein levels therefore may correspond well to mRNA levels in steady-state growth but do so poorly during transitions.
Protein Localization Changes.
We determined the extent and dynamics of protein relocation events upon MMS treatment. On the basis of a manual analysis, and confirmed quantitatively using our computational approach, we identified 118 proteins that change localization (Fig. 3), of which 81 were not identified in the global analysis performed by Tkach et al. (6) (SI Appendix, Fig. S43). We quantitated the coordinated transition from the nucleus to the cytoplasm of Mcm2p, Mcm4p, Mcm6p, and Mcm7p. The minichromosome maintenance proteins form a complex, and synchronous transitions occurred over a range of 115–135 min after MMS, exemplifying the accuracy of our temporal analysis (SI Appendix, Fig. S35).
Fig. 3.
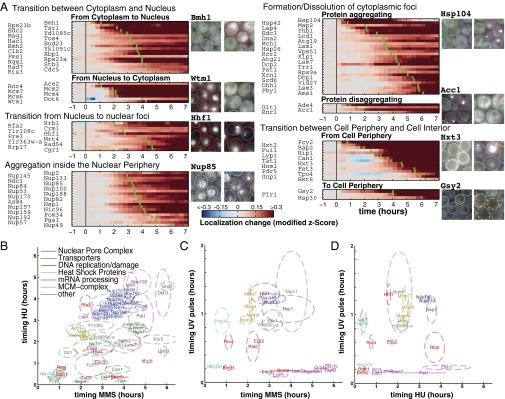
(A) Localization change for all proteins that relocated after MMS treatment. For each heatmap, proteins were ranked by their timing, as shown by the green bar. Micrographs show examples for each class. (B–D) Timing comparison of protein relocation in the various stresses. The protein labels indicate the mean time of change, and dashed circles show the error (±SD).
The 111 relocating proteins could be grouped into five major transition classes: transitions between cytoplasm and nucleus (28 proteins), transitions from the nucleus to nuclear foci (11 proteins), nuclear periphery aggregations (21 proteins), formation or dissolution of cytoplasmic foci (33 proteins), and transitions between the cell interior and the cell membrane (18 proteins) (Fig. 3A). Predominantly, proteins shuttled between two locations. Exceptions to this rule were rare. One example was Rnr4, which could localize to three distinct structures, including the nucleus, cytoplasm, and to a lesser degree puncta.
The group of 33 proteins forming cytoplasmic protein aggregates was functionally diverse and included enzymes, heat shock proteins, protein transporters, and uncharacterized proteins. The largest subclass consisted of P-body components (Edc3, Lsm1, Pby1, Xrn1, Pat1, Lsm7, Dcp2, Dcp1, Scd6, Dhh1, and Lsm3). P-bodies are cytoplasmic mRNA processing bodies (19), but it is unclear whether P-bodies degrade mRNA, serve as sites for mRNA storage, or both (20, 21). P-bodies have been observed to form in response to a number of cellular stresses, primarily upon nutrient starvation, and have been indirectly implicated with the DNA damage response (22) and more recently in response to HU but not MMS (6). P-bodies were observed in Candida albicans upon various stresses, including UV irradiation (23). A recent investigation in S. cerevisiae observed formation of cytoplasmic foci upon UV irradiation but identified these as a new class of UV-induced granules (24). To assess whether P-body formation was specific to DNA damage and not due to general stress induced by MMS or HU exposure, we tested whether P-bodies formed in response to UV irradiation. We found that P-bodies formed rapidly in response to UV irradiation, which was in stark contrast to the delayed formation in response to MMS and HU (Fig. 3 B–D and SI Appendix, Figs. S36–40). Furthermore, all major P-body components formed cytoplasmic foci synchronously within 9–14 min after UV irradiation. In response to HU, MMS, and hyperosmotic shock, P-body components accumulated in cytoplasmic foci asynchronously over an extended time-period (1–6 h). The rapid and strong response to UV irradiation suggests that P-bodies may form in response to mRNA damage. P-bodies could thus be involved in mRNA repair, sequestration, or degradation of damaged mRNA.
Recent large-scale studies of protein relocalization upon various stresses acquired single time-point measurement at 2 h for MMS and HU (6), at 1 h for H2O2, 3 h for DTT, and 15 h for nitrogen starvation (7). Unlike those measurements, our microchemostat array returned the precise temporal evolution of protein localization changes over a 6-h period (Fig. 3 B–D). We observed that protein relocalization events occur over the entire 6-h observation period in all perturbations tested, indicating that single time-point measurements can miss significant components of a response. Although many proteins change localization in response to MMS and HU, their timing can be notably different (Fig. 3B). Furthermore, in some conditions such as hyperosmotic shock and pulsed stresses, protein localization changes are often transient (SI Appendix, Figs. S38–S40), making it difficult or impossible for a single time-point measurement to capture all protein localization changes.
Generation and Analysis of Gene Deletion-GFP Strains.
Synthetic genetic array analysis is a powerful approach to map genetic interactions. Here we combined gene deletions with GFP reporter strains to identify genes that impact either protein abundance or localization phenotypes. We generated ∼560 deletion-GFP strains by crossing 40 strains from the nonessential gene deletion collection into 14 GFP reporter strains including six P-body components and Rnr4. We imaged all deletion-GFP strains in quadruplicate in response to UV pulses to assess whether any of the deletions impacted P-body formation or Rnr4 protein abundance or localization. Those strains for which we observed phenotypes were individually validated using five PCRs, verifying the absence of the wild-type allele and the presence of the kanMX cassette.
Size and Growth Phenotypes.
We first assessed whether any of the deletion strains exhibited either a size or growth defect (Fig. 4A). Most deletion strains were normal in size, both before and after UV irradiation, whereas a number of strains were abnormal even in standard growth conditions. Rad55Δ, rtt101Δ, and mms1Δ were large, both before and after UV irradiation, whereas bmh1Δ, mrt4Δ, and rai1Δ were considerably smaller.
Fig. 4.

(A) Median of strain size and cell growth of deletion-GFP strains. (B) Punctate formation for six P-body strains in various deletion backgrounds. (C) Changes in abundance and nuclear localization of Rnr4 as a result of gene deletions.
As expected, rad9Δ and rad55Δ exhibited the most significant growth defect upon low-dose UV irradiation (6 J/m2, 18 J/m2, and 36 J/m2 per pulse, respectively) (Fig. 4A). Rad9Δ failed to arrest after the first UV pulse, in concordance with its known function (25). By the second UV pulse rad9Δ strains accumulated enough damage, leading to cell death. Rad55Δ on the other hand arrested after the first UV pulse but also failed to repair accumulated damage, leading to cell death after the second pulse. Pat1Δ also exhibited a major growth defect upon UV irradiation. Both pat1Δ and lsm1Δ were recently shown to be growth defective upon a 30 J/m2 or higher UV dose (26) and 0.2 M HU (6). Scd6Δ cells, on the other hand, had no apparent growth defect upon low doses (6–36 J/m2) of UV irradiation and were also found to be insensitive to 0.1 M HU (6). In addition to these three deletions, rtt101Δ and mms1Δ also exhibited growth defects. We could thus establish that the microchemostat platform is capable of quantifying size and growth phenotypes, in addition to measuring protein abundance and localization.
P-Body Regulation.
To identify genes affecting UV-dependent P-body formation, we analyzed punctate formation of six P-body GFP strains (Scd6, Dcp1, Lsm1, Pat1, Edc3, and Xrn1). We could identify deletions that led to either a significant increase or decrease in P-body formation, because most deletions had no apparent effect on P-body formation (Fig. 4B). Scd6Δ inhibited accumulation of Edc3, Xrn1, Lsm1, and Dcp1 in cytolasmic foci, whereas pat1Δ affected foci formation of Edc3 and Xrn1. These dependencies are in concordance with current knowledge of P-body assembly but had not previously been characterized in UV-dependent P-body formation (21).
Rad9Δ led to sustained P-body formation of Dcp1, Edc3, Lsm1, Pat1, Scd6, and Xrn1. This finding seems to be in agreement with a recent observation that a mec1Δ tel1Δ deletion led to P-body formation even under normal growth conditions (6), but we cannot exclude the possibility that the growth defect of the rad9Δ deletion is the cause of sustained P-body formation. Nonetheless, the rad9Δ deletion phenotype shows that information of a strain’s growth phenotype is important for interpreting changes in protein localization and that both measurements need to be combined when possible.
Rnr4 Regulation.
We measured the effect of the gene deletions on Rnr4 protein abundance and localization. Rnr4 is a ribonucleotide reductase regulatory subunit forming a functional heterodimer with Rnr2 (27). During normal cell growth Rnr4 is localized to the nucleus and partially relocates to the cytoplasm during S-phase. Upon DNA damage Rnr4 is relocated to the cytoplasm, and its abundance increases, leading to an overall increase in dNTP levels (28). Increased dNTP levels in turn improve survival in response to DNA damage while increasing mutation rate (29). Wtm1 was previously identified as an anchor required for nuclear localization of Rnr4 (30), which we also observed in our dataset, because deletion of WTM1 led to decreased nuclear localization of Rnr4 (Fig. 4C). In addition to wtm1Δ, tsa1Δ, and rtt101Δ also led to a decreased nuclear localization of Rnr4. Deletion of TSA1 was recently shown to lead to genomic instability, induction of RNR1 and RNR3, and increased dNTP levels (31). In our experiments tsa1Δ did not lead to an appreciable abundance increase of Rnr4 but did affect its nuclear localization, shifting Rnr4 into the cytoplasm. Our data suggest that this change in localization contributes to elevated dNTP levels. Rtt101 was recently shown to form a complex with Mms1 and Crt10 (a transcriptional regulator of RNR2 and RNR3) (32), connecting DNA repair with rRNA quality control (33). Like tsa1Δ, rtt101Δ also led to decreased nuclear localization of Rnr4. We therefore were able to identify two components that impact Rnr4 nuclear localization, which is also disrupted in cells lacking Tsa1 and Rtt101.
Three deletions gave rise to increased nuclear retention of Rnr4: rad9Δ, rai1Δ, and nam7Δ. Strikingly, two of these gene deletions are involved in mRNA processing (Nam7, Rai1). Dysfunctional mRNA decay/degradation therefore seems to lead to increased Rnr4 nuclear retention and in some case also to decreased Rnr4 abundance (nam7Δ), indicative of a feedback mechanism between mRNA degradation, NTP/dNTP pools, and Rnr4 activity.
Discussion
We developed a microfluidic approach enabling the parallel interrogation of thousands of yeast strains with single-cell resolution under controlled environmental conditions. We also developed a comprehensive image processing pipeline necessary for the quantitative and unbiased analysis of protein abundance and localization in tens of thousands of time-lapse movies. In this large-scale survey we identified proteins that change abundance or localization in response to MMS and investigated a subset of 576 strains in response to five additional stress conditions, in which we observed that P-body formation was both rapid and synchronous in response to UV irradiation. This was in stark contrast to P-body formation in response to HU- and MMS-induced stress, in which P-body components assembled late and asynchronously. To further characterize P-body and Rnr4 regulation upon UV irradiation, we created ∼560 deletion-GFP strains and simultaneously quantitated size and growth defects, together with temporal abundance and localization changes of GFP tagged protein reporters. We show that Scd6 and Pat1 are regulators of P-body formation in response to UV irradiation. We also identified four proteins (Tsa1, Rtt101, Rai1, and Nam7) that affect nuclear localization of Rnr4. Deletions of Rai1 and Nam7 led to increased nuclear localization of Rnr4, establishing a link between mRNA processing and Rnr4 activity. These results show that the platform, in conjunction with gene deletions, is highly effective at discovering previously unknown regulators that affect protein abundance and/or localization. Finally, because the platform returns information on cell sizes and growth rates, it also supersedes the classic spot assay commonly used in yeast genetics.
The ability to measure single-cell phenotypes has become of increasing importance in microbiology, systems, and synthetic biology. Thus far, such analyses have been restricted to the interrogation of a few strains or clones at a time. However, a clear need exists for high-content imaging of gene knockout and GFP-tagged libraries in microbiology and systems biology, and for the in vivo characterization of part, component, and device libraries in synthetic biology. The fusion of engineered cellular systems, microfluidic, and optical hardware as demonstrated here may in the future allow the deployment of large-scale sensor arrays or integrated biohardware for applications in diagnostics and environmental monitoring. In summary, massively parallel time-lapse microscopy of microbial cultures provides a window into cellular processes inaccessible by current large-scale methods and will contribute to a systems-level description of molecular dynamics occurring on the single-cell level.
Supplementary Material
Acknowledgments
We thank the Center of Micronanotechnology staff at Ecole Polytechnique Fédérale de Lausanne (EPFL) for its support on lithography matters, and M. Geertz, J. B. Nobs, L. M. Fidalgo, and N. Molina for their input on technical issues and data analysis. This work was supported by SystemsX.ch Grant DynamiX-RTD (2008/005) and EPFL.
Footnotes
The authors declare no conflict of interest.
This article is a PNAS Direct Submission.
Data deposition: All data is available for viewing and download on our laboratory server at http://cellbase.epfl.ch.
This article contains supporting information online at www.pnas.org/lookup/suppl/doi:10.1073/pnas.1308265110/-/DCSupplemental.
References
- 1.Giepmans BN, Adams SR, Ellisman MH, Tsien RY. The fluorescent toolbox for assessing protein location and function. Science. 2006;312(5771):217–224. doi: 10.1126/science.1124618. [DOI] [PubMed] [Google Scholar]
- 2.Cohen AA, et al. Dynamic proteomics of individual cancer cells in response to a drug. Science. 2008;322(5907):1511–1516. doi: 10.1126/science.1160165. [DOI] [PubMed] [Google Scholar]
- 3.Neumann B, et al. Phenotypic profiling of the human genome by time-lapse microscopy reveals cell division genes. Nature. 2010;464(7289):721–727. doi: 10.1038/nature08869. [DOI] [PMC free article] [PubMed] [Google Scholar]
- 4.Newman JR, et al. Single-cell proteomic analysis of S. cerevisiae reveals the architecture of biological noise. Nature. 2006;441(7095):840–846. doi: 10.1038/nature04785. [DOI] [PubMed] [Google Scholar]
- 5.Huh WK, et al. Global analysis of protein localization in budding yeast. Nature. 2003;425(6959):686–691. doi: 10.1038/nature02026. [DOI] [PubMed] [Google Scholar]
- 6.Tkach JMJ, et al. Dissecting DNA damage response pathways by analysing protein localization and abundance changes during DNA replication stress. Nat Cell Biol. 2012;14(9):966–976. doi: 10.1038/ncb2549. [DOI] [PMC free article] [PubMed] [Google Scholar]
- 7.Breker M, Gymrek M, Schuldiner M. A novel single-cell screening platform reveals proteome plasticity during yeast stress responses. J Cell Biol. 2013;200(6):839–850. doi: 10.1083/jcb.201301120. [DOI] [PMC free article] [PubMed] [Google Scholar]
- 8.Narayanaswamy R, et al. Widespread reorganization of metabolic enzymes into reversible assemblies upon nutrient starvation. Proc Natl Acad Sci USA. 2009;106(25):10147–10152. doi: 10.1073/pnas.0812771106. [DOI] [PMC free article] [PubMed] [Google Scholar]
- 9.Taylor RJ, et al. Dynamic analysis of MAPK signaling using a high-throughput microfluidic single-cell imaging platform. Proc Natl Acad Sci USA. 2009;106(10):3758–3763. doi: 10.1073/pnas.0813416106. [DOI] [PMC free article] [PubMed] [Google Scholar]
- 10.Bennett MR, Hasty J. Microfluidic devices for measuring gene network dynamics in single cells. Nat Rev Genet. 2009;10(9):628–638. doi: 10.1038/nrg2625. [DOI] [PMC free article] [PubMed] [Google Scholar]
- 11.Bennett MR, et al. Metabolic gene regulation in a dynamically changing environment. Nature. 2008;454(7208):1119–1122. doi: 10.1038/nature07211. [DOI] [PMC free article] [PubMed] [Google Scholar]
- 12.Prindle AA, et al. A sensing array of radically coupled genetic ‘biopixels’. Nature. 2012;481(7379):39–44. doi: 10.1038/nature10722. [DOI] [PMC free article] [PubMed] [Google Scholar]
- 13.Bar-Even A, et al. Noise in protein expression scales with natural protein abundance. Nat Genet. 2006;38(6):636–643. doi: 10.1038/ng1807. [DOI] [PubMed] [Google Scholar]
- 14.Taniguchi Y, et al. Quantifying E. coli proteome and transcriptome with single-molecule sensitivity in single cells. Science. 2010;329(5991):533–538. doi: 10.1126/science.1188308. [DOI] [PMC free article] [PubMed] [Google Scholar]
- 15.Ghaemmaghami S, et al. Global analysis of protein expression in yeast. Nature. 2003;425(6959):737–741. doi: 10.1038/nature02046. [DOI] [PubMed] [Google Scholar]
- 16.Picotti P, Bodenmiller B, Mueller LN, Domon B, Aebersold R. Full dynamic range proteome analysis of S. cerevisiae by targeted proteomics. Cell. 2009;138(4):795–806. doi: 10.1016/j.cell.2009.05.051. [DOI] [PMC free article] [PubMed] [Google Scholar]
- 17.Lee MV, et al. A dynamic model of proteome changes reveals new roles for transcript alteration in yeast. Mol Syst Biol. 2011;7:514. doi: 10.1038/msb.2011.48. [DOI] [PMC free article] [PubMed] [Google Scholar]
- 18.Gasch AP, et al. Genomic expression responses to DNA-damaging agents and the regulatory role of the yeast ATR homolog Mec1p. Mol Biol Cell. 2001;12(10):2987–3003. doi: 10.1091/mbc.12.10.2987. [DOI] [PMC free article] [PubMed] [Google Scholar]
- 19.Sheth U, Parker R. Decapping and decay of messenger RNA occur in cytoplasmic processing bodies. Science. 2003;300(5620):805–808. doi: 10.1126/science.1082320. [DOI] [PMC free article] [PubMed] [Google Scholar]
- 20.Parker R, Sheth U. P bodies and the control of mRNA translation and degradation. Mol Cell. 2007;25(5):635–646. doi: 10.1016/j.molcel.2007.02.011. [DOI] [PubMed] [Google Scholar]
- 21.Parker RR. RNA degradation in Saccharomyces cerevisae. Genetics. 2012;191(3):671–702. doi: 10.1534/genetics.111.137265. [DOI] [PMC free article] [PubMed] [Google Scholar]
- 22.Bergkessel M, Reese JC. An essential role for the Saccharomyces cerevisiae DEAD-box helicase DHH1 in G1/S DNA-damage checkpoint recovery. Genetics. 2004;167(1):21–33. doi: 10.1534/genetics.167.1.21. [DOI] [PMC free article] [PubMed] [Google Scholar]
- 23.Jung J-HJ, Kim JJ. Accumulation of P-bodies in Candida albicans under different stress and filamentous growth conditions. Fungal Genet Biol. 2011;48(12):1116–1123. doi: 10.1016/j.fgb.2011.10.003. [DOI] [PubMed] [Google Scholar]
- 24.Gaillard H, Aguilera A. A novel class of mRNA-containing cytoplasmic granules are produced in response to UV-irradiation. Mol Biol Cell. 2008;19(11):4980–4992. doi: 10.1091/mbc.E08-02-0193. [DOI] [PMC free article] [PubMed] [Google Scholar]
- 25.Weinert TA, Hartwell LH. The RAD9 gene controls the cell cycle response to DNA damage in Saccharomyces cerevisiae. Science. 1988;241(4863):317–322. doi: 10.1126/science.3291120. [DOI] [PubMed] [Google Scholar]
- 26.Spicakova T, McCann K, Brown JM. A role for Lsmlp in response to ultraviolet-radiation damage in Saccharomyces cerevisiae. Radiat Res. 2008;170(4):411–421. doi: 10.1667/rr1477.1. [DOI] [PMC free article] [PubMed] [Google Scholar]
- 27.Sommerhalter MM, et al. Structures of the yeast ribonucleotide reductase Rnr2 and Rnr4 homodimers. Biochemistry. 2004;43(24):7736–7742. doi: 10.1021/bi049510m. [DOI] [PubMed] [Google Scholar]
- 28.Yao R, et al. Subcellular localization of yeast ribonucleotide reductase regulated by the DNA replication and damage checkpoint pathways. Proc Natl Acad Sci USA. 2003;100(11):6628–6633. doi: 10.1073/pnas.1131932100. [DOI] [PMC free article] [PubMed] [Google Scholar]
- 29.Chabes A, Stillman B. Constitutively high dNTP concentration inhibits cell cycle progression and the DNA damage checkpoint in yeast Saccharomyces cerevisiae. Proc Natl Acad Sci USA. 2007;104(4):1183–1188. doi: 10.1073/pnas.0610585104. [DOI] [PMC free article] [PubMed] [Google Scholar]
- 30.Lee YD, Elledge SJ. Control of ribonucleotide reductase localization through an anchoring mechanism involving Wtm1. Genes Dev. 2006;20:334–344. doi: 10.1101/gad.1380506. [DOI] [PMC free article] [PubMed] [Google Scholar]
- 31.Tang HMV, Siu KL, Wong CM, Jin DY. Loss of yeast peroxiredoxin Tsa1p induces genome instability through activation of the DNA damage checkpoint and elevation of dNTP levels. PLoS Genet. 2009;5(10):e1000697. doi: 10.1371/journal.pgen.1000697. [DOI] [PMC free article] [PubMed] [Google Scholar]
- 32.Zaidi IW, et al. Rtt101 and Mms1 in budding yeast form a CUL4(DDB1)-like ubiquitin ligase that promotes replication through damaged DNA. EMBO Rep. 2008;9(10):1034–1040. doi: 10.1038/embor.2008.155. [DOI] [PMC free article] [PubMed] [Google Scholar]
- 33.Fujii K, Kitabatake M, Sakata T, Miyata A, Ohno M. A role for ubiquitin in the clearance of nonfunctional rRNAs. Genes Dev. 2009;23(8):963–974. doi: 10.1101/gad.1775609. [DOI] [PMC free article] [PubMed] [Google Scholar]
Associated Data
This section collects any data citations, data availability statements, or supplementary materials included in this article.