

Significance
Here we have demonstrated that the l-cysteine/H2S pathway contributes to the increased thrombotic events associated with hyperhomocysteinemia. In particular, by using platelets harvested from hyperhomocysteinemic patients, H2S generated within the platelets in turn activates the arachidonic acid cascade by phosphorylating phospholipase A2. This cascade of events primes the platelet that becomes more responsive (reactive) to endogenous stimuli. Finally, our study also suggests that H2S could represent a unique biomarker in patients affected with hyperhomocystinemia to define the susceptibility of a cardiovascular event driven by platelets.
Keywords: H2S gaseous transmitter, urinary 11-dehydro-TXB2, cardiovascular events, DL-propargylglycine, aminooxyacetic acid
Abstract
Homocysteine is metabolized to methionine by the action of 5,10 methylenetetrahydrofolate reductase (MTHFR). Alternatively, by the transulfuration pathway, homocysteine is transformed to hydrogen sulphide (H2S), through multiple steps involving cystathionine β-synthase and cystathionine γ-lyase. Here we have evaluated the involvement of H2S in the thrombotic events associated with hyperhomocysteinemia. To this purpose we have used platelets harvested from healthy volunteers or patients newly diagnosed with hyperhomocysteinemia with a C677T polymorphism of the MTHFR gene (MTHFR++). NaHS (0.1–100 µM) or l-cysteine (0.1–100 µM) significantly increased platelet aggregation harvested from healthy volunteers induced by thrombin receptor activator peptide–6 amide (2 µM) in a concentration-dependent manner. This increase was significantly potentiated in platelets harvested from MTHFR++ carriers, and it was reversed by the inhibition of either cystathionine β-synthase or cystathionine γ-lyase. Similarly, in MTHFR++ carriers, the content of H2S was significantly higher in either platelets or plasma compared with healthy volunteers. Interestingly, thromboxane A2 production was markedly increased in response to both NaHS or l-cysteine in platelets of healthy volunteers. The inhibition of phospholipase A2, cyclooxygenase, or blockade of the thromboxane receptor markedly reduced the effects of H2S. Finally, phosphorylated–phospholipase A2 expression was significantly higher in MTHFR++ carriers compared with healthy volunteers. In conclusion, the H2S pathway is involved in the prothrombotic events occurring in hyperhomocysteinemic patients.
Hyperhomocysteinemia (HHcy) is a risk factor for neurovascular and cardiovascular disease associated with endothelial dysfunction and accelerated atherosclerosis (1–3). Many clinical and epidemiological studies have demonstrated a positive correlation between homocysteine (Hcy) plasma levels and cardiovascular disorders (4, 5), leading to the general conclusion that Hcy is a prothrombotic factor (6–8). However, the mechanism(s) through which elevated circulating levels of Hcy promote vascular disease and thrombosis is still unclear (9). Hcy has two primary fates: conversion through a reaction catalyzed by 5,10 methylenetetrahydrofolate reductase (MTHFR) into l-methionine or conversion to l-cysteine (l-Cys) via a transulfuration pathway (10, 11). The transulfuration pathway relies upon cystathionine β-synthase (CBS) to transform Hcy in cysthathionine, which is converted by cystathionine γ-lyase (CSE) into l-Cys. Thereafter, both enzymes convert l-Cys to generate hydrogen sulphide (H2S) (12, 13). H2S has been recognized as the third member of the family of gaseous transmitters (14), and it is present in human blood at micromolar concentrations (10–100 μM) (15). It rapidly travels through cell membranes without using any specific receptor/transporter or intracellular signaling proteins. CBS and CSE are differentially expressed in cardiovascular as well as in several other body districts (13). The physiological functions of H2S are mediated by a variety of molecular targets, including ion channels and signaling proteins (16–18). Alterations in H2S metabolism contribute to an array of cardiovascular disorders such as hypertension, atherosclerosis, heart failure, and diabetes (19). Nevertheless, the influence of H2S on platelet function and, in turn, on blood clotting has been poorly explored. We hypothesized that H2S could be involved in the thrombotic events associated with HHcy. To address this issue, we used human platelets harvested either from healthy volunteers or from patients with a C677T polymorphism of the MTHFR gene (MTHFR++) that is linked to HHcy (20–22).
Results
Hydrogen Sulphide Enhances Platelet Aggregation.
l-Cys and NaHS by themselves had no effects upon the platelet aggregation of human healthy volunteers at the concentrations tested (0.1—100 µM). Thrombin receptor activator peptide–6 (TRAP-6; 2μM) caused 51 ± 2% of platelet aggregation. Incubation with NaHS (0.1—100 µM) led to a marked concentration-dependent increase of aggregation induced by TRAP-6 2 µM (Fig. 1A; **P < 0.01 at 1 µM, ***P < 0.001 at 10 µM and 100 µM). Moreover, l-Cys (0.1–100 µM) but not d-Cys (0.1–100 µM) significantly potentiated human platelet aggregation induced by TRAP-6 in a concentration-dependent manner (Fig. 1A; °P < 0.05 at 10 µM, °°°P < 0.001 at 100 µM). Pre-treatment with DL-propargylglycine (PAG; 10 mM) or aminooxyacetic acid (AOAA; 1 mM) significantly reduced the effect of l-Cys upon platelet aggregation (Fig. 1B; °°P < 0.01 and **P < 0.001 for l-Cys 100 µM vs. PAG and AOAA, respectively). Thrombin and collagen were also tested as different aggregating agents. Thrombin (0.1 U/mL) and collagen (3 µg/mL) caused by themselves an aggregation of 62.67 ± 1.14% (n = 9) and 55.67 ± 1.45% (n = 5), respectively. l-Cys or NaHS at the highest dose used significantly increased the thrombin-induced aggregation to 69 ± 0.85% (n = 10) and 71.17 ± 1.74% (n = 6), respectively (***P < 0.001). Moreover, in the presence of collagen, l-Cys and NaHS significantly increased the aggregation to 76.67 ± 1.86% (n = 5) and 71.33 ± 1.86% (n = 5), respectively (**P < 0.01 and ***P < 0.001).
Fig. 1.

Effect of H2S on platelet aggregation induced by TRAP-6. (A) Both NaHS and l-Cys induced significant concentration-dependent increase in TRAP-6-induced platelet aggregation (**P < 0.01 for NaHS 1 µM, ***P < 0.001 for NaHS 10 µM and 100 µM; °P < 0.05 for l-Cys 10 µM, °°°P < 0.001 for l-Cys 100 µM). d-Cys did not affect platelet aggregation induced by TRAP-6. (B) The effect of l-Cys was significantly inhibited by both AOAA (1 mM; **P < 0.05) and PAG (10 mM; °°P < 0.05). Results are expressed as percent of maximal aggregation and calculated as mean ± SEM from 15 healthy volunteers. Data were analyzed using one-way ANOVA followed by Bonferroni post-test.
Hydrogen Sulphide Does Not Affect cAMP Levels.
As expected, prostacyclin (PGI2), the positive control, caused a significant increase in cAMP level (Fig. 2; °°°P < 0.001) in platelets from healthy volunteers compared with the untreated. In addition, l-Cys, d-Cys, and NaHS did not affect the PGI2-induced increase in cAMP. The values (in nM) were 32.45 ± 11.5, 24.95 ± 8.3, and 26.51 ± 12.4 for l-Cys, d-Cys, or NaHS, respectively. TRAP-6 (2 µM) significantly reduced the increase of cAMP induced by PGI2 treatment (**P < 0.01) and neither l-Cys (100 µM), d-Cys (100 µM), nor NaHS (100 µM) significantly modified this effect (Fig. 2).
Fig. 2.

Measurement of cAMP levels in human washed platelet. PGI2 caused a significant increase in cAMP level compared with vehicle (°°°P < 0.001) in platelets harvested from healthy volunteers. TRAP-6 (2 µM) significantly inhibited PGI2-induced cAMP production (**P < 0.01). NaHS (100 µM), l-Cys (100 µM), and d-Cys (100 µM) did not modify cAMP levels compared with TRAP-6. Results are expressed as nM and calculated as mean ± SEM from five healthy volunteers. Data were analyzed using one-way ANOVA followed by Bonferroni post-test.
Hydrogen Sulphide Does Not Affect ATP Release.
Neither l-Cys, d-Cys, nor NaHS altered the release of ATP from healthy volunteers’ washed platelets stimulated by TRAP-6 (2 µM; Fig. S1).
Hydrogen Sulphide Potentiates Platelet Aggregation in MTHFR++ Carriers.
The mean age of healthy volunteers and MTHFR++ carriers was 28 ± 3 y and 30 ± 8 y (P = 0.353), respectively. The Hcy plasma levels of healthy volunteers and MTHFR++ carriers were 9.3 ± 1.0 µM and 32.4 ± 1.7 µM, respectively (P < 0.001). TRAP-6–induced aggregation (2 μM) was similar in both healthy volunteers and MTHFR++ carriers (51 ± 2%, n = 15 and 55.6 ± 2%, n = 10). l-Cys treatment at all of the concentrations used caused a significant marked increase in the aggregation induced by TRAP-6 in MTHFR++ carriers compared with that in healthy volunteers (Fig. 3A; *P < 0.05 at 0.1 µM and 1µM, **P < 0.01 at 10 µM, ***P < 0.001 at 100 µM). PAG (10 mM) and AOAA (1 mM) significantly reversed the effect of l-Cys upon platelet aggregation in MTHFR++ carriers (Fig. 3B; *,°P < 0.05 at 1 µM and 10 µM). In particular, l-Cys 0.1 µM did not affect platelet aggregation in healthy volunteers, whereas in platelets from MTHFR++ carriers, the same concentration of l-Cys increased the aggregation significantly (from 55.6 ± 2 to 65 ± 2%; Fig. 3A; P < 0.05).
Fig. 3.

Effects of H2S upon platelet aggregation induced by TRAP-6 in MTHFR++ carriers. Platelet aggregation induced by TRAP 2 µM was 51% ± 2% in healthy volunteers and 55.6% ± 2% in MTHFR++ carriers and was not significantly different between the two groups. (A) Closed square line shows the l-Cys increase of TRAP-6–induced aggregation on platelets harvested from healthy volunteers. Open square line shows the l-Cys increase of TRAP-6–induced aggregation on platelets harvested from MTHFR++ carriers. The effect of l-Cys was significantly greater in MTHFR++ carriers at all of the concentrations used (*P < 0.05 for 0.1 µM and 1 µM, **P < 0.01 for 10 µM, ***P < 0.001 at 100 µM). (B) CSE inhibitor (PAG, 10 mM; °P < 0.05 for 1 μM and 10 μM, °° p<0.01 for 100 μM) or CBS inhibitor (AOAA, 1 mM; *P < 0.05 for 1 μM and 10 μM, *** P<0.001 for 100 μM) significantly reversed the effects of l-Cys in MTHFR++ carriers. Results are expressed as percent of maximal aggregation and calculated as mean ± SEM from 10 MTHFR++ carriers and from 15 healthy volunteers. Data were analyzed using one-way ANOVA followed by Bonferroni post-test.
Role of the Hydrogen Sulphide Pathway in MTHFR++ Carriers and Healthy Volunteers.
Western blot analysis demonstrated that both CBS (Fig. 4A) and CSE (Fig. 4B) were present in human platelets. Both enzymes were similarly expressed in MTHFR++ carriers and healthy volunteers. Human platelets also generated detectable amounts of H2S (Fig. 5A), and CBS and CSE efficiently converted l-Cys into H2S in both subject groups (Fig. 5A; §§§P < 0.001 and °°°P < 0.001, respectively). Both PAG (10 mM) and AOAA (1 mM) significantly inhibited the increases in H2S production induced by l-Cys in healthy volunteers (Fig. 5A; ###P < 0.001 and ##P < 0.01) and in MTHFR++ carriers (Fig. 5A; +P < 0.05 and +++P < 0.001). Both the basal and stimulated (incubated with l-Cys) productions of H2S were significantly enhanced in MTHFR++ carrier platelets compared with those from healthy volunteers (Fig. 5A; **P < 0.01). Similarly, H2S plasma levels were significantly higher in MTHFR++ carriers than in healthy volunteers (Fig. 5B; **P < 0.01).
Fig. 4.
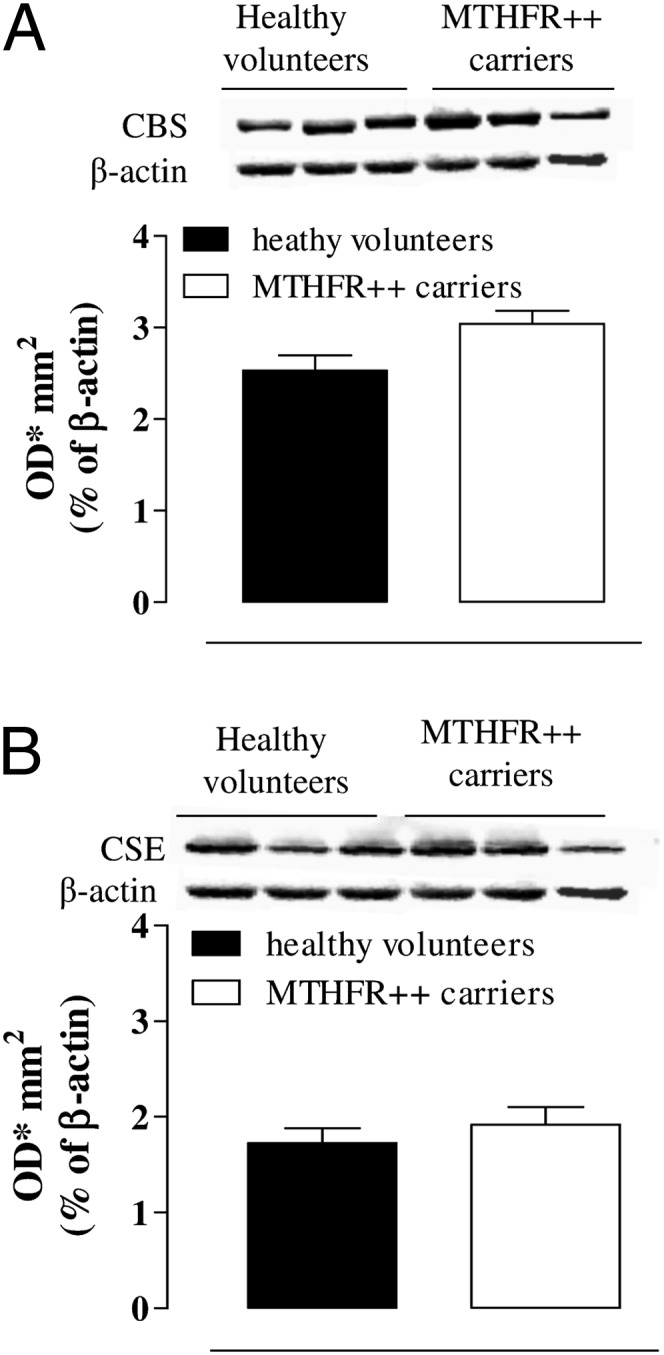
CBS and CSE expression in MTHFR++ carriers and healthy volunteers. CBS (A) and CSE (B) representative Western blot and related corresponding densitometric analysis. The CBS and CSE expression was not changed in MTHFR++ carriers compared with healthy volunteers. Data were normalized against β-actin as a housekeeping protein and are expressed as optical density (OD)/mm2 of mean ± SEM from three healthy volunteers and three MTHFR++ carriers. Data were analyzed by using Student t test.
Fig. 5.

H2S production in MTHFR++ carriers and healthy volunteers. (A) l-Cys caused a significant increase of H2S production in platelets harvested from healthy volunteers or MTHFR++ carriers compared with respective vehicle (°°°P < 0.001 and §§§P < 0.001). Both PAG (10 mM) and AOAA (1 mM) significantly inhibited the increase in H2S production induced by l-Cys in healthy volunteers (###P < 0.001 and ##P < 0.01) and in MTHFR++ carriers (+P < 0.05 and +++P < 0.001). MTHFR++ carriers produced a higher level of H2S compared with healthy volunteers both in basal (vehicle) or in stimulated (l-Cys) condition (**P < 0.01). Results are expressed as nmol/mg proteins per minute and calculated as mean ± SEM from six MTHFR++ carriers and nine healthy volunteers. Data were analyzed using one-way ANOVA followed by Bonferroni post-test. (B) H2S plasma level was higher in MTHFR++ carriers compared with healthy volunteers (**P < 0.01). Results are expressed as µM and calculated as mean ± SEM from four samples. Data were analyzed using Student t test.
Arachidonic Acid Cascade Is Involved in the Effects of Hydrogen Sulphide upon Human Platelets.
To investigate the involvement of the arachidonic acid pathway in the effects of H2S upon human platelets, we used a thromboxane receptor (TP) antagonist and inhibitors of cyclooxygenase (COX) and phosphorylated cytosolic PLA2 (p-cPLA2), respectively. [1S-[1α,2α(Z),3α,4α]]-7-[3-[[2-[(phenylamino)carbonyl]hydrazino]methyl]-7-oxabicyclo[2.2.1]hept-2-yl]-5-heptenoic acid (SQ 29548) (1 µM), a TP receptor antagonist; indometacin (INDO; 1 µM), a COX inhibitor; and AACOCF3 (1 µM), a cPLA2 inhibitor, significantly reduced the enhanced aggregation produced by l-Cys (Fig. 6A; *P < 0.05, **P < 0.01, ***P < 0.01). Similarly, SQ 29548 (1 µM), INDO (1 µM), and AACOCF3 (1 µM) significantly reduced the enhanced aggregation induced by NaHS (Fig. 6B; *P < 0.05, **P < 0.01, ***P < 0.01).
Fig. 6.

Involvement of the arachidonic acid cascade in H2S effects. (A) SQ 29548 (1 µM), a TP receptor antagonist; indomethacin (1 µM), a COX inhibitor; and AACOCF3 (1 µM), a cPLA2 inhibitor, significantly (*P < 0.05, **P < 0.01, ***P < 0.001) reduced the enhancing effects of l-Cys upon aggregation induced by TRAP-6 (2 µM) or (B) NaHS. Results are expressed as percent of maximal aggregation and calculated as mean ± SEM from five to eight healthy volunteers. Data were analyzed using one-way ANOVA followed by Bonferroni post-test.
Hydrogen Sulphide Increases Thromboxane B2 Levels.
Incubation with NaHS (100 µM) or l-Cys (100 µM) but not with d-Cys (100 µM) significantly enhanced TRAP-6 (2 µM)–stimulated production of thromboxane B2 (TxB2) by human washed platelets (Fig. 7; **P < 0.01). The effects of NaHS and l-Cys (Fig. 7) were markedly inhibited by both INDO (1 µM, °°°P < 0.001) and AACOCF3 (1 µM; ###P < 0.001). In addition, NaHS (100 µM) and l-Cys (100 µM) by themselves did not affect TxB2 production (Fig. 7).
Fig. 7.

The effect of H2S upon human platelet TXB2 levels. NaHS (100 µM), l-Cys (100 µM), but not d-Cys (100 µM) significantly increased the production of TXB2 stimulated by TRAP-6 (2 µM; **P < 0.01). Both INDO (1 µM, °°°P < 0.001) and AACOCF3 (1 µM, ###P < 0.001) markedly inhibited the effects of both NaHS and l-Cys. NaHS (100 µM) or l-Cys (100 µM) by itself did not affect TXB2 production. Results are expressed as ng/mL and calculated as mean ± SEM from 10 healthy volunteers. Data were analyzed using one-way ANOVA followed by Bonferroni posttest.
cPLA2 in Healthy Volunteers and MTHFR++ Carriers.
The expression of cPLA2 as well as p-cPLA2 in MTHFR++ carriers’ and in healthy volunteers’ washed platelets was evaluated. The p-cPLA2/PLA2 ratio was significantly increased in MTHFR++ carriers in comparison with healthy volunteers (Fig. 8; **P < 0.01).
Fig. 8.
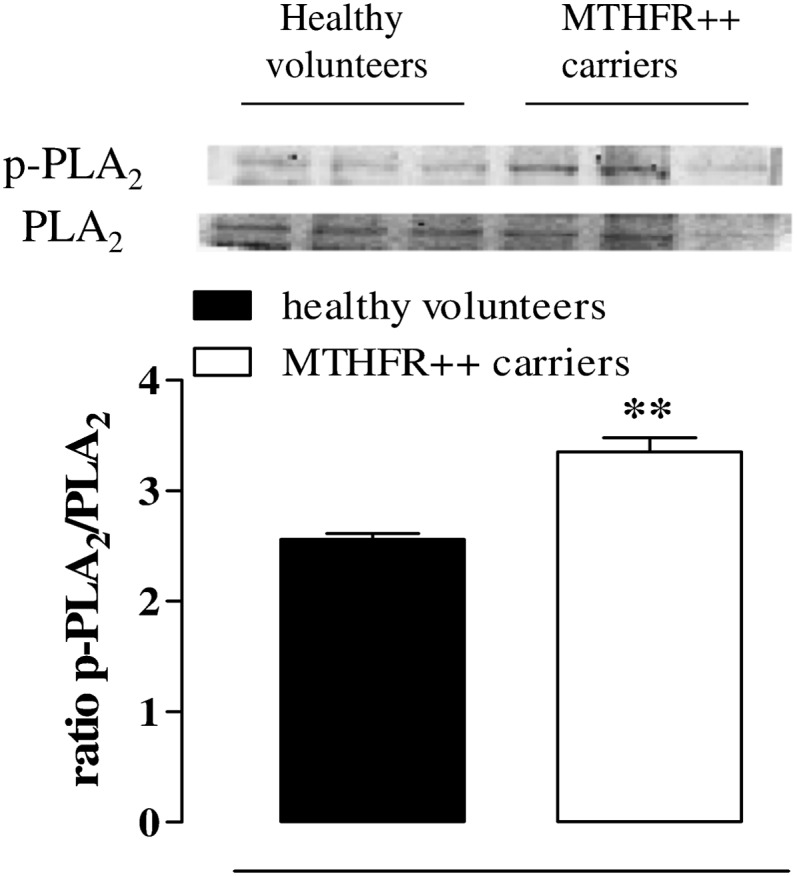
Changes in p-cPLA2 and cPLA2 expression in MTHFR++ carriers and healthy volunteers. The ratio of p-cPLA2/cPLA2 is increased in MTHFR++ carriers compared with healthy volunteers’ platelets (**P < 0.01). Data are expressed as ratio and calculated as mean± SEM from three different experiments.
Urinary 11-Dehydro-TxB2 in Healthy Volunteers and MTHFR++ Carriers.
Urinary 11-dehydro-TxB2 levels were, respectively, 639 ± 105 μmol/L and 292 ± 63 μmol/L for MTHFR++ carriers and healthy volunteers. MTHFR++ carriers showed higher urinary 11-dehydro-TXB2 levels than healthy volunteers (P < 0.05). Urinary 11-dehydro-TxB2 levels showed a significant and direct correlation with Hcy levels (r = 0.765, P < 0.001).
Discussion
Here we have demonstrated that human platelets can endogenously produce H2S. Indeed, human platelets express both CBS and CSE and do generate H2S. In fact, platelets efficiently convert l-Cys (the substrate) into H2S. Exposure of human platelets to an H2S donor (NaHS) or the substrate (l-Cys) did not, by itself, affect platelet aggregation in the range of concentrations we tested. It has been previously reported that NaHS inhibits human platelet aggregation (23), but this effect was obtained within a mM range (1–10 mM) well beyond those used in our experiments and those present in human blood (10–100 µM). However, NaHS at concentrations ranging between 0.1 µM and 100 µM significantly increased TRAP-6–induced platelet aggregation. Similarly, l-Cys (0.1–100 µM) but not d-Cys (0.1–100 µM) potentiated platelet aggregation in a concentration-dependent manner. This latter effect was significantly reduced by incubation with CBS or CSE inhibitors. Therefore, the l-Cys/H2S pathway has a functional role in platelets. The potentiating effect of NaHS or l-Cys did not involve either cAMP or ATP platelet secretion. These latter results also imply that the concentrations of NaHS, l-Cys, and d-Cys used were not toxic for platelets.
Building upon our in vitro findings using platelets from healthy volunteers, we hypothesized that H2S pathway could be relevant in the context of a clinical condition in which this pathway is disrupted. In humans, normal plasma Hcy levels range between 5 and 15 µM. In severe HHcy with associated homocysteinuria, because of a homozygous deficiency of CBS, plasma Hcy levels exceed 100 µM. This is a rare genetic disorder that is characterized by venous thromboembolism, premature atherosclerosis, and osteoporosis (24). There is also a condition associated with a mild/moderate elevation of plasma Hcy (i.e., 15–50 µM) that is not so uncommon, occurring in 5–7% of individuals. The most common genetic cause of mild HHcy is the expression of a MTHFR variant. In these patients there is an increased incidence of venous thrombosis and arterial atherothrombotic diseases, including myocardial infarction and stroke (25–27). To address our hypothesis, we have selected newly diagnosed patients from this latter group who are MTHFR++ carriers with higher levels of Hcy. In these patients, circulating platelets are chronically exposed to Hcy plasma levels over the physiological values. Nevertheless, platelets of MTHFR++ carriers expressed both CBS and CSE, as in healthy volunteer platelets. Therefore, these platelets can still metabolize Hcy to H2S through the combined action of CBS and CSE. TRAP-6–induced aggregation was similar in both groups. However, platelets harvested from MTHFR++ carriers incubated with growing concentrations of the substrate l-Cys displayed a significant potentiating effect of TRAP-6–induced aggregation compared with platelets harvested from healthy volunteers. Of particular interest is the finding that already at the concentration of 100 nM (10−7 M) there was a marked enhancement of the pro-aggregatory effect of l-Cys in platelets harvested from MTHFR++ carriers compared with healthy volunteers. The role played by CBS and CSE was confirmed by the finding that the l-Cys effect was reversed by treatment with either CBS or CSE inhibitors. These results imply that H2S generated by Hcy through the transulfuration pathway, within the platelets, contributes to platelet activation involved in the vascular events in MTHFR ++ carriers. In line with this hypothesis, analysis of the platelet content of H2S revealed a significant increase of H2S levels in MTHFR++ carriers compared with healthy volunteers. At the same time, in these patients there was also a significant increase in H2S plasma levels compared with healthy volunteers.
In HHcy patients, increased platelet activation has been associated with elevated production of tromboxane A2 (28–30). In line with these findings, in MTHFR++ carriers, we found that urine thromboxane metabolites were significantly higher than in healthy individuals. These clinical data further suggested a possible link between H2S and the eicosanoid pathway. To further address this issue, we operated a pharmacological modulation by using selective inhibitors. The pharmacological blockade of either cPLA2 or COX reduced both the NaHS and l-Cys potentiating effect in platelets harvested from healthy volunteers. Similarly, the selective TP receptor antagonist SQ 29548 abolished the potentiating effect displayed by either NaHS or l-Cys. Taken together, these data indicate that the arachidonic acid cascade acts as a downstream signal of the l-Cys/H2S pathway in platelets. In line with this hypothesis, it has been shown that H2S can activate PLA2, triggering the arachidonic acid cascade both in vivo and in vitro (17, 31). Because phosphorylation of PLA2 is an index of its activation, to follow up on this hypothesis, we measured the basal cPLA2 phosphorylation state in platelets of MTHFR++ carriers and healthy volunteers. The p-cPLA2/PLA2 ratio was significantly increased in MHTFR++ carrier platelets, suggesting that the arachidonic acid/PLA2/eicosanoid pathway is primed in these patients. In MTHFR++ carriers, higher levels of H2S can lead to an up-regulation of the PLA2-dependent eicosanoid pathway, leading to increased generation of thromboxane A2.
Despite the strong association between HHcy and thrombotic risk, the mechanisms underlying this prothrombotic state are still poorly understood (32). Our data suggest that in MTHFR++ carriers there is an increase in platelet activity dependent upon H2S generated within the platelet that boosts the arachidonic acid cascade. Therefore, in MTHFR++ carriers the activation of the l-Cys/H2S pathway within the platelets primes them, making platelets more responsive to endogenous stimuli that normally do not activate healthy platelets. This mechanism may explain how mild hyperhomocysteimnemia contributes to the development of premature coronary diseases and recurrent arterial and venous thrombosis in these patients.
Methods
Human Platelets.
Blood samples were collected from healthy volunteers or from newly diagnosed MTHFR++ carriers (21, 22). Both healthy volunteers and MTHFR++ carriers had not taken medications during the preceding 2 wk. The study on healthy volunteers was approved by the NHS St. Thomas Hospital Research Ethics Committee, and the study protocol concerning the MTHFR++ carriers versus healthy volunteers has been approved by the local Ethics Committee (Faculty of Medicine and Surgery, University of Naples Federico II, Naples, Italy). Studies conformed to the principles outlined in the Helsinki Declaration, and both healthy volunteers and MTHFR++ carriers were informed and gave their written consent to participate in the present study.
Washed Platelet Preparation.
Human blood was collected by venepuncture and mixed with trisodium citrate (3.8%, wt/vol; Sigma). Platelet-rich plasma (PRP) was obtained by centrifugation at 200 × g for 15 min at room temperature (25 °C). Washed platelets were prepared by a prostacyclin-based method (33). Briefly, PRP was centrifuged at 800 × g for 10 min in the presence of 0.2 µmol/L prostacyclin (Sigma) and 25 U/mL apyrase (Leo Laboratories). The platelet pellet was then suspended in calcium-free Tyrode’s solution (134 mmol/L NaCl, 20 mmol/L Hepes, 2.9 mmol/L KCl, 5 mmol/L glucose, 0.34 mmol/L Na2HPO4, 1 mg/mL BSA, and 1 mmol/L MgCl2, pH 7.4; Carlo Erba) containing 0.2 µmol/L prostacyclin. The suspension was centrifuged at 800 × g for 10 min, and washed platelets were suspended in calcium-free Tyrode’s solution and adjusted to about 3 × 10⁵ platelets per µl.
Platelet Aggregation.
Platelet aggregation was followed at 37 °C by light transmission aggregometry using a Platelet Aggregation Profile–8E (Bio/Data Horsham) as described by Born (34). Preliminarily, we have tested three different aggregating agents—thrombin (0.03–1 U/mL; Sigma), collagen (0.1–3 µg/mL; Sigma), and TRAP-6 (0.3–3 µM; Bachem). In our experimental condition, TRAP-6 was chosen, as it gave an optimal concentration–response curve. In particular, the concentration of TRAP-6 2 µM was selected because at this concentration it caused 52 ± 2% aggregation, allowing the evaluation of both potentiation or inhibition.
Platelet suspensions (3 × 10⁵ platelets per µl) were incubated at 37 °C with either NaHS, as a H2S donor (0.1–100 µM, for 5 min; Sigma), or l-Cys, as a substrate (0.1–100 µM, for 10 min; Sigma) under stirring conditions (1,200 rpm) before addition of TRAP-6 (2 μM) or vehicle. d-Cys (Sigma) was used as a negative control. To investigate the mechanism of H2S signaling, we performed experiments using AOAA (1 mM, Sigma) and PAG (10 mM; Sigma) inhibitors of CBS and CSE, respectively, incubated for 15 min before the addition of l-Cys. In addition, to evaluate the involvement of thePLA2/arachidonic acid pathway, human washed platelets were treated with either SQ 29548 (1 µM; Cayman), a TP antagonist, or INDO (1 µM; Sigma), a COX inhibitor, or AACOCF3 (1 µM; Tocris), a cPLA2 inhibitor, before addition of NaHS or l-Cys and then stimulation with TRAP-6. Light transmission aggregometry was followed for 10 min, after which the percentage of aggregation was calculated by the software (Aggregolink-810-CA; Mascia Brunelli) using Tyrode’s buffer as blank. All of the drugs tested were added directly to platelets to assess whether they, by themselves, caused platelet aggregation. Results were expressed as percent of aggregation and calculated as mean ± SEM. Data were analyzed using one-way ANOVA followed by Bonferroni post-test. A P value <0.05 was considered significant.
cAMP Measurement.
Human washed platelets (3 × 10⁵ platelets per µl) were treated with NaHS (100 µM), l-Cys (100 µM), d-Cys (100 µM), or vehicle, in the presence of prostacyclin (100 nM), to elevate basal cAMP levels to a detectable range and then were stimulated with TRAP-6 (2 µM). The reaction was stopped after 4 min by adding Triton X-100 (0.625%), isobutylmethylxanthine (0.5 mM), and KF (0.5 M). The cAMP content of platelet lysates was determined by a homogenous time-resolved fluorescence-based immunoassay (Cisbio). Results were expressed as nM concentration in the lysate and calculated as mean ± SEM from five healthy volunteers. Data were analyzed by using two-way ANOVA followed by Bonferroni post-test. A P value <0.05 was considered significant.
Thromboxane Measurement.
At the end of aggregation experiments using NaHS, l-Cys, or d-Cys (all 100 µM), cyclo-oxygease activity was halted by addition of diclofenac (1 mM). Platelet suspensions were then removed from aggregometer cuvettes and the supernatant separated by centrifugation. The levels of TxA2 production were determined by measurement of its stable breakdown product, TxB2, in the supernatant using a homogenous time-resolved in-house developed fluorescence-based immunoassay (35). Results were expressed as ng/mL and calculated as mean ± SEM from 10 healthy volunteers. Data were analyzed by one-way ANOVA followed by Bonferroni post-test. A P value <0.05 was considered significant.
ATP Luminometric Assay.
A modified luminometric assay was used to determine both total ATP and ADP release (36). Briefly, 100 µL human washed platelet suspensions (3 × 10⁵ platelets per µl), incubated with either NaHS or l-Cys, or as control, d-Cys (100 µM), for 5 or 10 min, respectively, or vehicle were placed in each well of a white clear-bottomed 96-well plate containing 10 µL of TRAP-6 (0.1—300 µM) and placed into a plate reader maintained at 37 °C and read at 595 nm every 15 s for 5 min, with vigorous shaking between readings. After 5 min, the plate was removed, and 50 µL of substrate containing phosphocreatine (1.5 mM; Sigma), creatine phosphokinase (3,000 U/mL; Sigma), and chrono-lume reagent (1:5 vol/vol; LabMedics) was added to each well. The plate was shaken at 350 rpm for 2 min at 37 °C and then measured by Mithras LB940 multimode plate reader (Berthold Technologies). The luminescence of 20 nmol ATP (LabMedics) in Tyrode’s buffer was used as a standard to calculate the total ATP/ADP released. Results were expressed as nmol per well and calculated as mean ± SEM from six healthy volunteers. Data were analyzed by one-way ANOVA followed by Dunnet post-test. A P value <0.05 was considered significant.
Western Blot Analysis.
Human washed platelets (from healthy volunteers or MTHFR++ carriers) were homogenized in modified radioimmunoprecipitation assay (RIPA) buffer (Tris⋅HCl 50 mM, pH 7.4, Triton 1%, sodium deoxycholate 0.25%, NaCl 150 mM, EDTA 1 mM, phenylmethylsulphonyl fluoride 1 mM, aprotinin 10 mg/mL, leupeptin 20 mM, NaF 1 mM, sodium orthovanadate 1 mM). Protein concentration was determined by Bradford assay using BSA as the standard (Bio-Rad Laboratories). Denatured proteins (30 µg) were separated on 10% SDS polyacrylamide gels and transferred to a polyvinylidene fluoride membrane. The membrane was blocked by incubation in PBS containing 0.1% vol/vol Tween 20 and 5% nonfat dried milk for 1 h at room temperature and then incubated with rabbit polyclonal antibody for CBS (1:1,000; Santa Cruz Biotechnology, Inc.) and with mouse monoclonal antibody for CSE (1:1,000; Novus Biologicals) overnight at 4 °C. The membrane was extensively washed in PBS containing 0.1% vol/vol Tween-20 and then incubated for 2 h at 4 °C with anti-rabbit or anti-mouse IgG-horseradish peroxidase conjugate (1:5,000). Additionally, to evaluate the involvement of PLA2, the same membrane was incubated with rabbit polyclonal antibody for cPLA2 (1:1,000; Cell Signaling) and with rabbit polyclonal antibody for phospho-cPLA2Ser505 (Cell Signaling). The filter was then washed, and the immunoreactive bands were visualized using the enhanced chemiluminescence substrate (Amersham Pharmacia Biotech) and thereafter densitometrically analyzed with a model GS-800 imaging densitometer (Biorad). Data were calculated as mean ± SEM of three samples from MTHFR++ carriers and healthy volunteers. Data were analyzed by Student t test. A P value <0.05 was considered significant.
Measurement of H2S.
H2S production was measured in human washed platelets according to Stipanuk and Beck (1982), with some modifications (37). Briefly, platelets were lysed in an appropriate buffer (potassium phosphate buffer 100 mM, pH 7.4, sodium orthovanadate 10 mM, and proteases inhibitors). Protein concentration was determined by using Bradford assay (Bio-Rad Laboratories). Homogenates were added to a reaction mixture containing pyridoxal-5′-phosphate (2 mM), l-Cys (10 mM), d-Cys (10 mM), or vehicle. The reaction was performed in sealed Eppendorf tubes and initiated by transferring tubes from ice to a water bath at 37 °C for 30 min. Next, trichloroacetic acid solution (10% wt/vol) was added to each sample followed by zinc acetate (1% wt/vol). Subsequently, N,N-dimethyl-p-phenylendiamine sulfate (DPD; 20 mM) in HCl (7.2 M) and FeCl3 (30 mM) in HCl (1.2 M) were added, and optical absorbance of the solutions was measured after 20 min at a wavelength of 650 nm. In another series of experiments, PAG (10 mM) CSE inhibitor or AOAA (1 mM) CBS inhibitor was added 5 min before the addition of l-Cys. All samples were assayed in duplicate, and H2S concentrations were calculated against a calibration curve of NaHS (3–250 μM). Plasma determination of H2S was performed as follows: 200 µL of plasma were added in Eppendorf tubes containing trichloroacetic acid (10%, 300 µL), and after centrifugation (5000 × g for 10 min, at 4 °C) zinc acetate (1% wt/vol, 150 µL) was added to each samples. Subsequently, DPD (20 mM, 100 µL, in 7.2 M HCl) and FeCl3 (30 mM, 133 µL, in 1.2 M HCl) were added to the reaction mixture, and H2S determination followed the same protocol described above. Results were expressed as nmol/mg proteins per min and calculated as mean ± SEM from six MTHFR++ carriers and nine healthy volunteers for platelet homogenates. Data were analyzed by one-way ANOVA followed by Bonferroni post-test. Plasma H2S results are expressed as µM concentration and were calculated as mean ± SEM of four samples of plasma from MTHFR++ carriers and healthy volunteers. Data were analyzed by Student t test. A P value <0.05 was considered significant.
Measurement of Urinary 11-Dehydro-TXB2.
Urinary 11-dehydro-TXB2 concentrations were measured by liquid chromatography–tandem mass spectrometry, using electrospray ionization in negative-ion mode (24). The detection limit of this method is 0.375 pg/μL, with a linear range of 0.78–25 pg/μL; the inter- and intraday variability was <5% for both metabolites. Results were calculated as mean ± SEM from six MTHFR++ carriers and six healthy volunteers. Data were analyzed by Student t test.
Supplementary Material
Footnotes
The authors declare no conflict of interest.
*This Direct Submission article had a prearranged editor.
This article contains supporting information online at www.pnas.org/lookup/suppl/doi:10.1073/pnas.1309049110/-/DCSupplemental.
References
- 1.Boushey CJ, Beresford SA, Omenn GS, Motulsky AG. A quantitative assessment of plasma homocysteine as a risk factor for vascular disease. Probable benefits of increasing folic acid intakes. JAMA. 1995;274(13):1049–1057. doi: 10.1001/jama.1995.03530130055028. [DOI] [PubMed] [Google Scholar]
- 2.Beard RS, Jr, Bearden SE. Vascular complications of cystathionine β-synthase deficiency: Future directions for homocysteine-to-hydrogen sulfide research. Am J Physiol Heart Circ Physiol. 2011;300(1):H13–H26. doi: 10.1152/ajpheart.00598.2010. [DOI] [PMC free article] [PubMed] [Google Scholar]
- 3.Austin RC, Lentz SR, Werstuck GH. Role of hyperhomocysteinemia in endothelial dysfunction and atherothrombotic disease. Cell Death Differ. 2004;11(Suppl 1):S56–S64. doi: 10.1038/sj.cdd.4401451. [DOI] [PubMed] [Google Scholar]
- 4.Towfighi A, Saver JL, Engelhardt R, Ovbiagele B. Factors associated with the steep increase in late-midlife stroke occurrence among US men. J Stroke Cerebrovasc Dis. 2008;17(4):165–168. doi: 10.1016/j.jstrokecerebrovasdis.2007.12.007. [DOI] [PMC free article] [PubMed] [Google Scholar]
- 5.Kawamoto R, Kajiwara T, Oka Y, Takagi Y. An association between plasma homocysteine concentrations and ischemic stroke in elderly Japanese. J Atheroscler Thromb. 2002;9(2):121–125. doi: 10.5551/jat.9.121. [DOI] [PubMed] [Google Scholar]
- 6.Lee R, Frenkel EP. Hyperhomocysteinemia and thrombosis. Hematol Oncol Clin North Am. 2003;17(1):85–102. doi: 10.1016/s0889-8588(02)00090-4. [DOI] [PubMed] [Google Scholar]
- 7.Fay WP. Homocysteine and thrombosis: Guilt by association? Blood. 2012;119(13):2977–2978. doi: 10.1182/blood-2012-01-401513. [DOI] [PubMed] [Google Scholar]
- 8.Leoncini G, Pascale R, Signorello MG. Effects of homocysteine on l-arginine transport and nitric oxide formation in human platelets. Eur J Clin Invest. 2003;33(8):713–719. doi: 10.1046/j.1365-2362.2003.01203.x. [DOI] [PubMed] [Google Scholar]
- 9.Undas A, Brozek J, Szczeklik A. Homocysteine and thrombosis: From basic science to clinical evidence. Thromb Haemost. 2005;94(5):907–915. doi: 10.1160/TH05-05-0313. [DOI] [PubMed] [Google Scholar]
- 10.Selhub J. Homocysteine metabolism. Annu Rev Nutr. 1999;19:217–246. doi: 10.1146/annurev.nutr.19.1.217. [DOI] [PubMed] [Google Scholar]
- 11.Davis SR, et al. Tracer-derived total and folate-dependent homocysteine remethylation and synthesis rates in humans indicate that serine is the main one-carbon donor. Am J Physiol Endocrinol Metab. 2004;286(2):E272–E279. doi: 10.1152/ajpendo.00351.2003. [DOI] [PubMed] [Google Scholar]
- 12.Loscalzo J. Homocysteine trials—Clear outcomes for complex reasons. N Engl J Med. 2006;354(15):1629–1632. doi: 10.1056/NEJMe068060. [DOI] [PubMed] [Google Scholar]
- 13.Kimura H. Hydrogen sulfide: Its production, release and functions. Amino Acids. 2011;41(1):113–121. doi: 10.1007/s00726-010-0510-x. [DOI] [PubMed] [Google Scholar]
- 14.Whitfield NL, Kreimier EL, Verdial FC, Skovgaard N, Olson KR. Reappraisal of H2S/sulfide concentration in vertebrate blood and its potential significance in ischemic preconditioning and vascular signaling. Am J Physiol Regul Integr Comp Physiol. 2008;294(6):R1930–R1937. doi: 10.1152/ajpregu.00025.2008. [DOI] [PubMed] [Google Scholar]
- 15.Jha S, Calvert JW, Duranski MR, Ramachandran A, Lefer DJ. Hydrogen sulfide attenuates hepatic ischemia-reperfusion injury: Role of antioxidant and antiapoptotic signaling. Am J Physiol Heart Circ Physiol. 2008;295(2):H801–H806. doi: 10.1152/ajpheart.00377.2008. [DOI] [PMC free article] [PubMed] [Google Scholar]
- 16.Tang G, Wu L, Wang R. Interaction of hydrogen sulfide with ion channels. Clin Exp Pharmacol Physiol. 2010;37(7):753–763. doi: 10.1111/j.1440-1681.2010.05351.x. [DOI] [PubMed] [Google Scholar]
- 17.d’Emmanuele di Villa Bianca R, et al. Hydrogen sulfide-induced dual vascular effect involves arachidonic acid cascade in rat mesenteric arterial bed. J Pharmacol Exp Ther. 2011;337(1):59–64. doi: 10.1124/jpet.110.176016. [DOI] [PubMed] [Google Scholar]
- 18.Bucci M, et al. Hydrogen sulfide is an endogenous inhibitor of phosphodiesterase activity. Arterioscler Thromb Vasc Biol. 2010;30(10):1998–2004. doi: 10.1161/ATVBAHA.110.209783. [DOI] [PubMed] [Google Scholar]
- 19.Predmore BL, Lefer DJ, Gojon G. Hydrogen sulfide in biochemistry and medicine. Antioxid Redox Signal. 2012;17(1):119–140. doi: 10.1089/ars.2012.4612. [DOI] [PMC free article] [PubMed] [Google Scholar]
- 20.Ramakrishnan S, Sulochana KN, Lakshmi S, Selvi R, Angayarkanni N. Biochemistry of homocysteine in health and diseases. Indian J Biochem Biophys. 2006;43(5):275–283. [PubMed] [Google Scholar]
- 21.de Franchis R, et al. Elevated total plasma homocysteine and 677C—>T mutation of the 5,10-methylenetetrahydrofolate reductase gene in thrombotic vascular disease. Am J Hum Genet. 1996;59(1):262–264. [PMC free article] [PubMed] [Google Scholar]
- 22.D’Angelo A, et al. The role of vitamin B12 in fasting hyperhomocysteinemia and its interaction with the homozygous C677T mutation of the methylenetetrahydrofolate reductase (MTHFR) gene. A case-control study of patients with early-onset thrombotic events. Thromb Haemost. 2000;83(4):563–570. [PubMed] [Google Scholar]
- 23.Zagli G, et al. Hydrogen sulfide inhibits human platelet aggregation. Eur J Pharmacol. 2007;559(1):65–68. doi: 10.1016/j.ejphar.2006.12.011. [DOI] [PubMed] [Google Scholar]
- 24.Di Minno MN, et al. Genotype-independent in vivo oxidative stress following a methionine loading test: Maximal platelet activation in subjects with early-onset thrombosis. Thromb Res. 2011;128(4):e43–e48. doi: 10.1016/j.thromres.2011.05.017. [DOI] [PubMed] [Google Scholar]
- 25.Eftychiou C, et al. Homocysteine levels and MTHFR polymorphisms in young patients with acute myocardial infarction: A case control study. Hellenic J Cardiol. 2012;53(3):189–194. [PubMed] [Google Scholar]
- 26.Aksoy M, et al. Hyperhomocysteinemia in patients with arterial occlusive disease. Surg Today. 2006;36(4):327–331. doi: 10.1007/s00595-005-3152-y. [DOI] [PubMed] [Google Scholar]
- 27.Weiss N, Keller C, Hoffmann U, Loscalzo J. Endothelial dysfunction and atherothrombosis in mild hyperhomocysteinemia. Vasc Med. 2002;7(3):227–239. doi: 10.1191/1358863x02vm428ra. [DOI] [PubMed] [Google Scholar]
- 28.Di Minno G, et al. Abnormally high thromboxane biosynthesis in homozygous homocystinuria. Evidence for platelet involvement and probucol-sensitive mechanism. J Clin Invest. 1993;92(3):1400–1406. doi: 10.1172/JCI116715. [DOI] [PMC free article] [PubMed] [Google Scholar]
- 29.Coppola A, et al. Homocysteine, coagulation, platelet function, and thrombosis. Semin Thromb Hemost. 2000;26(3):243–254. doi: 10.1055/s-2000-8469. [DOI] [PubMed] [Google Scholar]
- 30.Davì G, et al. Oxidative stress and platelet activation in homozygous homocystinuria. Circulation. 2001;104(10):1124–1128. doi: 10.1161/hc3501.095287. [DOI] [PubMed] [Google Scholar]
- 31.d'Emmanuele di Villa Bianca R, et al. Hydrogen sulphide induces mouse paw oedema through activation of phospholipase A2. Br J Pharmacol. 2010;161(8):1835–1842. doi: 10.1111/j.1476-5381.2010.01016.x. [DOI] [PMC free article] [PubMed] [Google Scholar]
- 32.Lentz SR. Mechanisms of homocysteine-induced atherothrombosis. J Thromb Haemost. 2005;3(8):1646–1654. doi: 10.1111/j.1538-7836.2005.01364.x. [DOI] [PubMed] [Google Scholar]
- 33.Vargas JR, Radomski M, Moncada S. The use of prostacyclin in the separation from plasma and washing of human platelets. Prostaglandins. 1982;23(6):929–945. doi: 10.1016/0090-6980(82)90135-6. [DOI] [PubMed] [Google Scholar]
- 34.Born GV. Aggregation of blood platelets by adenosine diphosphate and its reversal. Nature. 1962;194:927–929. doi: 10.1038/194927b0. [DOI] [PubMed] [Google Scholar]
- 35.Kirkby N, Cabirol S, Mazille M, Mitchell J, Warner T. Development of a homogenous time-resolved fluorescence-based immunoassay for the evaluation of platelet thromboxane release. pA2online. 2011;9(3):075P. [Google Scholar]
- 36.Sun B, Tandon NN, Yamamoto N, Yoshitake M, Kambayashi JI. Luminometric assay of platelet activation in 96-well microplate. Biotechniques. 2001;31(5):1174–1181, 1176, 1178 passim. doi: 10.2144/01315dd02. [DOI] [PubMed] [Google Scholar]
- 37.Fusco F, et al. Sildenafil effect on the human bladder involves the L-cysteine/hydrogen sulfide pathway: A novel mechanism of action of phosphodiesterase type 5 inhibitors. Eur Urol. 2012;62(6):1174–1180. doi: 10.1016/j.eururo.2012.07.025. [DOI] [PubMed] [Google Scholar]
Associated Data
This section collects any data citations, data availability statements, or supplementary materials included in this article.