

Abstract
The solute carrier organic anion transporting polypeptide 1A2 (OATP1A2, SLCO1A2) is implicated in the cellular influx of a number of drugs. We identified five novel single nucleotide polymorphisms (SNPs) in coding exons of the SLCO1A2 gene in a cohort of subjects: G550A, G553A, G673A, A775C, and G862A, that encoded the OATP1A2 variants E184K, D185N, V255I, T259P, and D288N, respectively. The function and expression of these variant transporters were assessed in HEK-293 cells. We found that the novel variants, E184K, D185N, T259P, and D288N, were associated with impaired estrone-3-sulfate, imatinib, and methotrexate transport (∼20–50% of wild-type control); function was retained by OATP1A2-V255I. From biotinylation assays, the decreased function of these variants was due, at least in part, to impaired plasma membrane expression. The four loss-of-function variants were studied further using mutagenesis to produce variants that encode residues with different charges or steric properties. From immunoblotting, the replacement of negatively charged residues at amino acid positions 184 and 185 impaired membrane expression, while either a positive or negative charge at residue 288 supported the correct membrane targeting of OATP1A2. Replacement of T259 with bulky residues disrupted transporter stability. From molecular models, E184, D185, and D288 were located near several charged residues such that intramolecular ionic interactions may stabilize the transporter structure. Individuals who carry these novel SNPs in the SLCO1A2 gene may be at risk from impaired efficacy or enhanced toxicity during treatment with drugs that are substrates for OATP1A2.
Key words: organic anion transporting polypeptide 1A2, polymorphisms, SLCO1A2, transporter variants
INTRODUCTION
Organic anion transporting polypeptides (OATPs), encoded by the SLCO gene family, are expressed in epithelial cells from multiple tissues and mediate the cellular influx of organic anions, including a number of clinically important drugs. Because OATPs influence drug absorption, distribution, and elimination, factors that impair function may influence therapeutic efficacy and toxicity (1–3). An important source of impaired function is pharmacogenetic variation caused by single nucleotide polymorphisms (SNPs) that alter the primary amino acid sequence of the encoded transporter. Thus, naturally occurring genetic variants in SLCO transporter genes may contribute to variable patient responses to certain drugs.
OATP1A2 (SLCO1A2) is an important member of the OATP transporter family that is expressed at the apical surface of the intestinal epithelium and renal tubules, in brain capillary endothelium and in biliary cholangiocytes (3–9). OATP1A2 participates in the intestinal absorption of drug substrates (3,4), facilitates the tubular reabsorption of xenobiotics from urine as well as their secretion in bile (5), and may also influence uptake of drugs into the brain (7). Endogenous substrates of OATP1A2 include bile acids, steroid and thyroid hormones, and their conjugates. Important drug substrates include imatinib, fexofenadine, methotrexate, HIV protease inhibitors, HMG-CoA reductase inhibitors, and certain peptides (3,7,10–14). Several studies have shown that the cellular uptake and pharmacokinetic behavior of some drugs may be impaired in the case of certain OATP1A2 variants (3,9).
A number of studies have characterized the impact of pharmacogenetic variation in SLC transporters and their impact on transport function. Several naturally occurring SNPs in genes encoding OATPs have been identified that affect function (3,15–21). Limited information is available on how polymorphisms alter the function of OATP1A2 (3,9). Given the importance of substrate specificity and expression of OATP1A2 in relevant organs to drug disposition and response, genetic variations in SLCO1A2 may have significant pharmacologic and toxicological consequences. In the present study, the coding exons in the SLCO1A2 gene were sequenced in genomic DNA from a previously described cohort of subjects (22) and five novel variants were identified. The impact of the newly identified SNPs on OATP1A2 transporter function and expression was assessed in cells. Amino acid residues in putative intracellular loops that are subject to pharmacogenetic variation were identified to have critical roles in the stability and membrane expression of the transporter. Together, these findings identify new roles in intracellular amino acid residues that direct OATP1A2 to the plasma membrane.
MATERIALS AND METHODS
Materials
[3H] Estrone sulfate (E3S; specific activity 57.3 Ci/mmol) was purchased from PerkinElmer (Melbourne, VIC, Australia), [3H] methotrexate (MTX; specific activity 15.7 Ci/mmol) was purchased from BioScientific (Kirrawee, NSW, Australia), and [14C] imatinib (specific activity 51 mCi/mmol) was generously provided by Novartis (North Ryde, NSW, Australia). Culture media was obtained from Thermo Scientific (Lidcombe, NSW, Australia). Chloroquine, leupeptin, pepstatin, and lactacystin were purchased from Sapphire Biosciences (Redfern, NSW, Australia). Unless otherwise stated, all other chemicals and biochemicals were purchased from Sigma-Aldrich (Castle Hill, NSW, Australia).
Novel Pharmacogenomics Variants of SLCO1A2 and Expressing in HEK-293 Cells
The present study was approved by institutional ethics committees of the Western Sydney Area Health Service and the University of Sydney, and conformed to the Declaration of Helsinki (22). DNA was isolated from whole blood taken from 22 human subjects who had previously received imatinib (22). Resequencing of all coding exons in the SLCO1A2 gene was undertaken using KAPA HiFi PCR Kits (Geneworks, Hindmarsh SA, Australia). The primers used in amplification of the SLCO1A2 gene are shown in Table I. Amplified DNA was purified on Wizard SV Gel and PCR Clean-up System (Promega, Alexandria, NSW, Australia) and subjected to bidirectional sequencing (Ramaciotti Centre for Gene Function Analysis, Randwick, NSW, Australia).
Table I.
Primers Used in the Sequencing of SLCO1A2 Gene Exons
| OATP1A2 | Forward primer (5′–3′) | Reverse primer (5′–3′) |
|---|---|---|
| Exon 3 | GCGTTCCAGGTATTTTTG | GTTAGAAACCCTGCAAG |
| Exon 4 | CAATATTGAGGCTGCAACTG | GATGGAACCCTTAGTATCC |
| Exon 5 | CCCTCTGTAAATGTTGGTG | GACCTTTTTGTCAATGTAAGC |
| Exon 6 | GGTAGATCATCCACAGGCAG | CCTGGAGAGAGAACATATC |
| Exon 7 | CACTTACACTTGTCCATAC | TGTAGTGCCAAGCAGATG |
| Exon 8 | GTGACCCAGCATGAAAG | TAGAATTATCGGGTCCC |
| Exon 9 | GATAGACAGATAACCAGCC | ACCATAGGAAGAATCGG |
| Exon 10 | CCCAGTCAGCTACATCAC | GGTATTTCTGACCTCTTCC |
| Exon 11 | GTGGGTAATGTGTAACTAAG | CAAAGACAATCATGCACAC |
| Exon 12 | CTAACTGGGGATTGAGATGA | CACTGGTCAGATGCTATGG |
| Exon 13 | GTTATATGGTGTAATCTTGAGAGAC | GGAAGAAAAGTAGCGAGGAATAG |
| Exon 14 | CCCTGAATAACCAATAAGTGAGC | GACATTTGCTAGACTGCTTTTCTG |
| Exon 15 | GTTGCATTTGACCATAAGATTAC | GAGAAGGCATTAGGAGAC |
| Exon 16 | GGATTTTCTCAGTGGGA | AGCTGGCTCTAAGAATCT |
The SLCO1A2 cDNA was purchased from GeneCopoeia (cat. no. GC-Q0577). Specific nucleotide changes were generated using Pfu DNA polymerase (Promega, Alexandria, NSW, Australia) following the manufacturer's instructions. All sequences were confirmed by the dideoxy chain-termination method (Ramaciotti Centre for Gene Function Analysis). HEK-293 cells were maintained at 37°C and 5% CO2 in Dulbecco's modified Eagle's medium supplemented with 10% fetal calf serum. Cells were transfected with plasmid DNA using Lipofectamine 2000 Reagent (Invitrogen, Mount Waverley, VIC, Australia) following the manufacturer's instructions. Twenty-four hours after transfection, substrate uptake activities were measured.
Transport Studies
Cellular uptake of [3H] E3S (final concentration 0.3 μM, 67 nCi/well) in HEK-293 cells was conducted at 25°C as described previously (11,23). Uptake was initiated in phosphate-buffered saline (PBS; 137 mM NaCl, 2.7 mM KCl, 4.3 mM Na2HPO4, 1.4 mM KH2PO4, pH 7.4) containing 1 mM CaCl2 and 1 mM MgCl2, and was terminated by rapidly washing the cells in buffer at 4°C. Preliminary experiments indicated that initial rates of OATP1A2-mediated substrate uptake in HEK293 cells were linear over at least 8 min, which was the time selected for subsequent experiments. The cells were then solubilized in 0.2 M NaOH, neutralized with 0.2 M HCl, and aliquoted for liquid scintillation counting. The uptake of [14C] imatinib (final concentration 3 μM, 6.1 nCi/well) was undertaken in analogous fashion at 37°C in buffer containing 125 mM NaCl, 4.8 mM KCl, 5.6 mM d-glucose, 1.2 mM CaCl2, 1.2 mM KH2PO4, 1.2 mM MgSO4, and 25 mM HEPES (pH 5.0). The uptake of [3H] MTX (final concentration 5 μM, 94 nCi/well) was performed in PBS (pH 5.5; 25°C). Uptake was standardized to the amount of protein in each well. Kinetic studies were performed with varying concentrations of E3S (0.05–80 μM) added to the uptake buffer for a 4-min incubation in cells, and apparent Km and Vmax values for transporter activity were then calculated where possible (GraphPad Prism 5.0; GraphPad Inc, LaJolla, CA, USA).
Cell Surface Biotinylation
Cell surface expression of OATP1A2 and variants was determined using the membrane-impermeable biotinylation reagent NHS-SS-biotin (Quantum Scientific, Lane Cove West, NSW, Australia). Transporter cDNAs were expressed in HEK-293 cells in six-well plates using Lipofectamine 2000, as previously described (24). After 24 h, the medium was removed and the cells were washed with ice-cold PBS (pH 8.0; 3 mL). Cells were incubated on ice with 1 mL of freshly prepared NHS-SS-biotin (0.5 mg in PBS) for 30 min with gentle shaking. After biotinylation, cells were washed with PBS containing 100 mM glycine (3 mL) and then incubated on ice for 20 min to ensure complete quenching of the unreacted NHS-SS-biotin. The cells were then treated for 30 min with lysis buffer (10 mM Tris, 150 mM NaCl, 1 mM EDTA, 0.1% SDS, and 1% Triton X-100 that contained the protease inhibitors phenylmethylsulfonyl fluoride (200 mg/mL) and leupeptin (3 mg/mL), pH 7.4; 400 μL). Unlysed cells were removed by centrifugation at 14,000×g at 4°C. Streptavidin agarose beads (50 μL; Quantum Scientific) were then added to the supernatant to isolate biotinylated cell membrane proteins.
Electrophoresis and Immunoblotting
Protein samples were denatured, loaded onto 7.5% polyacrylamide minigels, and electrophoresed using a mini cell (Bio-Rad, Gladesville, NSW, Australia). Proteins were transferred to polyvinylidene fluoride membranes in an electroelution cell (Bio-Rad) and blocked for 1 h with 5% nonfat dry milk in PBS–Tween (80 mM Na2HPO4, 20 mM KH2PO4, 100 mM NaCl, and 0.05% Tween 20, pH 7.5), washed, and then incubated overnight at 4°C with anti-OATP1A2 antibody (1 μg/mL; ThermoFisher Scientific, Scoresby, VIC, Australia; cat. no. sc-48744). The membranes were washed, incubated with goat anti-rabbit IgG conjugated to horseradish peroxidase (1:5,000; Sapphire Biosciences, cat. no. sc-2004), and signals were detected using the Immobilon Western Chemiluminescent HRP Substrate (Merck Millipore, Kilsyth, VIC, Australia).
Immunofluorescence of Transfected Cells
Cells in which OATP1A2 and its variants were overexpressed were washed three times in PBS, fixed for 20 min at room temperature in 4% paraformaldehyde in PBS, and then rewashed in PBS. The fixed cells were permeabilized with 0.1% Triton X-100 for 10 min, incubated for 30 min at room temperature in PBS containing 5% goat serum, and then incubated for 2 h in the same medium containing anti-OATP1A2 antibody (10 μg/mL). The cells were washed, and bound primary antibody was detected using Alexa Fluor® 594 conjugate goat anti-rabbit IgG (Invitrogen cat. no. A11012; 1:1,000 dilution; 1 h). Treated cells were washed thoroughly, and the cover glasses were mounted in VECTASHIELD Mounting Medium (Abacus ALS, East Brisbane QLD, Australia). Samples were visualized with a Leica DMI3000 B epifluorescence microscope (Leica Microsystems, North Ryde, NSW, Australia).
Computer Modeling
3D structures of bacterial transporters were used in the present study as templates for modeling OATP1A2. In the most straightforward arrangement of the transporter structures, the 12 helices were arranged as a pair of distinct six helix bundles using the glycerol-3-phosphate transporter from Escherichia. coli as template (GlpT, 1PW4) (25).
Multiple sequence alignments were performed using CLUSTAL (26) as implemented in the European Bioinformatics Institute resource (27). The sequence alignment retaining the transmembrane boundary predictions and template were used as inputs for the comparative protein modeling software MODELLER (28), using the graphical interface of Discovery Studio (v3.0, Accelrys, San Diego, CA, USA). The extended fifth extracellular loop between helices 9 and 10 (∼105 amino acids) in the structure of OATP1A2 was least reliably modeled and was removed to prior to the analysis, along with the N- and C-termini that also do not align with the GlpT template.
Statistics
Data are presented throughout as mean ± SEM. The Student's t test was used to test for differences between two sets of normally distributed data. Differences in transport function of OATP1A2 and multiple variants were detected by one-way analysis of variance and Dunnett's testing.
RESULTS
Identification of SLCO1A2 Polymorphisms in a Patient Cohort
Genomic DNA from 22 subjects was subjected to bidirectional resequencing of all coding exons of the SLCO1A2 gene (exons 3–16) using the primers detailed in Table I; exons 1 and 2 in SLCO1A2 are non-coding exons. In total, five non-synonymous SNPs were identified in the patient cohort (allele frequencies and demographic factors are shown in Table II). Two of the five novel SNPs in the SLCO1A2 gene (G763A and G862A in exon 9) that encoded the OATP1A2-V255I and OATP1A2-D288N variant transporters, respectively, were found in three heterozygous individuals. One individual was homozygous for the SNP A775C in exon 9 that encoded OATP1A2-T259P. The two remaining SNPs in SLCO1A2 were more widely distributed throughout the cohort. Thus, 14 subjects were heterozygous for the G550A SNP in exon 7 that encoded OATP1A2-E184K (allele frequency 0.325) and 19 were heterozygous for the G553A SNP in exon 7 (allele frequency 0.45) that encoded OATP1A2-D185N.
Table II.
Demographic Factors in the Subject Cohort and Novel Non-synonymous SNPs of SLCO1A2 Identified in Genomic DNA
| OATP1A2 variant | Exon | Nucleic acid position | Allele change | Allele frequency |
|---|---|---|---|---|
| E184K | 7 | 550 | g= > a | 0.325 |
| D185N | 7 | 553 | g= > a | 0.450 |
| V255I | 9 | 763 | g= > a | 0.075 |
| T259P | 9 | 775 | a= > c | 0.050 |
| D288N | 9 | 862 | g= > a | 0.075 |
Gender: 12 M, 10 F. Age range: 38.3 – 68.8 years. Ethnic ancestry: Caucasian 16, Asian 3, Pacific Islander 2, Hispanic 1
Functional Analysis of Novel SLCO1A2 Variants
In human embryonic kidney (HEK-293) cells, the transient transfection of cDNA encoding wild-type OATP1A2 increased the influx of the reference substrate [3H] E3S to ∼11-fold of control (Fig. 1a), while the influx of [3H] MTX and [14C] imatinib was increased to ∼3.3-fold and ∼2.0-fold of respective control (Fig. 1b, c). Under the test conditions, basal rates of substrate uptake by wild-type OATP1A2 were 12.5 pmol/(mg min) for E3S, 57.5 pmol/(mg min) for MTX, and 53.8 pmol/(mg min) for imatinib.
Fig. 1.
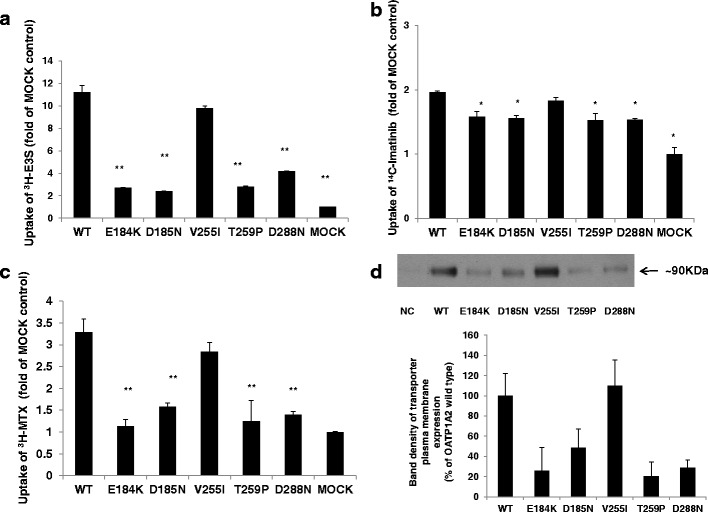
Transporter function and protein expression of OATP1A2 and its variants. a–c Transport of 300 nM [3H] estrone sulfate (E3S), 3 μM [14C] imatinib, and 5 μM [3H] methotrexate (MTX) in HEK-293 cells transfected with wild type and mutagenized variants of OATP1A2, relative to mock-transfected control (MOCK). Basal rates of substrate uptake by wild-type OATP1A2 were 12.5 pmol/(mg min) for E3S, 57.5 pmol/(mg min) for MTX, and 53.8 pmol/(mg min) for imatinib. d Western blot analysis of cell surface expression of wild-type OATP1A2 and its variant transporters. Upper panel, cells were biotinylated and the labeled cell surface proteins were precipitated with streptavidin beads and separated by gel electrophoresis, followed by Western blotting with anti-OATP1A2 antibody. Bottom panel, densitometric analysis of transporter plasma expression. NC, negative control. Values are mean ± SE (n = 3). Different from wild type, *p < 0.05; **p < 0.01
In order to assess the impact of the novel SLCO1A2 variants on transporter function, HEK-293 cells were transfected with variant cDNAs that had been engineered by site-directed mutagenesis. Transport of the model substrate E3S by the variants OATP1A2-E184K, D185N, D288N, and T259P was markedly altered compared to wild-type OATP1A2 (Fig. 1a). In the case of the OATP1A2-V255I variant, transport function was slightly, but not significantly, decreased when E3S was the substrate. Compared to wild-type, influx of the OATP1A2 substrate imatinib by the five novel OATP1A2 variants was also impaired (Fig. 1b). With the OATP1A2-E184K, OATP1A2-D185N, OATP1A2-T259P, and OATP1A2-D288N variants, the decrease in function was to ∼40–50% of wild-type control, while transport by OATP1A2-V255I was only slightly decreased (Fig. 1b). Similar trends were noted in MTX transport, with pronounced decreases observed for the variants, again with the exception of OATP1A2-V255I (Fig. 1c).
Altered Cellular Expression of the Novel Variants of OATP1A2
The mechanism underlying the decrease in the transport function of the novel OATP1A2 variants was assessed initially in transporter biotinylation and immunoblotting analyses in transfected HEK-293 cells. From densitometric analysis, the plasma membrane expression of the E184K, D185N, T259P, and D288N variants was decreased markedly to ∼20–40% of wild type, whereas the expression of the V255I variant was unchanged (Fig. 1d). In confirmatory immunocolocalization experiments, the expression of OATP1A2-E184K, OATP1A2-D185N, OATP1A2-T259N, and OATP1A2-D288N variants at the plasma membrane was decreased (Fig. 2). The specificity of biotinylation was confirmed by reprobing the immunoblotting membranes with an anti-actin antibody.
Fig. 2.
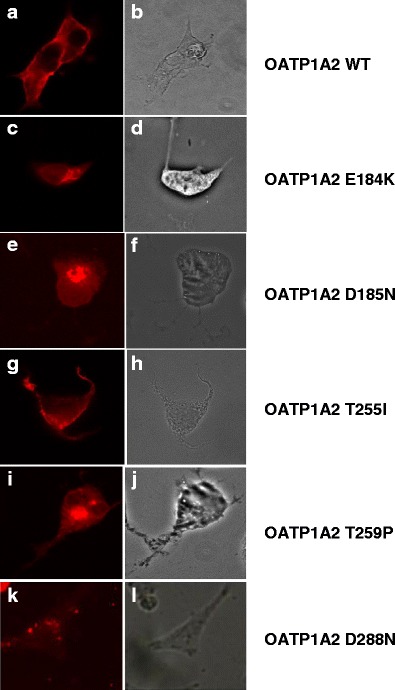
Immunofluorescence analysis of OATP1A2 and its variants expressed in HEK-293 cells. Cells that overexpressed OATP1A2 and its variants were stained with anti-OATP1A2 antibody and Alexa Fluor® 594 conjugate goat anti-rabbit IgG. Panels A, C, E, G, I, and K show the specific immunostaining of OATP1A2, which appears as bright fluorescence. Panels B, D, F, H, J, and L are phase-contrast images and show that cells remain fully attached to the culture dishes under the test conditions. WT, wild type
Apart from impaired expression at the cell surface, transport function could also be decreased due to altered substrate affinity or turnover. Kinetic analysis of E3S transport was conducted in HEK-293 cells that expressed wild-type OATP1A2 and the D288N variant. Compared with wild type, the variant exhibited decreased apparent Km (12 ± 1 compared with 20 ± 3 μM) and Vmax values (16.7 ± 0.4 versus 36.7 ± 1.8 pmol/μg protein × 4 min), which led to an approximate 25% decline in intrinsic clearance (Vmax/Km). Because the other novel OATP1A2 variants (E184K, D185N, and T259P) had low transporter function, conventional kinetic studies could not be conducted.
Functional Analysis of Further Mutants Derived from the Novel OATP1A2 Variants
Three of the four residues that were subject to naturally occurring polymorphisms in patient samples encoded acidic residues (E184, D185, and D288), while the fourth encoded the polar amino acid threonine (T259). Because the variant transporters all exhibited a loss-of-function, we tested the hypothesis that these highly polar amino acids play important roles in OATP1A2 activity. We systematically mutagenized the residues to evaluate the impact on transport function of amino acid replacement. As shown in Fig. 3a, b, function was retained providing acidic residues (aspartic or glutamic acids) were located at 184 and 185 because basic residues (lysine, arginine, or histidine), or the neutral polar asparagine, encoded variants with greatly decreased activity (7–63% of wild-type control). Interestingly, and in contrast with the findings with residues 184/185, either acidic or basic residues (glutamic acid, lysine, arginine, or histidine) at position 288 supported full transporter function (Fig. 3d), while neutral polar (asparagine or glutamine) or hydrophobic (valine) residues impaired E3S transport.
Fig. 3.
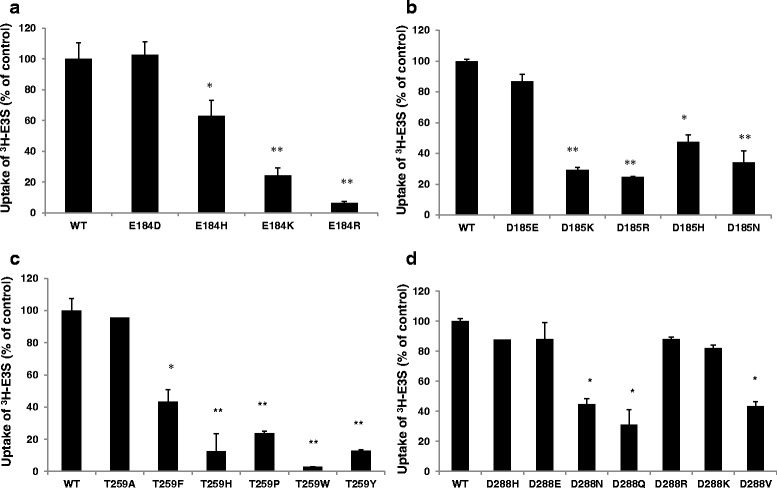
Transporter function of the derivative mutants of OATP1A2. The transport of 300 nM [3H] estrone sulfate (E3S) in HEK-293 cells transfected with wild-type and derivative mutants of OATP1A2-E184 (a) OATP1A2-D185 (b), OATP1A2-T259 (c), and OATP1A2-D288 (d) (after subtraction of uptake in with mock-transfected control cells). Values are mean ± SE (n = 3). Different from wild type, *p < 0.05; **p < 0.01
The variant T259P, in which the neutral polar threonine residue is replaced by a rigid proline, also exhibited decreased function (to ∼20% of wild-type control). We further mutagenized the threonine to histidine (basic), or tyrosine, phenylalanine, and tryptophan (neutral aromatic) residues that all have bulky side chains, or to alanine that has a small side chain. Transporter function was only impaired with variant amino acids that contained bulky side chains (3–43% of wild-type control) because the transport capacity of OATP1A2-T259A was similar to wild type (Fig. 3c). In summary, these observations indicate that an acidic amino acid is essential at positions 184 and 185, while either acidic or basic residues at position 288 allow function to be retained. Inclusion of bulky amino acids in place of the polar threonine at position 259 markedly decreases function.
To pursue potential mechanisms for the observed functional changes induced by replacement of the naturally occurring residues at these positions, we investigated the expression of mutant transporters in whole cell lysates. From direct immunoblotting, signals corresponding to immunoreactive OATP1A2 protein were detected at ∼65 and ∼90 kDa in lysates. Interestingly, because the total cell expression signal at ∼90 kDa was decreased, particularly in the loss-of-function mutants engineered at residues 184, 185, and 259 (Fig. 4a–c), but not those at residue 288 (Fig. 4d), it appeared likely that the first three of these residues may play critical roles in maintaining the stability of the OATP1A2 protein.
Fig. 4.
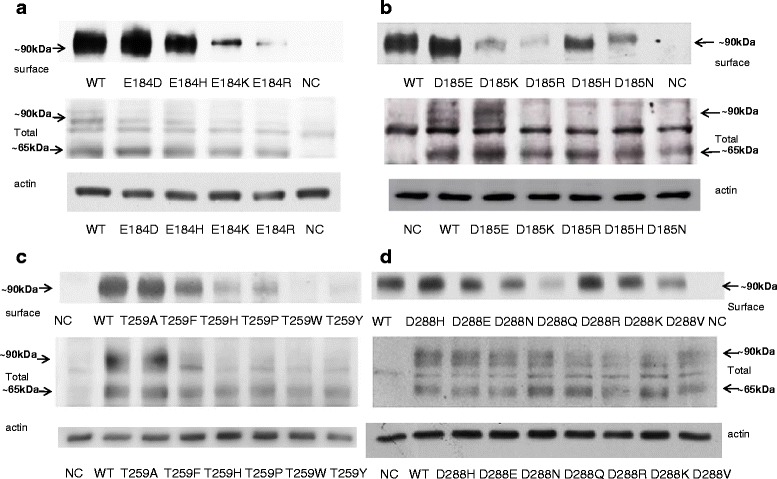
Protein expression of OATP1A2 and its mutants in HEK-293 cells. Western blot analysis of wild-type OATP1A2 and derivative mutants created at amino acid position 184 (a), 185 (b), 259 (c), and 288 (d). Upper panels, cell surface expression of OATP1A2 and its mutants. Cells were biotinylated, and the labeled cell surface proteins were precipitated with streptavidin beads and separated by gel electrophoresis, followed by Western blotting with anti-OATP1A2 antibody. Middle panels, Western analysis of total cellular expression of OATP1A2 and its mutants. Lower panels, after stripping, blots were reprobed with anti-actin antibody. WT, wild type; NC, negative control
Computational Modeling of OATP1A2
A crystal structure for OATP1A2 is not currently available but 3D structures of bacterial transporters have been reported and exhibit the basic topology proposed for human transporters (24,25,29,30).
To provide the most straightforward analysis, the 12 transmembrane domain helices in the arrangement, in which there were two separately identifiable six helix bundles, was considered suitable. The glycerol 3-phosphate transporter (GlpT) from E. coli (PDB ID 1pw4) (25), which shares 8% sequence relatedness across the aligned regions, was selected as a suitable template (at 3.3 Å resolution). Model quality parameters determined by MolProbity were as follows: rotamer outliers 7.1%, Ramachandran outliers 2.9%, Ramachandran favored 91%, 34 Cβ deviations >0.25 Å, residues with bad bonds 0.0%, and residues with bad angles 2.7% (31); this level of quality is suitable for the present purposes. As shown in Fig. 5a, the residues E184 and D185 are within the second intracellular loop, while D288 is in the third intracellular loop and V255/T259 are in transmembrane helix six. Figure 5b, c shows the putative conformation of OATP1A2 and provides spatial context for the E184, D185, and D288 residues.
Fig. 5.
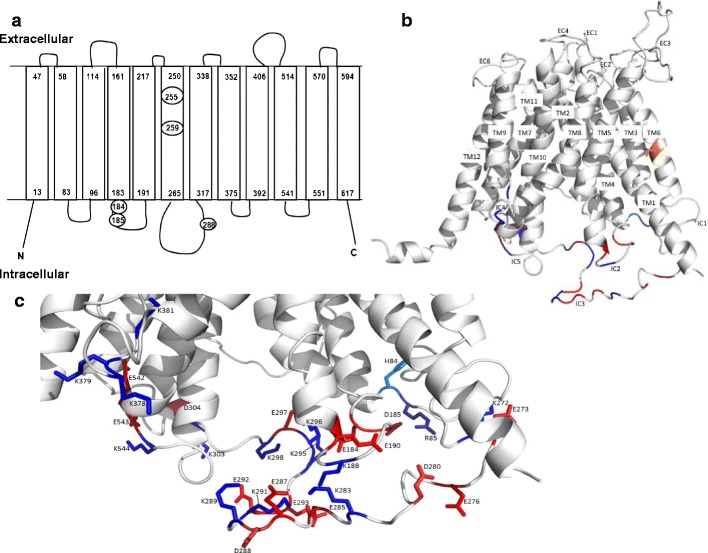
Computer modeling of OATP1A2 structure. a The topological structure of OATP1A2 obtained by Transmembrane Helix Benchmarking software (www.sydney.edu.au/pharmacy/sbio/software/TMH_benchmark) based on the structure of GlpT and shown in the same orientation. Circled residues indicate the location of the amino acid replacements in the five novel variants found in the current study. The N- and C-termini are located intracellularly, while a series of extracellular and intracellular loops connect the transmembrane domains; b proposed overall 3D structure showing transmembrane (TM) helices, extracellular (EC), and intracellular (IC) loops; and c a close up view, in the same orientation, of the intracellular region near the large loop showing the charged side chains. T259 is shown (orange) in TM6 of the helix bundle. Charged amino acids of the intracellular regions are colored blue and red for basic and acidic residues, respectively. The figures were drawn using PyMOL (DeLano Scientific; San Carlos, CA, USA)
DISCUSSION
OATP1A2 is a major transporter responsible for the cellular influx of important drugs such as imatinib, MTX, fexofenadine, and HMG-CoA reductase inhibitors (3,7,10,12,32–34). Pharmacogenetic variants of this transporter that have altered function may influence both the rate of drug influx and the toxicity of various agents in cells and in vivo (3,9). The functional characterization and molecular evaluation of novel SLCO1A2 genetic variants identified in patients could be significant for understanding interindividual variation in the response to drug substrates.
The functional significance of five novel SLCO1A2 variants that were identified in a cohort of subjects was evaluated in vitro. Following transient transfection of the variant cDNAs into HEK-293 cells, transporter function and plasma membrane expression were determined. Variants that had decreased substrate transport activity also exhibited a corresponding decline in expression at the plasma membrane.
One of the novel variants identified in the present study (SLCO1A2 G862A) encodes the variant residue D288N that is located within the large putative third intracellular loop between transmembrane domains 6 and 7. Three other SLCO1A2 variants that led to sequence changes in this loop have been identified previously (3). The truncated variant transporter OATP1A2-N278X was inactive, but neither OATP1A2-T277N nor I281V exhibited altered function with E3S or MTX (3). The present studies suggested that transporter function and membrane expression were decreased in the case of the D288N variant so that it is likely that this residue is important in membrane targeting. It is feasible that this residue may interact with an intracellular chaperone protein that directs OATP1A2 to the plasma membrane or that intramolecular interactions between residues stabilize the conformation of the transporter; the present investigation focused principally on the second possibility. From modeling considerations, the location of D288 may facilitate interactions with nearby basic residues in the large intracellular loop (such as K283, K289, or K291) or adjacent loops (such as K188 in intracellular loop 2 or K544 in intracellular loop 5). It also emerged that replacement of D288 with basic amino acids retained E3S transport capacity and high plasma membrane expression. Again, a number of negatively charged residues, such as E285, E287, E292, and E293 are also in the vicinity of D288 and several others are present in adjacent loops. However, it is important to add that the large intracellular loop and the large extracellular loop between transmembrane domains 9 and 10 are least reliably predicted by modeling and conformations other than that shown in Fig. 5 are possible.
Apart from OATP1A2-D288N, two other variants—OATP1A2-E184K and OATP1A2-D185N—exhibited decreased cellular uptake of E3S, MTX, and imatinib. The functional impairment in the cases of these two variants might be due to decreased cell surface and total cellular expression. From computer modeling, E184 and D185 were located within the second intracellular loop and could interact with adjacent positively charged residues, such as R85 in the first intracellular loop or K188, K295, and K296 in the second and third intracellular loops. Unlike the situation with D288, replacement of E184 and D185 with basic amino acids led to loss of function. Presumably, this could be due to a shortage of nearby negatively charged residues that might stabilize the conformation, or alternately that the region near 184/185 may have a pivotal role in the transport mechanism. Thus, it is feasible that the native OATP1A2 protein might be stabilized by specific ionic interactions and that replacement of important residues disrupts the interactions and destabilizes the protein.
It has been suggested that transmembrane domain helices control membrane targeting, protein stability, and substrate binding in SLC transporters (24,35–37). In the case of residue T259, which is located in transmembrane domain 6, the present data suggest that the steric nature of the amino acid at this position is an important factor. While the residues threonine (polar amino acid) and alanine (small, hydrophobic amino acid) sustained transporter function and stability, the larger or more rigid histidine, tyrosine, phenylalanine, proline, and tryptophan strongly disrupted transport function, perhaps by altering the conformation of the protein.
Previous studies of the impact of pharmacogenetic variants of OATP1A2 on drug transport have yielded variable findings. Thus, imatinib uptake was decreased in cells containing the OATP1A2 variants *3 (E172D in transmembrane domain 4), *5, and *6 (N128Y and N135I in intracellular loop 2), but not the *7 variant (T668S in the C-terminal region) (23). Uptake of E3S and two peptide substrates was markedly impaired in the case of the *3 and *6 variants but less so with *5 and *7 (9). This resembled the present findings in relation to negatively charged intracellular residues in OATP1A2. Interestingly, similar findings have been noted with acidic intracellular residues in other SLC transporters. Thus, mutagenesis of acidic residues in the large intracellular loop in the human dipeptide transporter (hPEPT1; SLC15A1) and the E452K substitution in the C-terminus of the organic cation/carnitine transporter-2 (OCTN2; SLC22A5) also produced marked decreases in substrate transport (38,39). It would now be of interest to evaluate in greater detail the incidence of pharmacogenetic variation in acidic residues in intracellular loops in human SLC transporters.
CONCLUSION
The tissue expression pattern of OATP1A2 is significant for tissue-specific drug disposition. Location in the distal tubules of nephrons, intestinal villi, and endothelial cells that constitute the blood–brain barrier is clinically relevant, especially in view of the broad substrate specificity for this transporter. The present identification of novel variants of OATP1A2 that have impaired function and expression could affect the disposition of endogenous compounds and drugs in multiple tissues and contribute to interindividual variability in drug responsiveness and toxicity. In this regard, it is noteworthy that the very recent study by Angelini et al. reported that there were significant relationships between major and complete molecular responses in 189 imatinib-treated patients with chronic myelogenous leukemia and the presence of pharmacogenetic variation in several SLC transporters, including OATP1A2 (40).
ACKNOWLEDGMENTS
Special thanks to Avy Sim for the assistance with the computer modeling of OATP1A2 structure. This study was supported by grants from Cancer Council NSW and the Australian National Health and Medical Research Council. The generous gifts of imatinib and 14C-imatinib from Novartis are gratefully acknowledged.
Conflict of Interest
The authors declare no conflict of interest.
Abbreviations
- OATP1A2
Organic anion transporting polypeptide 1A2
- E3S
Estrone-3-sulfate
- GlpT
Glycerol 3-phosphate transporter
- PBS
Phosphate-buffered saline
- SLCO
Solute carrier organic anion transporter
- SNP
Single nucleotide polymorphism
REFERENCES
- 1.Poirier A, Funk C, Lave T, Noe J. New strategies to address drug–drug interactions involving OATPs. Curr Opin Drug Discov Dev. 2007;10(1):74–83. [PubMed] [Google Scholar]
- 2.Kivisto KT, Niemi M. Influence of drug transporter polymorphisms on pravastatin pharmacokinetics in humans. Pharm Res. 2007;24(2):239–47. doi: 10.1007/s11095-006-9159-2. [DOI] [PubMed] [Google Scholar]
- 3.Badagnani I, Castro RA, Taylor TR, Brett CM, Huang CC, Stryke D, et al. Interaction of methotrexate with organic-anion transporting polypeptide 1A2 and its genetic variants. J Pharmacol Exp Ther. 2006;318(2):521–9. doi: 10.1124/jpet.106.104364. [DOI] [PubMed] [Google Scholar]
- 4.Glaeser H, Bailey DG, Dresser GK, Gregor JC, Schwarz UI, McGrath JS, et al. Intestinal drug transporter expression and the impact of grapefruit juice in humans. Clin Pharmacol Ther. 2007;81(3):362–70. doi: 10.1038/sj.clpt.6100056. [DOI] [PubMed] [Google Scholar]
- 5.Roth M, Obaidat A, Hagenbuch B. OATPs, OATs and OCTs: the organic anion and cation transporters of the SLCO and SLC22A gene superfamilies. Br J Pharmacol. 2012;165(5):1260–87. doi: 10.1111/j.1476-5381.2011.01724.x. [DOI] [PMC free article] [PubMed] [Google Scholar]
- 6.Yang CH, Glover KP, Han X. Characterization of cellular uptake of perfluorooctanoate via organic anion-transporting polypeptide 1A2, organic anion transporter 4, and urate transporter 1 for their potential roles in mediating human renal reabsorption of perfluorocarboxylates. Toxicol Sci. 2010;117(2):294–302. doi: 10.1093/toxsci/kfq219. [DOI] [PubMed] [Google Scholar]
- 7.Gao B, Hagenbuch B, Kullak-Ublick GA, Benke D, Aguzzi A, Meier PJ. Organic anion-transporting polypeptides mediate transport of opioid peptides across blood–brain barrier. J Pharmacol Exp Ther. 2000;294(1):73–9. [PubMed] [Google Scholar]
- 8.Su Y, Zhang X, Sinko PJ. Human organic anion-transporting polypeptide OATP-A (SLC21A3) acts in concert with P-glycoprotein and multidrug resistance protein 2 in the vectorial transport of Saquinavir in Hep G2 cells. Mol Pharm. 2004;1(1):49–56. doi: 10.1021/mp0340136. [DOI] [PubMed] [Google Scholar]
- 9.Lee W, Glaeser H, Smith LH, Roberts RL, Moeckel GW, Gervasini G, et al. Polymorphisms in human organic anion-transporting polypeptide 1A2 (OATP1A2): implications for altered drug disposition and central nervous system drug entry. J Biol Chem. 2005;280(10):9610–7. doi: 10.1074/jbc.M411092200. [DOI] [PubMed] [Google Scholar]
- 10.Hartkoorn RC, Kwan WS, Shallcross V, Chaikan A, Liptrott N, Egan D, et al. HIV protease inhibitors are substrates for OATP1A2, OATP1B1 and OATP1B3 and lopinavir plasma concentrations are influenced by SLCO1B1 polymorphisms. Pharmacogenet Genomics. 2010;20(2):112–20. doi: 10.1097/FPC.0b013e328335b02d. [DOI] [PMC free article] [PubMed] [Google Scholar]
- 11.Hu S, Franke RM, Filipski KK, Hu C, Orwick SJ, de Bruijn EA, et al. Interaction of imatinib with human organic ion carriers. Clin Cancer Res. 2008;14(10):3141–8. doi: 10.1158/1078-0432.CCR-07-4913. [DOI] [PubMed] [Google Scholar]
- 12.Kullak-Ublick GA, Hagenbuch B, Stieger B, Schteingart CD, Hofmann AF, Wolkoff AW, et al. Molecular and functional characterization of an organic anion transporting polypeptide cloned from human liver. Gastroenterology. 1995;109(4):1274–82. doi: 10.1016/0016-5085(95)90588-X. [DOI] [PubMed] [Google Scholar]
- 13.Mandery K, Bujok K, Schmidt I, Keiser M, Siegmund W, Balk B, et al. Influence of the flavonoids apigenin, kaempferol, and quercetin on the function of organic anion transporting polypeptides 1A2 and 2B1. Biochem Pharmacol. 2010;80(11):1746–53. doi: 10.1016/j.bcp.2010.08.008. [DOI] [PubMed] [Google Scholar]
- 14.Shirasaka Y, Suzuki K, Nakanishi T, Tamai I. Intestinal absorption of HMG-CoA reductase inhibitor pravastatin mediated by organic anion transporting polypeptide. Pharm Res. 2010;27(10):2141–9. doi: 10.1007/s11095-010-0216-5. [DOI] [PubMed] [Google Scholar]
- 15.Nies AT, Niemi M, Burk O, Winter S, Zanger UM, Stieger B, et al. Genetics is a major determinant of expression of the human hepatic uptake transporter OATP1B1, but not of OATP1B3 and OATP2B1. Genome Med. 2013;5(1):1. doi: 10.1186/gm405. [DOI] [PMC free article] [PubMed] [Google Scholar]
- 16.Rodrigues AC, Perin PM, Purim SG, Silbiger VN, Genvigir FD, Willrich MA, et al. Pharmacogenetics of OATP transporters reveals that SLCO1B1 c.388A>G variant is determinant of increased atorvastatin response. Int J Mol Sci. 2011;12(9):5815–27. doi: 10.3390/ijms12095815. [DOI] [PMC free article] [PubMed] [Google Scholar]
- 17.Thakkar N, Kim K, Jang ER, Han S, Kim D, Merchant N, et al. A cancer-specific variant of the SLCO1B3 gene encodes a novel human organic anion transporting polypeptide 1B3 (OATP1B3) localized mainly in the cytoplasm of colon and pancreatic cancer cells. Mol Pharm. 2013;10(1):406–16. doi: 10.1021/mp3005353. [DOI] [PubMed] [Google Scholar]
- 18.Picard N, Yee SW, Woillard JB, Lebranchu Y, Le Meur Y, Giacomini KM, et al. The role of organic anion-transporting polypeptides and their common genetic variants in mycophenolic acid pharmacokinetics. Clin Pharmacol Ther. 2010;87(1):100–8. doi: 10.1038/clpt.2009.205. [DOI] [PMC free article] [PubMed] [Google Scholar]
- 19.Tsuda-Tsukimoto M, Maeda T, Iwanaga T, Kume T, Tamai I. Characterization of hepatobiliary transport systems of a novel alpha4beta1/alpha4beta7 dual antagonist, TR-14035. Pharm Res. 2006;23(11):2646–56. doi: 10.1007/s11095-006-9102-6. [DOI] [PubMed] [Google Scholar]
- 20.Ho RH, Tirona RG, Leake BF, Glaeser H, Lee W, Lemke CJ, et al. Drug and bile acid transporters in rosuvastatin hepatic uptake: function, expression, and pharmacogenetics. Gastroenterology. 2006;130(6):1793–806. doi: 10.1053/j.gastro.2006.02.034. [DOI] [PubMed] [Google Scholar]
- 21.Kameyama Y, Yamashita K, Kobayashi K, Hosokawa M, Chiba K. Functional characterization of SLCO1B1 (OATP-C) variants, SLCO1B1*5, SLCO1B1*15 and SLCO1B1*15+C1007G, by using transient expression systems of HeLa and HEK293 cells. Pharmacogenet Genomics. 2005;15(7):513–22. doi: 10.1097/01.fpc.0000170913.73780.5f. [DOI] [PubMed] [Google Scholar]
- 22.Gurney H, Wong M, Balleine RL, Rivory LP, McLachlan AJ, Hoskins JM, et al. Imatinib disposition and ABCB1 (MDR1, P-glycoprotein) genotype. Clin Pharmacol Ther. 2007;82(1):33–40. doi: 10.1038/sj.clpt.6100201. [DOI] [PubMed] [Google Scholar]
- 23.Eechoute K, Franke RM, Loos WJ, Scherkenbach LA, Boere I, Verweij J, et al. Environmental and genetic factors affecting transport of imatinib by OATP1A2. Clin Pharmacol Ther. 2011;89(6):816–20. doi: 10.1038/clpt.2011.42. [DOI] [PMC free article] [PubMed] [Google Scholar]
- 24.Zhou F, Zhu L, Cui PH, Church WB, Murray M. Functional characterization of nonsynonymous single nucleotide polymorphisms in the human organic anion transporter 4 (hOAT4) Br J Pharmacol. 2010;159(2):419–27. doi: 10.1111/j.1476-5381.2009.00545.x. [DOI] [PMC free article] [PubMed] [Google Scholar]
- 25.Huang Y, Lemieux MJ, Song J, Auer M, Wang DN. Structure and mechanism of the glycerol-3-phosphate transporter from Escherichia coli. Science. 2003;301(5633):616–20. doi: 10.1126/science.1087619. [DOI] [PubMed] [Google Scholar]
- 26.Thompson JD, Higgins DG, Gibson TJ. CLUSTAL W: improving the sensitivity of progressive multiple sequence alignment through sequence weighting, position-specific gap penalties and weight matrix choice. Nucleic Acids Res. 1994;22(22):4673–80. doi: 10.1093/nar/22.22.4673. [DOI] [PMC free article] [PubMed] [Google Scholar]
- 27.Labarga A, Valentin F, Anderson M, Lopez R. Web services at the European bioinformatics institute. Nucleic Acids Res. 2007;35(Web Server issue):W6–11. doi: 10.1093/nar/gkm291. [DOI] [PMC free article] [PubMed] [Google Scholar]
- 28.Sali A, Potterton L, Yuan F, van Vlijmen H, Karplus M. Evaluation of comparative protein modeling by MODELLER. Proteins. 1995;23(3):318–26. doi: 10.1002/prot.340230306. [DOI] [PubMed] [Google Scholar]
- 29.Perry JL, Dembla-Rajpal N, Hall LA, Pritchard JB. A three-dimensional model of human organic anion transporter 1: aromatic amino acids required for substrate transport. J Biol Chem. 2006;281(49):38071–9. doi: 10.1074/jbc.M608834200. [DOI] [PMC free article] [PubMed] [Google Scholar]
- 30.Meier-Abt F, Mokrab Y, Mizuguchi K. Organic anion transporting polypeptides of the OATP/SLCO superfamily: identification of new members in nonmammalian species, comparative modeling and a potential transport mode. J Membr Biol. 2005;208(3):213–27. doi: 10.1007/s00232-005-7004-x. [DOI] [PubMed] [Google Scholar]
- 31.Davis IW, Leaver-Fay A, Chen VB, Block JN, Kapral GJ, Wang X, et al. MolProbity: all-atom contacts and structure validation for proteins and nucleic acids. Nucleic Acids Res. 2007;35(Web Server issue):W375–83. doi: 10.1093/nar/gkm216. [DOI] [PMC free article] [PubMed] [Google Scholar]
- 32.Eckhardt U, Schroeder A, Stieger B, Hochli M, Landmann L, Tynes R, et al. Polyspecific substrate uptake by the hepatic organic anion transporter Oatp1 in stably transfected CHO cells. Am J Physiol. 1999;276(4 Pt 1):G1037–42. doi: 10.1152/ajpgi.1999.276.4.G1037. [DOI] [PubMed] [Google Scholar]
- 33.Jacquemin E, Hagenbuch B, Stieger B, Wolkoff AW, Meier PJ. Expression cloning of a rat liver Na(+)-independent organic anion transporter. Proc Natl Acad Sci U S A. 1994;91(1):133–7. doi: 10.1073/pnas.91.1.133. [DOI] [PMC free article] [PubMed] [Google Scholar]
- 34.Kim RB, Leake B, Cvetkovic M, Roden MM, Nadeau J, Walubo A, et al. Modulation by drugs of human hepatic sodium-dependent bile acid transporter (sodium taurocholate cotransporting polypeptide) activity. J Pharmacol Exp Ther. 1999;291(3):1204–9. [PubMed] [Google Scholar]
- 35.Li N, Hong W, Huang H, Lu H, Lin G, Hong M. Identification of amino acids essential for estrone-3-sulfate transport within transmembrane domain 2 of organic anion transporting polypeptide 1B1. PLoS One. 2012;7(5):e36647. doi: 10.1371/journal.pone.0036647. [DOI] [PMC free article] [PubMed] [Google Scholar]
- 36.Gui C, Hagenbuch B. Amino acid residues in transmembrane domain 10 of organic anion transporting polypeptide 1B3 are critical for cholecystokinin octapeptide transport. Biochemistry. 2008;47(35):9090–7. doi: 10.1021/bi8008455. [DOI] [PMC free article] [PubMed] [Google Scholar]
- 37.Hong M, Li S, Zhou F, Thomas PE, You G. Putative transmembrane domain 12 of the human organic anion transporter hOAT1 determines transporter stability and maturation efficiency. J Pharmacol Exp Ther. 2010;332(2):650–8. doi: 10.1124/jpet.109.160515. [DOI] [PMC free article] [PubMed] [Google Scholar]
- 38.Xu L, Li Y, Haworth IS, Davies DL. Functional role of the intracellular loop linking transmembrane domains 6 and 7 of the human dipeptide transporter hPEPT1. J Membr Biol. 2010;238(1–3):43–9. doi: 10.1007/s00232-010-9317-7. [DOI] [PMC free article] [PubMed] [Google Scholar]
- 39.Amat di San Filippo C, Pasquali M, Longo N. Pharmacological rescue of carnitine transport in primary carnitine deficiency. Hum Mutat. 2006;27(6):513–23. doi: 10.1002/humu.20314. [DOI] [PubMed] [Google Scholar]
- 40.Angelini S, Soverini S, Ravegnini G, Barnett M, Turrini E, Thornquist M, et al. Association between imatinib transporters and metabolizing enzymes genotype and response in newly diagnosed chronic myeloid leukemia patients receiving imatinib therapy. Haematologica. 2013;98(2):193–200. doi: 10.3324/haematol.2012.066480. [DOI] [PMC free article] [PubMed] [Google Scholar]