

Abstract
Holins are small “hole-forming” transmembrane proteins that mediate bacterial cell lysis during programmed cell death or following phage infection. We have identified fifty two families of established or putative holins and have included representative members of these proteins in the Transporter Classification Database (TCDB; www.tcdb.org). We have identified the organismal sources of members of these families, calculated their average protein sizes, estimated their topologies and determined their relative family sizes. Topological analyses suggest that these proteins can have 1, 2, 3 or 4 transmembrane α-helical segments (TMSs), and members of a single family are frequently, but not always, of a single topology. In one case, proteins of a family proved to have either 2 or 4 TMSs, and the latter arose by intragenic duplication of a primordial 2 TMS protein-encoding gene resembling the former. Using established statistical approaches, some of these families have been shown to be related by common descent. Seven superfamilies, including 21 of the 52 recognized families were identified. Conserved motif and Pfam analyses confirmed most superfamily assignments. These results serve to expand upon the scope of channel-forming bacterial holins.
1. Introduction
Endolysins are genome- or phage-encoded peptidoglycan degrading enzymes that are of at least four different types [1]. In general, these enzymes are made without targeting signal sequences characteristic of proteins exported via the general secretory pathway, also called the Sec translocase (see the Transporter Classification Database, TCDB; www.tcdb.org; TC# 3.A.5; [2]). They must therefore use an alternative method of export [3, 4]. These enzymes are produced fully folded in the cell cytoplasm and are exported via small transmembrane proteins called holins or hole formers because of their propensity to form large oligomeric flexible pores in the cytoplasmic membranes of bacteria [5]. Holins allow the autolysins to gain access to the cell wall, where they exert their actions by cleaving various bonds in the peptidoglycan polymer, depending on the type of endolysin [6, 7]. Genes encoding holin proteins and their target peptidoglycan hydrolases have been identified in a wide variety of Gram-negative and Gram-positive bacteria and their phage [3, 8–11]. It is not always clear whether access of autolysins to the cell wall results from secretion, leakage or membrane lysis, and this could depend on the type of holin [12]. As discussed by Wang et al. (2000) chromosomally-encoded holins may be xenologues of phagic origin, or alternatively, phage holins may be xenologues of chromosomal origin [3].
In an early report, Young and Blasi [1] grouped holins into eleven families which they believed were unrelated to each other, i.e., which were suggested to have evolved independently. However, it is extremely difficult to establish independent origin as sequence divergence can mask the common features that result from a common ancestry [13–15]. During our efforts to provide a comprehensive picture of the distribution and diversity of holins, we have identified 52 families of holins (see the Transporter Classification Database {TCDB; www.tcdb.org} [16, 17]). We have also developed sensitive methods that allow detection of distant phylogenetic relationships in proteins [13]. Using these approaches, we have identified relationships between 21 of the 52 TC holin families, creating superfamilies. We have also conducted topological, phylogenetic and motif analyses and demonstrated the presence of an internal duplication in one holin superfamily.
While the CDD (Conserved Domain Database) contains a substantial fraction of the Pfam collection, it does not have a clan system. Domain families imported from Pfam to CDD are referred to as ‘SuperFamilies’, but there is only a single level in the hierarchy. We have compared our superfamilies with the CDD and Pfam designations and suggested expansion of Pfam and CDD databases to include our findings, which Pfam has since incorporated.
2. Materials and Methods
2.1 Family identification and characterization
In this study, holins of the 52 families in TCDB were used as the query sequences for PSI-BLAST searches of the NCBI NR protein database in September, 2012 and again in January 2013. Searches were generally conducted without iterations [18]. Anywhere from one to five hundred homologous proteins were retrieved from the NCBI database in January 2013 for each of the families. Redundant and incomplete sequences were eliminated, and remaining selected proteins were retained for topological and phylogenetic analyses.
The CLUSTAL X program [19]and the Tree View program [20] were used, respectively, for multiple alignment of homologous sequences and construction of phylogenetic trees. The multiple alignments for the holins that comprise the seven superfamilies (I–VII) are presented in supplementary Figures S1A–S7A. Default parameters of the CLUSTAL X program were used. An alternative method of tree construction, dependent on tens of thousands of BLAST bit scores and obviating the need for construction of a multiple alignment, was the Superfamily Tree (SFT) program [21–23]. Previous publications have shown that these two programs give excellent agreement when sequences are sufficiently similar to generate reliable multiple alignments, but the SFT program is superior when proteins with more divergent sequences are analyzed. Bootstrap values for the seven superfamily trees are presented in supplementary Figures S1–S7.
Topological analyses of individual proteins were performed using the WHAT [24], HMMTOP [25] and Spoctopus [26] programs. Average hydropathy, amphipathicity and similarity plots were generated using the AveHAS program [27].
Motifs were identified using the hidden Markov model-based MEME program [28–30]. The MEME motif alignments for the 7 superfamilies are presented in supplementary Figures S1B–S7B while the conserved MEME motifs are shown in Figures S1C–S7C and bootstrap values for the phylogenetic trees are presented in the dendogram shown in Figures S1D–S7D.
2.2 Statistical approaches to homology establishment
Statistical sequence similarity comparisons between proteins, and between internal regions of these proteins, were conducted using the IC [31], GAP [32] and GSAT [33] programs. These programs randomly shuffle the sequences of the proteins or protein segments under scrutiny and compare these shuffled sequences with the native sequences. They thereby correct for abnormal protein compositions such as those that can occur in integral membrane proteins. Two thousand random shuffles and default settings have proven to be satisfactory for obtaining statistically significant values. A comparison score of 9 standard deviations [34] for comparable regions of the two proteins of at least 60 amino acyl residues (aas) has been reported to correspond to a probability of 10−27 that the observed degree of sequence similarity arose by chance [35]. Although the actual probability may be higher due to Gaussian skewing, this value has been considered sufficient to strongly suggest homology, while a value of 12.0 SD is considered sufficient to establish homology as described previously [14, 36–39]. Because holins are small proteins, higher percent identity values are required to obtain a specific comparison score. Identification of superfamily relationships (homology between families) was conducted using Protocol 1 and Protocol 2 [33] followed by confirmation with GSAT as described in detail in Results section 3.4.
2.3 Pfam/HMM analysis
We downloaded the latest version of TCDB from http://www.tcdb.org/public/tcdb, containing 8724 sequences, on February 16, 2013, parsed the file header in the FASTA file so that it only contained the TCDB id, e.g. 1.E.x.x.x, and had the complete sequence on the same line in lower case text. There were 268 sequences starting with 1.E, with no repeated names. The 268 sequences were saved in a separate location.
One sequence, the fusion protein, 1.E.40.5.1, was much longer than the others; it was removed, creating a set of 267 sequences. Most of the remaining sequences were approximately 70–100 aas long, but sometimes as short as 45 aas and sometimes as long as 220 aas.
The latest Pfam-A HMM collection from Pfam, ftp://ftp.sanger.ac.uk/pub/databases/Pfam/current_release/Pfam-A.hmm.gz, and the latest version of HMMER3, # HMMER 3.0 (March 2010); http://hmmer.janelia.org/ were obtained. A cutoff of 1e−20 was selected and used with the command HMMSEARCH to find which pre-existing Pfam families had matches to our sequence set at this particular cutoff.
We then exported the columns containing the TC numbers, identifying each sequence that had a hit containing Pfam family identifiers. The actual score was not recorded at this step. This table was then loaded into Cytoscape 3.0, a University of California-developed graph/network viewer. A total of 115 nodes and 98 edges were loaded. A force-directed layout was applied (Fig S8).
Based on trial and error, we determined that the cutoffs 1e−5 (and even 1e−4) resulted in a mapping highly similar to that obtained with the 1e−20 cutoff. At 1e−3, most clusters started merging together, so we examined trends observed at 1e−3 more closely.
To test how new HMMs that were trained on the Superfamily sequence sets from TCDB would perform, we used the HMMBUILD command in HMMER3, using the seven alignments in Stockholm format, presented in supplementary Figure S1A–S7A. A link on the Journal web page for the seven HMM files (one per superfamily) which can be downloaded, searched and used with the HMMER3 software has been provided. These seven new HMMs were used in searches of the full unaligned (not seed) sequence set of 17 Holin-related Pfam families using a cutoff of 1e−3.
2.4 Family and superfamily designations
Throughout the manuscript we shall use Arabic numbers for families and Roman numerals for superfamilies. Thus, holin families 1–42 correspond to TC#s 1.E.1 – 1.E.42, and the seven holin superfamilies are referred to as superfamilies I–VIII.
3. Results
3.1 Characteristics of currently recognized holin families and superfamilies
Table 1 lists the fifty two families of holins and putative holins present within the Transporter Classification Database (TCDB) as of March, 2013. These sequences are all available in TCDB at www.tcdb.org. TCDB includes relevant information including references describing these proteins and their functional characteristics when available. These families all fall into TC subclass 1.E, α-helical-type channel-forming holins. They are derived from bacteria, their phage and a few archaea. The table indicates the family TC# (Column 1) as well as the name and abbreviation of each family (column 2), which in general reflects the source and/or characteristics of the holins that comprise that family.
Table 1.
Characterization of holin families currently in TCDB.
| TCDB # | Family Name & Abbreviation | # of Sub-Families | Organismal Types | Average Protein Size (# of aas)1 | Predicted # of TMSs (Primary) | Family Size (# Protein s) | Superfamily Assignment | CDD Superfamily |
|---|---|---|---|---|---|---|---|---|
|
| ||||||||
| 1.E.1 | P21 Holin S (P21 Holin) | 1 | Proteobacteria | 71±5 | 2 | 430 | II | Lysis S Superfamily |
| 1.E.2 | λ Holin S (λ Holin) | 2 | Proteobacteria | 110±7 | 3 | 132 | III | Phage Holin3 Superfamily |
| 1.E.3 | P2 Holin (P2 Holin) | 2 | Proteobacteria Actinobacteria Archaea |
96±14 | 3 | 99 | III | Phage Holin2 Superfamily |
| 1.E.4 | LydA Holin (LydA Holin) | 1 | Proteobacteria Synergistetes |
105±11 | 3 | 29 | III | |
| 1.E.5 | PRD1 Phage P35 Holin (P35 Holin) | 3 | Proteobacteria | 112±9 | 3 | 33 | III | |
| 1.E.6 | T7 Holin (T7 Holin) | 2 | Proteobacteria | 77±21 | 1/2 | 46 | II | |
| 1.E.7 | HP1 Holin (HP1 Holin) | 2 | Proteobacteria | 77±3 | 1 | 57 | II | |
| 1.E.8 | T4 Holin (T4 Holin) | 1 | Proteobacteria | 210±11 | 1 | 64 | Phage HolinT Superfamily | |
| 1.E.9 | T4 Immunity (T4 Imm) | 1 | Firmicutes Actinobacteria Cyanobacteria Chlorobi Proteobacteria Bacterioides Acidobacteria Gemmatimonadetes |
101±26 | 2 | 161 | Imm Superinfect superfamily | |
| 1.E.10 | Bacillus subtilis ϕ29 Holin (ϕ29 Holin) | 1 | Firmicutes | 138±6 | 2 | 58 | IV | Phage Holin4 Superfamily |
| 1.E.11 | ϕ11 Holin (ϕ11 Holin) | 2 | Firmicutes | 97±38 | 2 | 227 | I | Phage Holin1 Superfamily |
| 1.E.12 | ϕAdh Holin (ϕAdh Holin) | 2 | Firmicutes | 135±11 | 1 | 17 | VI | |
| 1.E.13 | Firmicute phage ϕU53 Holin (ϕU53 Holin) | 1 | Firmicutes | 119±2 | 3 | 22 | ||
| 1.E.14 | LrgA Holin (LrgA Holin) | 1 | Proteobacteria Chloroflexi Firmicutes Fusobacteria Archaea |
129±16 | 4 | 485 | LrgA Superfamily | |
| 1.E.15 | ArpQ Holin (ArpQ Holin) | 1 | Firmicutes | 58±0 | 2 | 4 | ||
| 1.E.16 | Cph1 Holin (Cph1 Holin) | 1 | Firmicutes | 141±12 | 3 | 357 | IV | Phage Holin4 Superfamily |
| 1.E.17 | BlyA Holin (BlyA Holin) | 1 | Spirochetes | 66±1 | 1 | 34 | ||
| 1.E.18 | Lactococcus lactis Phage rlt Holin (rlt Holin) | 2 | Firmicutes Actinobacteria |
85±21 | 2 | 74 | ||
| 1.E.19 | Clostridium difficile TcdE Holin (TcdE Holin) | 4 | Firmicutes Actinobacteria Fusobacteria |
147±17 | 3 | 290 | IV | Phage Holin4 Superfamily |
| 1.E.20 | Pseudomonas aeruginosa Hol Holin (Hol Holin) | 1 | Proteobacteria | 143±43 | 3 | 98 | III | |
| 1.E.21 | Listeria Phage A118 Holin (Hol118 Holin) | 2 | Firmicutes Chloroflexi Actinobacteria |
97±10 | 3 | 66 | V | Phage Holin5 Superfamily |
| 1.E.22 | Neisserial Phage-associated Holin (NP-Holin) | 1 | Proteobacteria | 49 | 1 | 22 | ||
| 1.E.23 | Bacillus Spore Morphogenesis and Germination Holin (BSH) | 2 | Firmecutes | 89±3 | 3 | 16 | ||
| 1.E.24 | Bacteriophage Dp-1 Holin (DP-1 Holin) | 3 | Firmicutes Actinobacteria |
78±9 | 2 | 84 | ||
| 1.E.25 | Pseudomonas Phage F116 Holin (F116 Holin) | 2 | Proteobacteria | 87±7 | 2 | 196 | II | |
| 1.E.26 | Holin LLH (Holin LLH)1 | 4 | Firmicutes | 130±26 | 1 | 99 | VI | Holin LLH Superfamily DUF 4407 |
| 1.E.27 | BlhA Holin 2(BlhA Holin) | 1 | Firmicutes | 72±6 | 1 | 119 | DUF2762 | |
| 1.E.28 | Phage Mu1/6 Holin (Mu1/6 Holin) | 2 | Actinobacteria | 85±3 | 2 | 143 | Superfamily | |
| 1.E.29 | Holin Hol44 (Hol44) | 2 | Firmicutes | 101±22 | 3 | 65 | V | Phage Holin5 Superfamily |
| 1.E.30 | Vibrio Holin (Vibrio-Holin) | 1 | Proteobacteria (Vibrio) | 56±8 | 1 | 8 | ||
| 1.E.31 | SPP1 Holin (SPP1 Holin) | 3 | Actinobacteria Firmicutes |
93±22 | 2 | 167 | Holin Spp1 Phage Holin Superfamily |
|
| 1.E.32 | Actinobacterial 1 TMS Holin (A-1 Holin) | 2 | Actinobacteria | 108±6 | 1 | 37 | ||
| 1.E.33 | 2 or 3 TMS Putative Holin (2/3 Holin) | 1 | Actinobacteria | 98±14 | 2 | 7 | DUF 4063 DUF 4063 Superfamily |
|
| 1.E.34 | Actinobacterial Holin-X (Hol-X) | 1 | Actinobacteria | 159±30 | 2 | 28 | III | |
| 1.E.35 | Mycobacterial I TMS Phage Holin (M1 Hol) | 1 | Actinobacteria | 84±7 | 1 | 37 | ||
| 1.E.36 | Mycobacterial 2 TMS Phage Holin (M2 Hol) | 6 | Actinobacteria | 112±38 | 2 | 34 | VII | |
| 1.E.37 | Phage T1 Holin (T1 Holin) | 1 | Proteobacteria | 63 ±8 | 1 | 12 | ||
| 1.E.38 | Staphylococcus Phage P68 Holin (P68 Hol) | 1 | Firmicutes | 92 | 2 | 23 | ||
| 1.E.39 | Mycobacterial Phage PB11 Holin (GP36 Hol) | 1 | Actinobacteria | 116 | 2 | 35 | ||
| 1.E.40 | Mycobacterial 4 TMS Phage Holin (MP4 Holin) | 4 | Firmicutes | 173±149 | 2 | 7 | IV | COG1950 DUF360 |
| 1.E.41 | Deinococcus/Thermus Holin (D/T-Hol) | 1 | Deinococcus/Thermus | 108 | 3 | 11 | ||
| 1.E.42 | Putative Holin-like Toxin (Hol-Tox) | 1 | Firmicutes Actinobacteria |
34 | 1 | 44 | ||
| 1.E.43 | Transglycosylase associated Holin (T-A Hol) | 2 | Firmicutes Proteobacteria Actinobacteria Planctomycetes Deinococcus/Thermus Archaea Thermobacteria |
111±24 | 3 | 500 | PRK 10457 Transgly assoc Superfamily | |
| 1.E.44 | Lactococcus lactis Holin (LLHol) | 1 | Firmicutes | 70±12 | 2 | 5 | ||
| 1.E.45 | Xanthomonas Phage Holin (XanPHol) | 1 | Proteobacteria | 64 | 2 | 3 | ||
| 1.E.46 | Prophage Hp1 Holin (Hp1 Hol) | 1 | Firmicutes | 69 | 1 | 4 | ||
| 1.E.47 | Caulobacter Phage Holin (CauHol) | 1 | Proteobacteria | 158±1 | 2 | 41 | ||
| 1.E.48 | Enterobacterial Holin (EBHol) | 1 | Proteobacteria | 106±2 | 1 | 26 | ||
| 1.E.49 | Treponema 4 TMS Holin (Tre4Hol) | 1 | Spirochetes | 105±5 | 4 | 18 | ||
| 1.E.50 | β-Proteobacterial Holin (BP-Hol) | 1 | Proteobacteria | 87±33 | 2 | 120 | II | Tryp SPc Superfamily |
| 1.E.51 | Listeria Phage Holin (LP-Hol) | 1 | Firmicutes | 41 | 1 | 14 | ||
| 1.E.52 | Flp/Fap Pilin Putative Holin (FFPP-Hol) | 3 | Proteobacteria | 69±16 | 1 | 75 | Flp/Fap Superfamily | |
Average size in number of amino acyl residues ± standard deviation (S.D.). No S.D. value is assigned when only a single protein was present in a family at the time of analysis.
Column 3 indicates the number of subfamilies identified within each of these families, while column 4 presents the organismal phyla from which members of these families were derived. Many of these families are found within a single bacterial phylum, but several exceptions exist. Members of family 1.E.3 are found in Proteobacteria, Actinobacteria and Archaea, while members of family 1.E.4 are found in Proteobacteria and Synergistetes. Family 1.E.9 is found in a large number of bacterial phyla, but these proteins, which function as immunity proteins to superinfection [40], have not been shown to function by a holin-type mechanism. Their topological features and sizes render them ‘holin-like’ as noted previously [40]. Whether or not their modes of action involve pore formation has yet to be determined. Family 1.E.14 is found in four bacterial phyla as well as Archaea. Three families, families 18 (1.E.18), 24 (1.E.24) and 31 (1.E.31), are found in two Gram-positive bacterial phyla, the Firmicutes and the Actinobacteria. Family 19, in addition to being derived from these two phyla, has members from Fusobacteria, while family 21 also has members from Chloroflexi. Thus, of the fifty two currently recognized holin families listed in TCDB, twelve derive from more than one phylum, fifteen derive from Proteobacteria, fifteen derive from Firmicutes, seven derive from Actinobacteria two derive from Spirochaetes and one derives from Deinococcus. The fact that so many families are restricted to a single phylum, and the observation that the remaining families are not wide spread in bacterial phyla strongly suggests that horizontal transfer of holin genes between phyla has occurred to a very limited extent.
Column 5 indicates the average size of the holins in each of the families ± standard deviations [34]. The values for the different families range from 34 amino acyl residues (aas) for firmicute and actinobacterial family 42 to 210 aas for proteobacterial family 8. All other families have sizes that fall within these extremes. The numbers of TMSs predicted for predominant members of the various families are presented in column 6. These proteins have between 1 and 4 TMSs, with the majority having 2 or 3 TMSs. Usually, all members of a family are predicted to have the same number of TMSs, but occasionally one or more members are predicted to have numbers that differ from those of other members. These predictions will be considered in more detail below.
Column 7 presents an estimate of the sizes (number of members) of the various families based on PSI-BLAST searches of the NCBI non-redundant protein database in January 2013. These searches were conducted without iterations. The use of iterations would undoubtedly reveal additional, more distantly related family members. However, they would also bring up members of other families within superfamilies. Further, the “non redundant” NCBI protein database is redundant. Consequently the values reported give estimates of the relative sizes of the various families. Based on these BLAST searches, family sizes vary from as few as one protein to as many as 485 proteins. Eighteen families have between fifty and two hundred members, but twenty eight families have less than fifty members while six families have more than two hundred members. Based on these criteria, there is a greater than one hundred-fold difference in family sizes.
As will be described in greater detail in section 3.4, we have been able to assign many of the holin families to seven superfamilies (Table 1, column 8 and Table 2), which we have designated with roman numerals. Whenever possible, we have used the same superfamily designations as recorded in the NCBI Conserved Domain Database (CDD) (column 8). However, two CDD superfamilies proved to fall into our Superfamily III, and several families that are found to belong to a CDD superfamily did not have superfamily status in TCDB. They instead comprised single families. Many holins were not recognized as holins by CDD, and many of our holin families are not recognized by CDD. Instead, CDD often reports that “no putative conserved domains have been detected”. In such cases, column 8 is left blank. In still other cases, some members of a superfamily were recognized by CDD while others were not. We have communicated the results of our studies to Pfam, which has largely adopted our system of classification.
Table 2.
Characteristics of holin superfamilies.
| Holin Superfamily | Characteristics of Holin Superfamilies | |||
|---|---|---|---|---|
|
| ||||
| FAMILIES | Organismal Types | Average size | # of TMSs | |
|
| ||||
| I | 1.E.11 | Firmicutes | 97±38 | 2 |
| II | 1.E.1 | 78±14 | 1/2 | |
| 1.E.6 | Proteobacteria | |||
| 1.E.7 | ||||
| 1.E.25 | ||||
| III | 1.E.2 | Proteobacteria | 114±23 | 2/3 |
| 1.E.3 | Actinobacteria | |||
| 1.E.4 | Archaea | |||
| 1.E.5 | Synergistetes | |||
| 1.E.20 | Deinococcus/Thermus | |||
| 1.E.34 | ||||
| 1.E.41 | ||||
| IV | 1.E.10 | Fermicutes | 156±94 | 2/3/4 |
| 1.E.16 | Actinobacteria | |||
| 1.E.19 | Fusobacteria | |||
| 1.E.40 | ||||
| V | 1.E.21 | Firmicutes | 98±17 | 3 |
| 1.E.29 | Chloroflexi | |||
| Actinobacteria | ||||
| VI | 1.E.12.1.2 | Firmicutes | 132±21 | 1 |
| 1.E.26.1.8 | ||||
| VII | 1.E.36 | Actinobacteria | 112 ± 38 | 2/4 |
TC Family 1.E.11 comprises superfamily I, corresponding to the CDD phage holin I superfamily. This is a large and diverse family with two hundred and twenty seven members (Table 1, column 7), all from firmicutes. These proteins have an average size of 97 ± 38 amino acids (aas). This standard deviation value reveals an unusually large degree of size variation within this superfamily. All of these proteins without exception are predicted to have two TMSs.
Superfamily II includes four TC families, families 1, 6, 7 and 25. All four of these families are derived from Proteobacteria and are predicted to have 1 or 2 TMSs. Their members are of relatively small sizes, from 68 aas to 100 aas. Except for family six, the standard deviation values indicate little size variation within each of these families. The average size for the entire superfamily is 78 ± 14 aas. Families 1 and 6 in superfamily II are recognized by CDD as Lysis S and PHA00426 superfamilies, respectively, while families 7, and 25 lack recognized conserved domains.
Superfamily III, derived from proteobacteria, synergistetes, actinobacteria, Deinococcus and archaea, includes seven TC families, families 2, 3, 4, 5, 20, 34 and 41. Except for family 34, members of which appear to have two TMSs, proteins of superfamily III have three putative TMSs. The missing TMS in family 34 proteins is the N-terminal TMS as revealed by multiple alignments (see supplementary Figures S3A–C). These seven families have average sizes of 110, 96, 105, 112, 143, 159 and 108 aas, respectively. It is surprising that the only family with members predicted to have just two TMSs is the one containing the largest homologues. This is due to hydrophilic extensions. Different family members of superfamily III had been designated by CDD as belonging to the phage holin3 superfamily (TC Family 1.E.2), the phage holin2 superfamily (TC Family 1.E.3) and the SH3 superfamily (1.E.20). All other superfamily III families established here were not represented by a CDD designation. As CDD (which incorporates information from Pfam) reported “no putative conserved domains have been detected”, it was clear that our Protocol1/Protocol2 approach [33] detected more distant relationships than recognized by CDD or Pfam. Three families (1.E.4, 1.E.5 and 1.E.41) within this superfamily were not recognized as having conserved domains by CDD. The average size of proteins in the entire superfamily is 114 ± 23 aas.
Superfamily IV includes four TC families, including members from Firmicutes, Actinobacteria and Fusobacteria. Their average sizes are: family 10, 138 ± 6 aas; family 19, 149 ± 15; family 16, 141 ± 12, and family 40, 173 ± 149 aas. Thus, there is very little size variation among family members, except for family 40, which has members larger than the other proteins in this superfamily. All members of families 10 and 19 and many members of family 16 appear to have 3 TMSs, but some members of this last family are predicted to have 4 TMSs. The extra TMS in these proteins is at their N-termini. Some members of families 10, 16 and 19 in Superfamily IV are designated as the Phage Holin-4 superfamily by CDD. Some members of family 40 are designated as the DUF360 superfamily by CDD.
Superfamily V includes 1.E.21 and 1.E.29, both possessing members from Firmicutes, Actinobacteria and Chloroflexi. These proteins all appear to have 3 TMSs and have average sizes of 97 ± 10 and 101 ± 20 aas, respectively. Two members of family 21 (1.E.21.1.2 and 1.E.21.2.1), but not others, and a single member of family 29 (1.E.29.2.3), had designations suggesting membership in the CDD Phage Holin5 superfamily.
Superfamily VI includes families 1.E.12 and 1.E.26, both including members only from Firmicutes. These proteins appear to have one N-terminal TMS, followed by an amphipathic, weakly hydrophobic peak that was not predicted to be transmembrane by the topological programs we have used (see Methods). This issue will be discussed further below. The average sizes of the members of these two families are 135 ± 11 and 130 ± 26 aas, respectively. All members of family 26 except 1.E.26.2.2 have the Holin LLH superfamily designation in CDD, and a single member of family 12 (12.2.1) has a CDD designation as a member of the DHQ Fe-ADH superfamily.
Superfamily VII includes family 1.E.36, which has six subfamilies, all distantly related to each other. There was also some indication that this family could be related to families 1.E.31 and 1.E.33, but using our standard criteria for homology, this suggestion could not be confirmed with confidence. As presented in Table 1, these three families share the characteristics that they consist of members that are of about the same sizes and have 2 TMSs. The exception is subfamily 6 (TC# 1.E.36.6), which includes proteins displaying 4 putative TMSs although one of these proteins is reported to have just 3.
We wanted to understand the relationships between the proteins in family 36 predicted to have 2 TMSs and those predicted to have 4 TMSs. TC-BLAST searches revealed the following. Residues 19 through 75, encompassing TMSs 1-2 of the 4 TMSs in TC# 1.E.36.6.3, aligned with residues 9-63, encompassing TMSs 1-2 of the 2 TMSs in 1.E.36.2.4. The alignment gave 37% identity, 47% similarity and one gap with a comparison score using GSAT of 10.2 SD. Residues 60-110, encompassing TMSs 3-4 of the 4 TMS 1.E.36.6.2 protein, aligned with residues 14-64 encompassing TMSs 1-2 of the 2 TMS 36.2.1 protein to give 43% identity, 55% similarity, 0 gaps and a comparison score of 11.3 SD. 1.E.36.6.2 aligned with 1.E.36.6.3 throughout all four TMSs to give 34% identity, 54% similarity and 3 gaps with a comparison score of 12.1 SD. Residues 17-67, encompassing TMSs 1-2 in 1.E.36.2.1, aligned with residues 14-64, encompassing TMSs 1-2 in 36.2.4 with 59% identity, 77% similarity and no gaps with a comparison score of 22.2 SD. These results are sufficient to establish homology between TMSs 1-2 in 36.2.1, 36.2.4, 36.6.2 and 36.6.3 as well as TMSs 3-4 in both 36.6.2 and 36.6.3. Thus, these results establish that a 2 TMS precursor protein duplicated internally to give rise to the 4 TMS proteins in subfamily 36.6, and that the same precursor gave rise to the 2 TMS homologues in subfamily 36.2. Since the proteins in subfamily 36.2 are homologous to the proteins in other family 36 subfamilies, it can be concluded that all of these proteins share a common 2 TMS ancestry.
A multiple alignment showing all of these sequences is presented in Figure 1. The sequences shown for proteins 36.2.1 and 36.2.4 encompass the entirety of TMSs 1-2 in these 2 TMS proteins. The sequences for 36.6.2.2 and 36.6.3.2 encompass the entirety of TMSs 3-4 in these two 4 TMS proteins, and the sequences shown for 36.6.2.1 and 36.6.3.1 encompass the entirety of TMSs 1-2 in the same proteins. Striking similarities are observed. For example, with no gaps in the alignment, four residues are fully conserved in all members included in the multiple alignment (Figure 1). These are an R at alignment position 4, a Y at position 8, L at position 18, and A at position 45. Additionally, only conservative substitutions occur at five positions. Other similarities are also worthy of note. For example, at position 12, only G, S and T occur; at position 22, G occurs in all but one of the sequences. At position 29, A occurs in all but one of the sequences. At position 31, L occurs in all but one of the sequences. Other striking similarities can also be observed throughout the alignment. These results provide further substantiation for the conclusion that all of these sequences share a common evolutionary origin, and therefore, that the 4 TMS proteins in subfamily 36.6 arose by an intragenic duplication.
Figure 1.
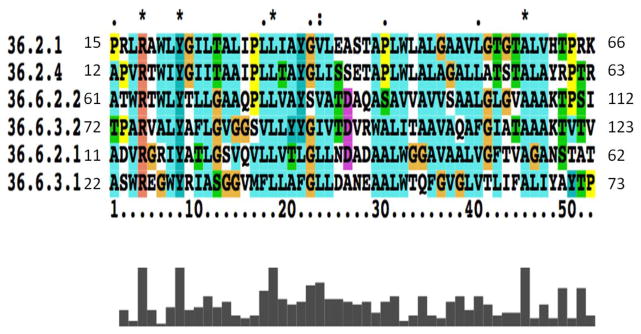
Alignment of the 2 TMS repeats in 4 TMS members of TC subfamily 1.E.36.6 with 2 TMS segments of 2 TMS members of TC subfamily 1.E.36.2. Residue numbers are indicated at the beginning and end of each line. The TC number without the subclass designation 1.E., is indicated followed by a one (first half) or a 2 (second half) for the two 4 TMS proteins.
One protein in subfamily 36.6 was predicted to have 104 aas and 3 TMSs. This protein, Gp16 from Mycobacterium phage Phaedrus (B5A6C5), was subjected to an NCBI BLAST search. The results revealed that the genome of Mycobacterium phage Daisy encodes an identical protein, Gp17, except that it possesses an additional N-terminal 40 residues. In fact, five other closely related mycobacterial phage encode homologues that start at the same position as the phage Daisy protein. Examination of the DNA sequence encoding the phage Phadrus homologue revealed that the wrong initiation codon had been selected and and that this protein also has 4 TMSs. Consequently, this protein was replaced by the phage Daisy protein in TCDB (1.E.36.6.1). All members of subfamily 1.E.36.6 are thus 4 TMS proteins, having the two TMS internal duplication noted above. Members of this family have no superfamily designation in CDD.
3.2 Mapping holins to Pfam-A
Mapping of 267 TCDB sequences to Pfam-A resulted in a graph containing 115 nodes and 98 edges. To our surprise, none of the Pfam families present were organized into clans, presumably because the short sequence lengths resulted in disqualification in the automated clan definition pipeline. Our clusters, using the cutoff of 1e−20, were in excellent agreement; they did not display TCDB Superfamily mixing within the same cluster (Figure S8).
Since no clans have been defined in Pfam, we proposed the following three new clans: PF05105 and PF04020 are representative of Holin SuperFamily IV; PF05106, PF04550 and PF07332 are representative of Holin SuperFamily III, and PF10746 and PF04971 are representative of Holin SuperFamily II.
In total, 17 Pfam families were mapped. They had the following annotations: PF05105 = Phage_holin_4; PF03788 = LrgA; PF05106 = Phage_holin_3 and Lysis protein S; PF04531 = Phage_holin_1; PF04020 = DUF360; PF14373 = Superinfection immunity protein; PF11031 = Phage_holin_T; PF04550 = Phage_holin_2; PF04688 = Phage_holin; PF04971 = Lysis_S; PF05102 = Holin_BlyA; PF13272 = DUF4063; PF10960 = DUF2762; PF10746 = Phage_holin_6; PF07332 = DUF1469; PF09682 = Holin_LLH; PF06946 = Phage_holin_5.
Repeating the exercise at e−4, we obtained a mapping with 180 edges, and at e−3, 319 edges. It is possible to arrange the e−3 graph in a planar way and map some nodes previously not placed in Superfamilies (SF) in TCDB, such as 1.E.39.1 which is similar to 1.E.34s in SF III or 1.E.31.1.4 and 1.E.31.2.4 which are similar to 1.E.11 proteins in SF I. Furthermore, PF12042 links 1.E.11s (SF I) to 1.E.26s (SF VI), and PF07690 (MFS) links 1.E.21/29s (SF V) to 1.E.1s (SF II), and PF12730 (ABC2 Family Transporter) links 1.E.5s (SF III) with 1.E.36s (SF VII). However, these relationships are detected after the point where extensive merging of clusters occurs, via apparently unrelated Pfam families representing other transporter proteins. Thus, these proposed relationships are unreliable.
Table 4 shows that the specificity of our TCDB HMMs is high, since using the permissive cutoff of e−3 resulted in specific matching of large fractions of Pfam’s different sequence sets. We propose to rename the DUF (Domain Unknown Function) family PF04020 to Phage_holin_4b, based on its matching pattern. Furthermore, we propose to rename Phage_holin_2 to Phage_holin_3b, to rename Lysis_S to Phage_holin_2, to rename Phage_holin_6 to Phage_holin_2b, and to rename Holin_LLH to Phage_holin_6. These proposals have been adopted by Pfam.
Table 4.
Proposed renaming in Pfam based on TCDB superfamilies.
| Comparison with Superfamilies in TCDB | ||||||||||
|---|---|---|---|---|---|---|---|---|---|---|
|
| ||||||||||
| Current Name | Proposed Name Change in Pfam | # of Sequences in Pfam | I | II | III | IV | V | VI | VII | |
|
| ||||||||||
| PF05105 | Phage Holin 4 | 684 | 98% | |||||||
| PF03788 | LrgA | 2148 | 0.09% | |||||||
| PF05106 | Phage Holin 3 | 388 | 99% | 0.26% | ||||||
| PF04531 | Phage Holin 1 | 340 | 0.59% | |||||||
| PF 04020 | DUF | Phage Holin 4(B) | 1023 | 68% | ||||||
| PF 14373 | Superinf. | 182 | ||||||||
| PF 11031 | Phage Holin T | 38 | ||||||||
| PF 04550 | Phage Holin 2 | Phage Holin 3(B) | 107 | 100% | ||||||
| PF 04688 | Phage Holin | 214 | ||||||||
| PF 04971 | Lysis S | Phage Holin 2 | 563 | 98% | ||||||
| PF 05102 | Bly A | 78 | ||||||||
| PF 13272 | DUF | 87 | ||||||||
| PF 10960 | DUF | 141 | ||||||||
| PF 10746 | Phage Holin 6 | Phage Holin 2(B) | 47 | 100% | ||||||
| PF 07332 | DUF | 1158 | 24% | |||||||
| PF 09682 | Holin LLH | Phage Holin 6 | 148 | 94% | ||||||
| PF 06946 | Phage Holin 5 | 35 | 6% | 100% | ||||||
3.3 Topological analysis of holins not included in superfamilies
AveHAS plots were generated for each family with more than one member not included in the superfamilies noted above. Family 8 displayed a single peak of hydrophobicity near the N-terminal end of the alignment, followed by a long hydrophilic region. This region proved to be even better conserved than the putative TMS. It also exhibited several peaks of amphipathicity.
Family 13 showed three peaks of hydrophobicity, the first two being narrow and the third being broad. Only the third peak exhibited substantial amphipathicity, which peaked just to the right of the hydrophobic peak. Peak 1 was best conserved followed by peaks 2 and 3.
Family 14 showed four hydrophobic peaks where the odd numbered peaks were smaller than the even numbered peaks. Peak 2 was best conserved followed by peaks 3, 4 and 1. Only peak 1 showed appreciable amphipathicity.
Family 17 showed a single broad peak of hydrophobicity corresponding to a trough of amphipathicity. Shallow peaks of similarity flanked this hydrophobic region. While a single peak of hydrophobicity was observed, it is possible that this hydrophobic peak corresponds to the first of two TMSs with the second being minimally hydrophobic but more strongly amphipathic.
Family 18 showed two peaks of hydrophobicity corresponding to two peaks of amphipathicity. The peak of amphipathicity corresponding to the first peak of hydrophobicity was skewed slightly to the left whereas the second one was skewed slightly to the right. Two clear peaks of similarity corresponding to the two peaks of hydrophobicity were also observed, but the first peak of similarity was slightly to the left of the hydrophobic peak.
Family 23 showed three hydrophobic peaks with no corresponding amphipathic or similarity peaks. However, peak 1 was somewhat better conserved than peaks 2 and 3 while peak 3 appeared to be somewhat more amphipathic than peaks 1 and 2.
Family 24 exhibited two clear hydrophobic peaks with corresponding amphipathic peaks slightly to the left. Two similarity peaks were also observed, the first similarity peak slightly to the left, and the second slightly to the right of the hydrophobic peaks.
The short proteins that comprise family 27 show a single N-terminal hydrophobic peak of low amphipathicity. This peak is the most conserved region of these proteins. The C-terminal portion of these proteins revealed a peak of moderate hydrophobicity with increased amphipathicity relative to peak 1 and a shallow peak of average similarity.
The AveHAS plot for family 28 revealed two peaks of hydropathy with equal degrees of amphipathicity and similarity. As noted above for the other 2 TMS holin families, a moderate peak of similarity preceded peak 1 and followed peak 2. These proteins showed an average size of 85 ± 3 aas. Their properties are similar to those of families 31, 33, 38 and 39. They exhibit similar hydrophobicity plots. Their average sizes are 93, 98, 92 and 116 aas, respectively. Based on these observations it is possible that these families are related although we could not demonstrate this possibility using our rigorous statistical criteria.
Families 30, 32, 35 and 37 exhibited similar topological features. Family 30 proteins exhibited a single peak of hydrophobicity at the beginning of the AveHAS plot and a substantial peak of amphipathicity in a hydrophilic region following the one putative TMS. This latter region is the best conserved portion of these proteins. The AveHAS plots for family 32 also revealed a single N-terminal peak of hydrophobicity. This was followed by three striking peaks of amphipathicity, the third of which corresponded to a peak of moderate hydrophobicity. Only the first peak was predicted to be transmembrane, but this peak was not as well conserved as the downstream amphipathic region. Family 35 similarly showed a single N-terminal peak of hydrophobicity followed by an extended region of hydrophilicity with appreciable amphipathic character. The greatest region of similarity occurred in the central portions of these proteins. Finally, family 37 was similar, showing a single peak of hydrophobicity, uniform average amphipathicity and gradual increases in similarity when progressing from left to right. Based solely on these observations, it is reasonable to suggest that these four families share a common ancestry.
Family 43 proteins exhibited three peaks of hydrophobicity with uniform average amphipathicity, and peak 1 showed the greatest conservation, while peak 3 showed the least conservation. AveHAS plots of family 44 revealed two peaks of hydrophobicity, with two overlapping peaks of amphipathicity slightly to the right of the hydrophobic peaks. The first peak was more hydrophobic and better conserved than the second peak. Proteins in family 47 exhibited two hydrophobicity peaks with substantial peaks of amphipathicity preceding hydrophobic peak 1 and following hydrophobic peak 2. The two peaks were about equally conserved. The AveHAS plot for family 48 proteins revealed a very slight peak of hydrophobicity at their N-termini with appreciable amphipathic character followed by a much more substantial C-terminal hydrophobic peak with some amphipathic character to its left. It seems most likely that these proteins have a single C-terminal TMS. The similarity plot was flat. Proteins in family 49 exhibited four hydrophobic peaks, no corresponding peaks of average amphipathicity and a flat plot of average similarity. Peaks 1 and 2 were close to each other as were peaks 3 and 4. Family 50 proteins exhibited two hydrophobic peaks without distinctive amphipathic character. Peak 2 was better conserved than peak 1. Family 52 proteins showed a single peak of hydrophobicity followed by an amphipathic peak. The similarity plot suggested that the hydrophobic peak was not better conserved than the hydrophilic portions of the proteins.
In summary, we have defined seven superfamilies of holins, each with distinctive characteristics of family size, protein size, probable topology, and organismal distribution. We have also conducted similar analyses on the holin families that are not included in superfamilies. These last analyses provide clues as to possible distant relationships that cannot be established using standard statistical approaches and our current criteria for homology.
3.4 Establishment of homology between families for the formulation of superfamilies
Members of the 52 families were compared with each other using a variety of programs. First, the proteins in TCDB were compared using TC-BLAST, which sometimes brought up members of other holin families. For example, when 1.E.1.1.6 was compared with 1.E.7.1.2, a binary sequence alignment was obtained that gave 35.7% identity and 59.0% similarity with an e value of e−5 for a stretch of 100 alignment positions. Second, when binary comparisons looked promising, comparison scores were calculated using GSAT (28; see Methods). For example, when GSAT was run for the two proteins noted above (1.1.6 and 7.1.2) with 2,000 random shuffles, a comparison score of 14.5 SD was obtained, a value sufficient to establish homology. This alignment is shown in Figure 2. Third, if comparison scores were insufficient to strongly suggest homology, Protocol 1 was used to retrieve homologues of the two query sequences using NCBI PSI-BLAST with one or two iterations followed by comparison of all retrieved sequences in one list with those in the other list using Protocol 2 [33]. Fourth, top scores obtained with Protocol2 were confirmed using GSAT with 2,000 random shuffles. When adequate values were obtained, the two sequences compared by Protocol2 were then compared with the original query sequences from TCDB using GSAT with 2,000 random shuffles. Only if all three values exceeded 9 SD did we conclude that strong evidence for homology was available, and only if all three values exceeded 12 SD did we conclude that homology was established (See below and Figure 3).
Figure 2.
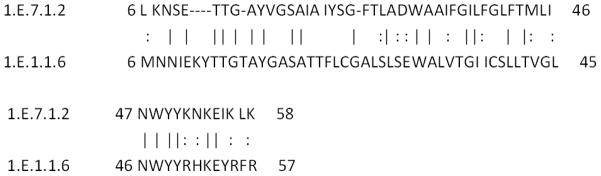
Alignment of TC 1.E.7.1.2 (the HP1 Holin family) with 1.E.1.1.6 (the P21 Holin family). This alignment gave 15 SD using the GSAT program with default settings and 2000 random shuffles [33]. Numbers preceding and following each line refer to the residue numbers in each of the two proteins compared. Vertical lines = identities; colons = similarities
Figure 3.

Alignments of the two sequences described in Table 3, 1.E.4.1.1 and 1.E.5.2.1, but compared with closer homologues. Comparison scores were: (A) 17 SD, (B) 13 SD and (C) 27 SD (Table 3). When the original two sequences were compared, a value of 2 SD was obtained (Table 3). This figure illustrates the use of the superfamily principle to establish homology between two distantly related proteins. The convention of presentation is as for Figure 2.
An example of this procedure is shown in Figures 3A–3C, and the results of these comparisons and others are summarized in Table 3. Protocol 1 retrieved Eco5 when the query sequence was 1.E.4.1.1. The alignment obtained between these two proteins is shown in Figure 3A and gave a comparison score of 17 SD. The comparison of Eco5 with a protein retrieved by Protocol 1 when 1.E.5.2.1 was the query sequence, Par1, is shown in Figure 3B. This comparison gave 13 SD. Finally, when Par1 was compared with 1.E.5.2.1, the alignment shown in Figure 2C was obtained, yielding 27 SD. When we compared 1.E.4.1.1 with 1.E.5.2.1 directly, the comparison score was only 2 SD which is insufficient to establish homology. The conclusion of homology using this approach depends on the superfamily principle which states that if A is homologous to B, B is homologous to C, and C is homologous to D, then A must be homologous to D. Note that homology by definition means derived from a common origin and does not imply a specific degree of sequence similarity between A and D. The results summarized in Table 3 provide the basis for the conclusion that our studies have defined the TC family compositions of Superfamilies I through VII as discussed above.
Table 3.
Comparison scores for TC families that comprise holin superfamilies.
| Proteins Compared | Comparison Score (S.D.) | |||||||
|---|---|---|---|---|---|---|---|---|
|
| ||||||||
| Superfamily | Protein-1 (A) | Protein-2 (B) | Protein-3 (C) | Protein-4 (D) | A vs. B | B vs C | C vs. D | A vs. D |
|
| ||||||||
| II | 1.E.1.1.6 | Sgl1 | Orf1 | 1.E.7.1.2 | 28 | 30 | 16 | 15 |
| II | 1.E.1.1.1 | Psa1 | Ppu1 | 1.E.25.1.1 | 14 | 46 | 32 | 13 |
| II | 1.E.7.2.1 | Ade2 | Asp1 | 1.E.25.1.5 | 10 | 55 | 14 | 10 |
| II | 1.E.6.1.1 | Eph2 | Eba1 | 1.E.7.1.1 | 18 | 11 | 12 | 11 |
| II | 1.E.1.1.1 | Cfr1 | Orf1 | 1.E.6.1.1 | 9 | 11 | 20 | −1 |
| III | 1.E.3.1.1 | Ykr2 | Pal1 | 1.E.5.1.2 | 26 | 12 | 43 | 6 |
| III | 1.E.5.1.1 | Ssp1 | Ppu2 | 1.E.20.1.1 | 24 | 11 | 35 | 3 |
| III | 1.E.2.2.3 | Eph1 | Bph1 | 1.E.5.2.4 | 61 | 13 | 62 | 10 |
| III | 1.E.4.1.1 | Eco5 | Par1 | 1.E.5.2.1 | 17 | 13 | 27 | 2 |
| III | 1.E.5.1.5 | 1.E.41.1.1 | 8 | |||||
| III | 1.E.34.1.1 | Ppu2 | Pac2 | 1.E.20.1.1 | 36 | 7 | 6 | 9 |
| IV | 1.E.19.4.1 | Lsa4 | Nho1 | 1.E.40.4.3 | 61 | 11 | 61 | 4 |
| IV | 1.E.10.1.2 | Pan1 | Efa7 | 1.E.19.1.8 | 38 | 43 | 18 | 11 |
| IV | 1.E.16.1.1 | Efa1 | Cph1 | 1.E.19.1.2 | 16 | 13 | 71 | 11 |
| IV | 1.E.10.1.1 | Esp1 | Spy1 | 1.E.16.1.1 | 19 | 9 | 16 | 1 |
| V | 1.E.21.1.3 | Lin1 | Lga1 | 1.E.29.1.1 | 58 | 14 | 15 | 7 |
| VI | 1.E.12.2.3 | Lcr2 | Lho1 | 1.E.26.4.1 | 79 | 39 | 9 | 6 |
| VII | 1.E.33.1.4 | Mab2 | Mph1 | 1.E.36.1.5 | 11 | 13 | 11 | 5 |
These values are insufficient to establish that family 40 is a member of superfamily IV.
3.5 Conserved Sequence Motifs Characteristic of Superfamilies
Relying on the ClustalX multiple alignments (Figures S1A–S7A), the MEME program was used to identify the most conserved motif in each superfamily and to determine if these motifs were shared by members of the families that comprise these superfamilies. The results are summarized in Figures S1B–S7B as well as Figures S1C–S7C. In Figures S1C–S7C, the consensus weighted motifs are presented with all residues shown with letter sizes proportional to their numbers at a specific position in the alignment, while the alignments upon which these motifs are based are shown in Figures S1B–S7B. The most conserved motif recognized by MEME for Superfamily I encompasses all of TMS 1 as well as the preceding hydrophilic region and is 27 aas long. The R at position 7 is fully conserved in all sequences examined (all members of the superfamily included in TCDB). This motif was identified in members of both subfamilies of this superfamily.
The conserved motif for Superfamily II (Figures S2B and S2C) was identified in members of all four families (families 1, 6, 7 and 25) that comprise this superfamily. This motif includes TMS 2 plus the C-terminal hydrophilic region. No residue is fully conserved in all of the proteins included in this study, but only F and Y occur at position 15.
The most conserved motif for Superfamily III was identified in all seven families (families 2, 3, 4, 5, 20, 34 and 41) (Figures S3B and S3C). This motif encompasses TMS 3 and is strongly hydrophobic. No residue is fully conserved, but in four positions G and A predominate.
The Superfamily IV motif (Figures S4B and S4C) includes most of TMS 3 plus the following hydrophilic region. Four residues are fully or nearly fully conserved, an S, an N, a G and a P. This motif was identified in families 10, 16 and 19 but not 40.
Superfamily V includes families 21 and 29. The consensus sequence for the most conserved motif (Figures S5B and S5C) reveals overlap with TMS 1 and a fully conserved proline residue. Members of both families were recognized by the MEME program, revealing their close relationship.
The most conserved motif for Superfamily VI (Figures S6B and S6C) was identified in both families 12 and 26. These sequences are in the hydrophilic region following TMS 1. Four residues were fully conserved, a P at position 13, an A at position 29, and a Q at position 33.
Finally, Superfamily VII (Figures S7B and S7C) includes the six subfamilies of family 36. Subfamilies 1, 2, 3 and 6 were recognized by MEME, but not 4 and 5. Two residues, R at position 2, and Y at position 6, are fully conserved. This motif includes the entirety of TMS 1.
3.6 Average hydropathy, amphipathicity, and similarity plots for superfamilies I through VII
The average hydropathy, amphipathicity and similarity plots for Superfamily I proteins in TCDB are shown in Figure 4A. Two clear peaks of hydrophobicity correspond approximately to two equally strong peaks of similarity although the latter two peaks are skewed somewhat to the left for peak 1 and somewhat to the right for peak 2 relative to the peaks of hydrophobicity. Both of these peaks exhibit moderate degrees of amphipathicity. They correspond to the two TMSs predicted for this superfamily. Since the positive inside rule [41–43] indicates that the loop between TMSs 1 and 2 is outside, this implies that regions adjacent to the TMSs, on the cytoplasmic side of the membrane, are well conserved. This appears to be a frequent observation for holins in general. The C-terminal hydrophilic extension shows low degrees of sequence similarity.
Figure 4.


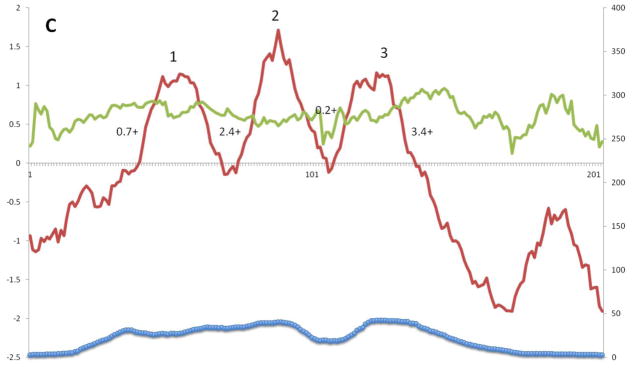
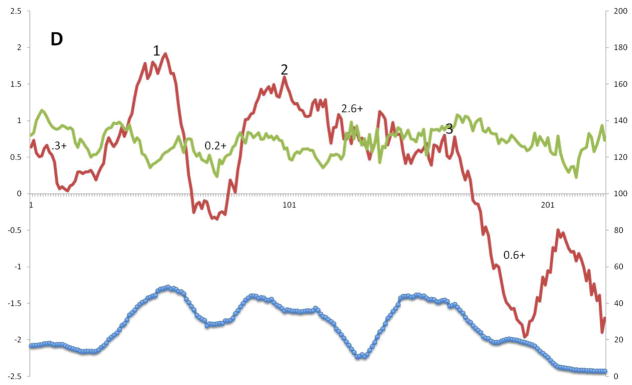


A – G: Average hydropathy (dark line, top), amphipathicity (light line, top) and similarity (thick line, bottom) plots (AveHAS program) for Holin superfamilies I – VII, respectively, included in TCDB as of February, 2013. Hydrophobic peaks believed to correspond to TMSs are numbered. Smaller numbers followed by a plus sign between the hydrophobic peaks, refer to the average number of strongly basic residues, Ks (Lysines) and Rs (Arginines) before, between or after the TMSs.
The corresponding plots for Superfamily II are shown in Figure 4B. There are two peaks of well conserved hydrophobicity labeled peaks 1 and 2. In this case, peak 2 is much more hydrophobic than peak 1 and is also slightly better conserved. No obvious peaks of amphipathicity correspond to these two peaks. The moderately hydrophobic region preceding peak 1 is not well conserved and clearly does not represent a general characteristic of this superfamily. It is interesting to note that as for superfamily I, the two peaks of similarity for peaks 1 and 2 are skewed to the left and right, respectively. Also as for superfamily I, the positive inside rule clearly suggests that the extracytoplasmic loop between TMSs 1 and 2 is in the periplasm of these exclusively proteobacterial proteins, a suggestion that has been experimentally verified for one member of this superfamily [44]. These results suggest that the most conserved portions of these proteins are on the cytoplasmic sides of the TMSs.
Figure 4C shows the average hydropathy, amphipathicity and similarity plots for Superfamily III proteins in TCDB. There are three clear peaks of hydrophobicity labeled 1 to 3. Peaks 1 and 2 are more hydrophobic than peak 3, with peak 2 being the most hydrophobic, while peaks 2 and 3 are better conserved than peak 1, with peak 3 being the best conserved. No corresponding amphipathicity peaks were noticed. The positive inside rule applied to these proteins clearly suggests that the N-termini are outside while the C-termini are inside. This prediction has been experimentally verified for one member of this superfamily [45]. Overlapping and to the right of peak 3 is the most conserved portion, showing again that the cytoplasmic region adjacent to this TMS is especially well conserved.
The corresponding plots for Superfamily IV proteins are represented in Figure 4D. Three clear peaks of hydrophobicity are labeled 1 to 3. In this case, peak 1 exhibits more hydrophobicity than peaks 2 and 3. While all three peaks are well conserved, peak 1 and 3 are somewhat better conserved than peak 2, but peak 1 is better conserved than the corresponding peak in Superfamily III. Interestingly, as observed for other superfamilies, the peaks of average similarity for peaks 2 and 3 are shifted to the left and right, respectively, compared to the peaks of hydrophobicity. As is also the case for the superfamilies mentioned above, no obvious peaks of corresponding amphipathicity are present. A small peak of hydrophobicity was observed near the beginning of the alignment. This peak corresponds to the first of four TMSs predicted for some of the proteins in family 1.E.19 (1.E.19.1.2, 1.E.19.1.5, and 1.E.19.2.1) in TCDB. For the 3 TMS members of this superfamily, the topology appears to be the same as for superfamily III. For the putative 4 TMS proteins with an extra N-terminal TMS, the N-termini are probably cytoplasmic in agreement with the positive inside rule.
Figure 4E depicts the average hydropathy, amphipathicity and similarity plots for Superfamily V. There are four clear peaks of hydrophobicity with the first three being much better conserved than the fourth. Most proteins in this superfamily have 3 TMSs. Peaks 3 and 4 are much less hydrophobic than peaks 1 and 2, and the fourth TMS is the extra one, present only in a few family members. Peaks 2 and 3 are best conserved. As noted above for the other holin superfamilies, peaks of similarity do not superimpose on the peaks of hydrophobicity. Instead, the peaks of similarity precede and follow hydrophobic peaks 2 and 3, again showing that cytoplasmic loops are better conserved than extracytoplasmic loops. No obvious peaks of amphipathicity corresponding to the hydrophobic peaks were seen. The positive inside rule suggests that the N-termini of the 3 TMS proteins and the loops between TMSs 2 and 3 are outside. Thus, TMSs 2 and 3 (Figure 4E) may correspond structurally and functionally to the 2 TMSs in 2 TMS holins.
Similar plots are presented in Figure 4F for Superfamily VI. One large peak of hydrophobicity is seen near the left hand side of these alignments. Two very small peaks of hydrophobicity, equally well conserved with peak 1, follow peak 1, but these exhibit such low degrees of hydrophobicity that they cannot be assumed to be transmembrane. It is, however, interesting that the first of these two small peaks of hydrophobicity corresponds to a peak of amphipathicity. The N-terminal peak is moderately well conserved and corresponds to the single TMS predicted for superfamily members. There is no clear peak of amphipathicity corresponding to the large hydrophobic peak.
Hydropathy, amphipathicity and similarity plots for Superfamily VII (Family 36) are shown in Figure 4G. Four peaks of hydrophobicity correspond to the two 2 TMS repeat units in the 4 TMS members of this superfamily. Both peaks are equally hydrophobic, although peak 2 is better conserved than peak 1. A peak of similarity follows hydrophobic peak 2 as observed in several of the superfamilies described above. Surprisingly, the less hydrophobic region following peak 2 is better conserved than the region preceding the 2 putative TMSs.
3.7 Superfamily phylogenetic analysis
The two phylogenetic trees for each of the seven superfamilies defined in this report are presented in Figures 5A – 5G, with the Clustal-X/TreeView (CX) trees on the left and the SuperfamilyTree (SFT) trees on the right for all seven superfamilies. Bootstrap values for the former trees are presented in supplementary Figures S1D–S7D. The trees for Superfamily I (TC Family 11) are shown in Figure 5A. Clustering patterns reveal that within subfamily 1, proteins 11.1.1 and 11.1.5, both from Staphylococcal phage, cluster together as do 1.2 and 1.3, from Lactococcal and Streptococcal phage, respectively, and 1.4 and 1.7, both chromosomally encoded within two different species of Streptococcus. The three proteins belonging to subfamily 1.E.11.2 cluster together as expected. Two of these proteins, 2.1 and 2.2, are derived from a Clostridium perfringens phage and the C. perfringens chromosome while 2.3 is from a closely related Geobacillus species. Surprisingly, 2.2 and 2.3 cluster more closely to each other than to 2.1. The two trees are in general agreement, except for the position of 1.6. These results suggest that within this group of holins, there has been limited horizontal transfer of holin genes between distinct Firmicute genuses.
Figure 5.


Phylogenetic trees of holin superfamilies derived using the ClustaX (CX) program (A) and the Superfamily Tree (SFT) program (B) for Superfamilies I – VII (A – G respectively).
The phylogenetic trees for Superfamily II are shown in Figure 5B. This superfamily includes four holin families, 1, 6, 7 and 25. Within family 1, most subfamily 1 proteins cluster tightly together with 1.4 and 1.5 being most distantly related. The first three of these proteins are derived from E. coli phage and prophage while the fourth is a chromosomal E. coli protein. The most distantly related protein within this family is derived from another γ-proteobacterial species, Cronobacter sakazakii. These observations are consistent with the suggestion that little horizontal transfer has occurred during the evolution of these proteins. It is also apparent that holins encoded within phage genomes are often closely related to chromosomally encoded holins from the bacterial species that the phage infects. This suggests that bacterial genes are frequently captured by phage and vice versa.
The clustering patterns for Family 6 reveal that in both trees, the three proteins in subfamily 1 and the four proteins in subfamily 2 cluster together in essentially the same order, although proteins in these two subfamilies are more distantly related to each other. The three proteins in subfamily 1 are derived from three different species of γ-proteobacteria while the four proteins in subfamily 2 are derived from an α-proteobacterium (Caulobacter), two β-proteobacteria (Glomeribacter and Comamonas) and one γ-proteobacterial phage from a Pseudomonas species. The relative clustering patterns are as expected since subfamily 1 proteins are all derived from γ-proteobacteria while proteins of subfamily 2 are derived from three different subgroups of proteobacteria.
Three proteins comprise family 7, where 1.1 and 1.2 appear more closely related to each other than they are to 2.1 on the CX tree. On the SFT tree, they cluster together in the center of the tree. The first 2 of these proteins are derived from a phage of Haemophilus species and from the chromosome of another Haemophilus species while the third is from a Bukholderia phage. While Haemophilus species are γ-proteobacteria, Burkholderia species are β-proteobacteria. Thus, again in family 7, the phylogeny of the holins corresponds to the phylogeny of the organisms from which they derive.
The fourth family in Superfamily II is 1.E.25. Five proteins comprise subfamily 1 while one protein comprises subfamily 2. Four of the five subfamily 1 proteins are derived from β-proteobacteria while the remaining protein (1.1) is from a Pseudomonas (γ-proteobacterium) phage. The single subfamily 2 protein is also from a γ-proteobacterium (Serratia). Since the β- and γ-proteobacteria are the most closely related of the different groups of proteobacteria, these results are consistent with minimal amounts of horizontal gene transfer. The two trees show excellent agreement.
Summarizing these results, family 1 consists entirely of γ-proteobacteiral proteins, family 6 includes α-, β- and γ-proteobacterial proteins, and both families 7 and 25 are derived from proteobacteria. It is interesting to note that of the proteobacteria, the γ- and β-proteobacteria are most closely related as noted above, while the other three groups, α, δ and ε, show increasing phylogenetic distance in this order. Thus, all of the proteins in Superfamily II are derived from the three most closely related groups of proteobacteria. The agreement between the two trees is excellent, although in the SFT tree, some intermixing occurs between families 1 and 7.
The phylogenetic trees for Superfamily III are shown in Figure 5C. This superfamily includes families 2, 3, 4, 5, 20, 34 and 41. In every case, the families (or subfamilies) cluster together coherently in the SFT tree, but not in the CX tree. In the latter tree, however, most of the differences result from separation of the subfamilies within a single family. The separation of these subfamilies probably reflects the shortness of the sequences as well as the insensitivity of the CX program. TC BLAST results confirmed the similarities of families 4 and 5 as well as families 3, 20 and 34, relative to the other superfamily constituents.
As noted in Table 1, most of the proteins in Superfamily III derive from proteobacteria, although Families 1.E.3 and 4 include proteins from other organisms including archaea, and families 34 and 41 derive from actinobacteria. All of the members of subfamily 2.1 are from γ-proteobacteria, while members of subfamily 2.2 are from ε-proteobacteria.
Although all members of family 3 cluster together, they fall into two subclusters according to subfamily assignments. Thus, subfamily 1 proteins, from γ- and β-proteobacteria and their phage, cluster separately from subfamily 2 proteins, from actinobacteria and archaea. Finding proteins so closely related from such divergent organisms suggests that horizontal gene transfer may have been responsible for this distribution. Since archaea lack peptidoglycan, it would be of great interest to know the function of this holin homologue. However, the fact that the two subfamilies within family 3 derive from different types of organisms is in general agreement with the phylogenetic observations mentioned above.
Family 4 proteins derive exclusively from enterobacteria. As for the families discussed above, protein phylogeny correlates with organismal phylogeny.
Family 5 consists of 3 large subfamilies. Most of these proteins are from proteobacteria, but four members of subfamily 3 are from synergistetes. Proteins 5.2.1 and 5.2.2, which are most closely related of the four TC members of subfamily 2, are from the two most distantly related groups of proteobacteria, the ε - and γ-proteobacteria, respectively. This is likely to be due to horizontal gene transfer. The greater phylogenetic distance of 2.4, from a β-proteobacterium, from the two γ-proteobacterial homologues in this subfamily is in accordance with expectation. Subfamily 5.1 includes proteins from γ- and β-proteobacteria and their phage. Subfamily 5.3 includes five proteins, one from an α-proteobacterium and four from the synergistetes phylum. Thus, family 5 is diverse in sequence and organismal source with clustering only loosely associated with organismal origin. Family 41 consists of a single divergent protein from the Deinococcus/Thermus phylum.
Family 1.E.34 consists of proteins exclusively from actinobacteria while family 1.E.20 includes proteins from both γ- and α-proteobacteria. Since these two families are small with few members, little can be said about their phylogenetic clustering patterns.
In summary, Superfamily III is the largest and most diverse superfamily we have identified, both with respect to sequence divergence and source organismal types. There is evidence of horizontal gene transfer within this superfamily.
Superfamily IV consists of five TC families, 10, 16, 19, 40 and 43 (Figure 5D). Of these, family 10 is the smallest while family 19 is the largest (see Table 1). Family 10 includes proteins only from firmicutes with two streptococcal proteins clustering together, more distantly from the Bacillus protein as expected. Members of these two families cluster essentially the same in the two trees. TCDB includes four proteins belonging to Family 16. The two streptococcal phage homologues are the most distant members, showing that the phylogeny of these proteins does not follow the organismal phylogeny. The same is true for family 19, which however, is more diverse with respect to organismal source and sequence. The actinobacterial proteins in family 19 are 1.1 and 1.6 which cluster closely together. The fusobacterial protein, 1.9, and the Megasphaera protein, 1.8, branch from points between the branches for two different firmicute phage, one from a Bacillus species (1.4) and one from a Clostridium species (1.5). Megasphaera is of somewhat uncertain classification because although its 16S RNA groups it with firmicutes, it has an outer membrane and is more resistant to monensin and other antimicrobial agents than other firmicutes [46, 47]. The results clearly show that the phylogeny of family 19 proteins does not follow that of their source organisms.
Superfamily V includes two TC families, 21 and 29. Both families include proteins from firmicutes and their viruses, but family 21 also includes members from actinobacteria (protein 2.2) and Chloroflexi (protein 1.1). Both of these nonfirmicute homologues cluster with firmicute members of family 21, strongly suggestive of horizontal gene transfer. While the two trees are in general agreement, the more reliable SFT tree shown in Figure 5E reveals that the proteins in each of the four subfamilies of this superfamily are distantly related to each other, branching from points near the center of this unrooted tree with two diverse clusters for each family. In both trees, 29.2.3 and 4 cluster with 21.2.1 and 2, revealing the close relationship between these two families. The clustering patterns for the family 29 proteins do not follow the phylogeny of the organisms. While the SFT program proved to be better than the CX program for correctly identifying and clustering members of this superfamily, both trees suggest overlapping degrees of similarity when subfamilies are compared. TC-BLAST studies were consistent with this conclusion.
The phylogenetic trees for Superfamily VI are shown in Figure 5F. Members of family 12 cluster on two branches according to subfamily, with the two Lactobacillus proteins of subfamily 1 clustering more closely together than to the Lachnospireceae protein. Clustering within family 26 occurs primarily according to subfamilies. Thus, all subfamily 1 proteins cluster together although separately from subfamilies 2, 3 and 4, the members of which cluster according to subfamily in both trees. However, the two remaining loose binary clusters in the SFT tree, 1.3 with 1.5, and 1.1 with 1.4, are derived from different organismal types, suggesting that within this superfamily, limited amounts of lateral gene transfer has occurred.
The Superfamily VII trees are presented in Figure 5G. These proteins are all included within family 36, which, however, includes six sequence divergent subfamilies. In both trees, the large subfamilies 1 and 6 form coherent clusters. In the CX tree, subfamily 2 also forms a single cluster, but in the SFT tree, the two sub-families seen in the CX tree are separated by 36.1.2, which in the CX tree is on a distinct branch, loosely associated with 36.4.1. In the more accurate SFT tree, 36.4.1 is sandwiched in between clusters 1 and 5. This tree reveals the only significant unexplained discrepancies for the seven sets of CX and SFT phylogenic trees.
3.8 Potential holin fusion proteins
Using the keyword holin, over 14,000 entries in the NCBI protein database and over 7,000 entries in UniProt were retrieved. Over a thousand proteins were examined for sizes indicative of fusions. An E. coli protein of 312 aas (I2WF18) was found to have an N-terminal holin (Lysis-S) domain (TC# 1.E.1) with a C-terminal DUF1327 domain of unknown function. However, it was the only protein of its kind, suggesting that this fusion could be artifactual, resulting from a sequencing error. Another putative E. coli fusion protein with an N-terminal S Lysis holin domain (TC# 1.E.1) and a C-terminal lysozyme like autolysin domain (B6ZXG1) was the only one of its type in the NCBI protein database. Since identical E. coli unfused holins and lysozymes had been reported, this fusion could also be artifactual. A putative endolysin of 288 aas from Serratia odorifera (D4E385) proved to have an N-terminal 3 TMS holin domain of TC family 1.E.2. The C-terminal domain was designated Peptidase-M15-4 of the VANY (Pfam02557) superfamily. These enzymes are D-alanyl-D-alanine carboxypeptidases. Since this was the only fused protein in the database, it could also be due to a sequencing artifact.
A protein of 643 aas, 946J from Acetobacter pomonum, was identified with a C-terminal Superinfection Immunity (IMM) domain with 2 TMSs. Several full length homologues were found in species of Acetobacter and Gluconacetobacter. Residues 100-325 proved to be homologues in hundreds of shorter (<300 aas) bacterial proteins that were annotated merely as “conserved exported hypothetical protein”. Q31Q68 of Synechococcus elongates (Anacystis nidulans) is an example. Residues 465-503 proved to be homologous to a putative peptidoglycan binding domain, suggesting that the large hydrophilic domain preceding the C-terminal IMM domain is periplasmic. This suggestion is consistent with the facts that (1) the protein has an N-terminal signal sequence that appears to be proteolytically processed to a mature form, and (2) the positive inside rule suggested that the C-terminal 2 TMS hairpin has its N- and C-termini in the periplasm with the central loop in the cytoplasm. Homologues retrieved with BLAST searches contained S-layer homology (SLH) and periplasmic serine protease domains, but these were not in the regions of overlap. It should be recalled that a holin-like function for Imm proteins has not been established. Finally, a true fusion protein in the MP4 family was identified and assigned TC# 1.E.40.5.1. It has an N-terminal holin domain fused to a large hydrophilic domain that is homologous to type-1 phosphodiesterase/pyrophosphatases.
The fact that no, or almost no holins are fused to the other protein domains must have functional or structural significance. We postulate that the need to form oligomeric holin pores for autolysin release may prohibit or select against the occurance of fusions. This could be a steric phenomenon if fused domains inhibit oligomerization and pore formation. Alternatively, it could reflect the need for autolysins to exist dispersed throughout the cell wall, a requirement that could prevent tethering to the membrane.
4. Discussion
Several holins have been experimentally examined to determine their topologies, and on this basis, the existence of at least four different topologies appeared likely. First, E. coli phage T4 holin, also called lysis protein (TC# 1.E.8.1.1), has 218 aas with a single N-terminal TMS and a long C-terminal periplasmic domain that is essential for correct timing of lysis [48, 49]. This protein does not belong to one of our seven holin superfamilies. Second, Class II lysis protein S of phage P21 (71 aas; TC# 1.E.1.1.1), a member of our Superfamily II, has 2 TMSs with the N- and C-termini in the cytoplasm and the central loop in the periplasm [44]. This conclusion is in agreement with prediction based on average hydropathy plots and the positive inside rule. In lysis protein S, only TMS 2 is apparently required for function [44]. Third, class I Lambda S holin (TC# 1.E.2.1.1, a member of our Superfamily III) has 107 aas with 3 TMSs. The N-terminus is extracytoplasmic while the C-terminus is in the cytoplasm [45] in agreement with prediction. TMS1 has been reported to be essential for holin function but not for the 105 aa antiholin [50]. Finally, the holin of Clostridium phage Phi3626 (TC# 1.E.19.4.1, our Superfamily IV), for which function has been demonstrated, may have 125 aas and 2 TMSs with 7 Lysine and Arginine residues in the loop region between the two TMSs. Applying the positive inside rule [41–43], it appears that the loop between the two TMSs is cytoplasmic while the N- and C-termini of the protein are extracytoplasmic. Our analyses revealed differences in hydropathy plots for members of Superfamily IV that led to prediction of either 2 or 3 TMS topologies for members. While we argue that the loop between TMSs 1 and 2 must be cytoplasmic, the Phi3626 holin may have 3 TMSs, with the extra TMS at the C-terminus relative to 2 TMS family 19 proteins. Moreover, the two proteins predicted to have 4 TMSs, (1.E.19.1.2 and 1.E.19.1.5) may have cytoplasmic N- and C-termini. Thus, while family 19 is predicted to include members with 2, 3 and 4 TMSs, the 2 TMS prediction may be incorrect although the 3 and 4 TMS predictions are more likely to be correct.
In each case where the topology of a holin has been experimentally examined, the data obtained are in agreement with the topologies predicted using the AveHAS plots and the positive inside rule. We have used these criteria to predict the topologies of all of the holins currently included within the 52 TC holin families.
In addition to making topological predictions for the seven superfamilies that agree with the available experimental evidence, we applied rigorous statistical criteria to establish homology between families and thereby establish superfamilies. We could identify more distant relationships than had been done by previous investigators since (1) a larger number of sequences are now available for analysis, and (2) we have reliable, quantitative statistical approaches that are used by few other investigators. Neither CDD nor Pfam had recognized all of the relationships we were able to establish. Our conclusions of homology were substantiated in most cases by deriving and comparing conserved motifs using the MEME program. Pfam analyses also provided confirmatory data in several instances. Conserved motifs are of particular interest since these motifs are likely to reflect the presence of functionally and structurally important residues. The studies reported here will thus be of value in guiding future functional analyses. They also serve to extend experimentally derived results to large numbers of homologues found throughout the prokaryotic world.
Using the cutoff 1e−20, many but not all of the 267 putative holin sequences annotated as 1.E.x.x.x in TCDB mapped to 17 Pfam families, previously not organized into a clan system. We propose, based on our clustering results (Figure S8), that Pfam families PF10746 and PF04971 should be organized into a clan called “Holin Superfamily II-like”, that Pfam families PF05106, PF04550 and PF07332 should be called “Holin Superfamily III-like”, and PF05105 and PF04020 should be designated Holin Superfamily IV-like. We have thus proposed a clan system for these Pfam families, and have shown reasonable agreement between the TCDB Superfamilies for Holins and Pfam’s families. These results additionally provide confirmation of our superfamily assignments.
The Holin Superfamily names in TCDB were originally imported from CDD and in turn from Pfam, and they agree in most cases with the “Phage_holin_” consecutive naming in Pfam. However, to create a consistent naming system between Pfam’s families and TCDB’s Superfamilies, we proposed five instances of renamings Pfam families as tabulated in the results section. It was clear from the TC/Pfam comparisons that Pfam had named several of the relationships identified here. Many of our results have since been incorporated into Pfam.
Phylogenetic analyses revealed the surprising fact that members of many holin families and superfamilies are derived from a very restricted group of organisms. In fact, of the 52 families recorded in TCDB, only 11 included identified members from more than one phylum (Table 1), and of the seven superfamilies, only three included members from more than one phylum (Table 2). Moreover, phylogenetic analyses were most frequently consistent with vertical descent. These observations suggest that lateral transfer of holin-encoding genes has occurred with low frequencies although several probable examples could be documented. In explaining this observation, we suggest that the limited organismal distribution of holin family members reflects the narrow host ranges of most phage. The results also imply that phage retain their host specificities over long periods of evolutionary time. These suggestions provide a useful hypothesis for future studies.
The size and topological uniformity of holins within any one family or superfamily is particularly noteworthy, especially in view of the great variation observed for the total range of holins. It seems that through evolutionary history, both size and topology of holins are fairly well-conserved traits. In fact, these traits may provide an indication of family relatedness. Consequently, we tabulated the 52 holin families according to topology and size (Table S1). This table provides a guide to potential relationships more distant than those documented in this report. Others were presented in section 3.3.
Very few authentic holin fusion proteins were identified, and it would seem that insertions and deletions of appreciable size were also rare. It is possible that holins arose only a few times throughout prokaryotic evolution, and that once established, pressures for change were minimal. Small oligomeric hole-formers only rarely underwent intragenic duplication to give larger proteins although such duplication events were common during the evolution of many other types of transport proteins including other types of channel-formers [14, 51, 52]. This observation may reflect the need to maintain flexible holes than can model and reshape themselves in response to the shapes and sizes of their cognate autolysins. It is important to note, however, that not all holins act by the same mechanism (i.e., secretion, leakage, lysis or membrane (pmf) collapse) although we expect that members of any one family or superfamily will exhibit common mechanistic features and exert their actions uniformly. Thus, the phylogenetic and topological information provided in this report should serve as guides for investigation of holin functional diversity [12]. We anticipate that the remarkable features of holins are yet to be fully appreciated and that distinctive properties consistent with their functions have yet to be discovered.
Supplementary Material
Highlights.
52 families of established and putative holins have been identified.
Several of these comprise large superfamilies of related proteins.
Holin size and topology has been fairly well conserved within families.
Horizontal transfer of holin genes is reported, but less frequently than expected.
Results imply limited host ranges by phage over evolutionary time.
Acknowledgments
We thank Ake Vastermark for conducting the Pfam and sequence search analyses and for helpful discussions. Vamsee Reddy designed much of the software used in the reported analyses. Maksim Shlykov provided expert assistance in the preparation of the manuscript and Figure 6. This work was supported by NIH grant GM077402.
Figure 6.
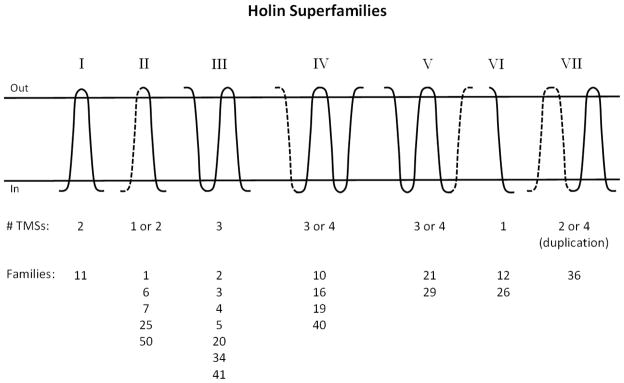
Schematic view of the topologies of members of the seven holin superfamilies (I–VII). Solid lines: TMSs that are present in all known members of the superfamily. Dashed lines represent TMSs present in some but not all members.
# TMSs: The number of transmembrane α-helical segments (TMSs) predicted for the proteins of a superfamily. Families: TC holin family, indicated by family numbers, within the 1.E subclass of the Transporter Classification (TC) system as revealed in the TC database (TCDB; www.tcdb.org).
Footnotes
Publisher's Disclaimer: This is a PDF file of an unedited manuscript that has been accepted for publication. As a service to our customers we are providing this early version of the manuscript. The manuscript will undergo copyediting, typesetting, and review of the resulting proof before it is published in its final citable form. Please note that during the production process errors may be discovered which could affect the content, and all legal disclaimers that apply to the journal pertain.
References
- 1.Young R, Blasi U. Holins: form and function in bacteriophage lysis. FEMS Microbiol Rev. 1995;17:191–205. doi: 10.1111/j.1574-6976.1995.tb00202.x. [DOI] [PubMed] [Google Scholar]
- 2.Saier MH, Ma CH, Rodgers L, Tamang DG, Yen MR. Protein secretion and membrane insertion systems in bacteria and eukaryotic organelles. Adv Appl Microbiol. 2008;65:141–197. doi: 10.1016/S0065-2164(08)00606-0. [DOI] [PubMed] [Google Scholar]
- 3.Wang IN, Smith DL, Young R. Holins: the protein clocks of bacteriophage infections. Annu Rev Microbiol. 2000;54:799–825. doi: 10.1146/annurev.micro.54.1.799. [DOI] [PubMed] [Google Scholar]
- 4.Desvaux M, Hebraud M, Talon R, Henderson IR. Secretion and subcellular localizations of bacterial proteins: a semantic awareness issue. Trends Microbiol. 2009;17:139–145. doi: 10.1016/j.tim.2009.01.004. [DOI] [PubMed] [Google Scholar]
- 5.Young R. Bacteriophage lysis: mechanism and regulation. Microbiol Rev. 1992;56:430–481. doi: 10.1128/mr.56.3.430-481.1992. [DOI] [PMC free article] [PubMed] [Google Scholar]
- 6.Catalao MJ, Gil F, Moniz-Pereira J, Sao-Jose C, Pimentel M. Diversity in bacterial lysis systems: bacteriophages show the way. FEMS Microbiol Rev. 2012 doi: 10.1111/1574-6976.12006. [DOI] [PubMed] [Google Scholar]
- 7.Young R. Bacteriophage holins: deadly diversity. J Mol Microbiol Biotechnol. 2002;4:21–36. [PubMed] [Google Scholar]
- 8.Donovan DM. Bacteriophage and peptidoglycan degrading enzymes with antimicrobial applications. Recent Pat Biotechnol. 2007;1:113–122. doi: 10.2174/187220807780809463. [DOI] [PubMed] [Google Scholar]
- 9.Catalao MJ, Gil F, Moniz-Pereira J, Pimentel M. The mycobacteriophage Ms6 encodes a chaperone-like protein involved in the endolysin delivery to the peptidoglycan. Mol Microbiol. 2010;77:672–686. doi: 10.1111/j.1365-2958.2010.07239.x. [DOI] [PubMed] [Google Scholar]
- 10.Desvaux M, Hebraud M. The protein secretion systems in Listeria: inside out bacterial virulence. FEMS Microbiol Rev. 2006;30:774–805. doi: 10.1111/j.1574-6976.2006.00035.x. [DOI] [PubMed] [Google Scholar]
- 11.Borysowski J, Weber-Dabrowska B, Gorski A. Bacteriophage endolysins as a novel class of antibacterial agents. Exp Biol Med (Maywood) 2006;231:366–377. doi: 10.1177/153537020623100402. [DOI] [PubMed] [Google Scholar]
- 12.Desvaux M. Contribution of holins to protein trafficking: secretion, leakage or lysis? Trends Microbiol. 2012;20:259–261. doi: 10.1016/j.tim.2012.03.008. [DOI] [PubMed] [Google Scholar]
- 13.Reddy VS, Shlykov MA, Castillo R, Sun EI, Saier MH., Jr The major facilitator superfamily (MFS) revisited. Febs J. 2012;279:2022–2035. doi: 10.1111/j.1742-4658.2012.08588.x. [DOI] [PMC free article] [PubMed] [Google Scholar]
- 14.Saier MH., Jr Tracing pathways of transport protein evolution. Mol Microbiol. 2003;48:1145–1156. doi: 10.1046/j.1365-2958.2003.03499.x. [DOI] [PubMed] [Google Scholar]
- 15.Wong FH, Chen JS, Reddy V, Day JL, Shlykov MA, Wakabayashi ST, Saier MH., Jr The amino Acid-polyamine-organocation superfamily. J Mol Microbiol Biotechnol. 2012;22:105–113. doi: 10.1159/000338542. [DOI] [PubMed] [Google Scholar]
- 16.Saier MH, Jr, Tran CV, Barabote RD. TCDB: the Transporter Classification Database for membrane transport protein analyses and information. Nucleic Acids Res. 2006;34:D181–186. doi: 10.1093/nar/gkj001. [DOI] [PMC free article] [PubMed] [Google Scholar]
- 17.Saier MH, Jr, Yen MR, Noto K, Tamang DG, Elkan C. The Transporter Classification Database: recent advances. Nucleic Acids Res. 2009;37:D274–278. doi: 10.1093/nar/gkn862. [DOI] [PMC free article] [PubMed] [Google Scholar]
- 18.Altschul SF, Gish W, Miller W, Myers EW, Lipman DJ. Basic local alignment search tool. J Mol Biol. 1990;215:403–410. doi: 10.1016/S0022-2836(05)80360-2. [DOI] [PubMed] [Google Scholar]
- 19.Thompson JD, Gibson TJ, Plewniak F, Jeanmougin F, Higgins DG. The CLUSTAL_X windows interface: flexible strategies for multiple sequence alignment aided by quality analysis tools. Nucleic Acids Res. 1997;25:4876–4882. doi: 10.1093/nar/25.24.4876. [DOI] [PMC free article] [PubMed] [Google Scholar]
- 20.Zhai Y, Tchieu J, Saier MH., Jr A web-based Tree View (TV) program for the visualization of phylogenetic trees. J Mol Microbiol Biotechnol. 2002;4:69–70. [PubMed] [Google Scholar]
- 21.Chen JS, Reddy V, Chen JH, Shlykov MA, Zheng WH, Cho J, Yen MR, Saier MH., Jr Phylogenetic characterization of transport protein superfamilies: superiority of SuperfamilyTree programs over those based on multiple alignments. J Mol Microbiol Biotechnol. 2011;21:83–96. doi: 10.1159/000334611. [DOI] [PMC free article] [PubMed] [Google Scholar]
- 22.Yen MR, Choi J, Saier MH., Jr Bioinformatic analyses of transmembrane transport: novel software for deducing protein phylogeny, topology, and evolution. J Mol Microbiol Biotechnol. 2009;17:163–176. doi: 10.1159/000239667. [DOI] [PMC free article] [PubMed] [Google Scholar]
- 23.Yen MR, Chen JS, Marquez JL, Sun EI, Saier MH. Multidrug resistance: phylogenetic characterization of superfamilies of secondary carriers that include drug exporters. Methods Mol Biol. 2010;637:47–64. doi: 10.1007/978-1-60761-700-6_3. [DOI] [PubMed] [Google Scholar]
- 24.Zhai Y, Saier MH., Jr A web-based program (WHAT) for the simultaneous prediction of hydropathy, amphipathicity, secondary structure and transmembrane topology for a single protein sequence. J Mol Microbiol Biotechnol. 2001;3:501–502. [PubMed] [Google Scholar]
- 25.Tusnady GE, Simon I. The HMMTOP transmembrane topology prediction server. Bioinformatics. 2001;17:849–850. doi: 10.1093/bioinformatics/17.9.849. [DOI] [PubMed] [Google Scholar]
- 26.Viklund H, Bernsel A, Skwark M, Elofsson A. SPOCTOPUS: a combined predictor of signal peptides and membrane protein topology. Bioinformatics. 2008;24:2928–2929. doi: 10.1093/bioinformatics/btn550. [DOI] [PubMed] [Google Scholar]
- 27.Zhai Y, Saier MH., Jr A web-based program for the prediction of average hydropathy, average amphipathicity and average similarity of multiply aligned homologous proteins. J Mol Microbiol Biotechnol. 2001;3:285–286. [PubMed] [Google Scholar]
- 28.Bailey TL, Elkan C. The value of prior knowledge in discovering motifs with MEME. Proc Int Conf Intell Syst Mol Biol. 1995;3:21–29. [PubMed] [Google Scholar]
- 29.Grundy WN, Bailey TL, Elkan CP. ParaMEME: a parallel implementation and a web interface for a DNA and protein motif discovery tool. Comput Appl Biosci. 1996;12:303–310. doi: 10.1093/bioinformatics/12.4.303. [DOI] [PubMed] [Google Scholar]
- 30.Grundy WN, Bailey TL, Elkan CP, Baker ME. Meta-MEME: motif-based hidden Markov models of protein families. Comput Appl Biosci. 1997;13:397–406. doi: 10.1093/bioinformatics/13.4.397. [DOI] [PubMed] [Google Scholar]
- 31.Zhai Y, Saier MH., Jr A simple sensitive program for detecting internal repeats in sets of multiply aligned homologous proteins. J Mol Microbiol Biotechnol. 2002;4:375–377. [PubMed] [Google Scholar]
- 32.Devereux J, Haeberli P, Smithies O. A comprehensive set of sequence analysis programs for the VAX. Nucleic Acids Res. 1984;12:387–395. doi: 10.1093/nar/12.1part1.387. [DOI] [PMC free article] [PubMed] [Google Scholar]
- 33.Reddy VS, Saier MH., Jr BioV Suite--a collection of programs for the study of transport protein evolution. Febs J. 2012;279:2036–2046. doi: 10.1111/j.1742-4658.2012.08590.x. [DOI] [PMC free article] [PubMed] [Google Scholar]
- 34.Wrigglesworth JM, Wooster MS, Elsden J, Danneel HJ. Dynamics of proteoliposome formation. Intermediate states during detergent dialysis. Biochem J. 1987;246:737–744. doi: 10.1042/bj2460737. [DOI] [PMC free article] [PubMed] [Google Scholar]
- 35.Dayhoff MO, Barker WC, Hunt LT. Establishing homologies in protein sequences. Methods Enzymol. 1983;91:524–545. doi: 10.1016/s0076-6879(83)91049-2. [DOI] [PubMed] [Google Scholar]
- 36.Saier MH., Jr Computer-aided analyses of transport protein sequences: gleaning evidence concerning function, structure, biogenesis, and evolution. Microbiol Rev. 1994;58:71–93. doi: 10.1128/mr.58.1.71-93.1994. [DOI] [PMC free article] [PubMed] [Google Scholar]
- 37.Kimball RA, Martin L, Saier MH., Jr Reversing transmembrane electron flow: the DsbD and DsbB protein families. J Mol Microbiol Biotechnol. 2003;5:133–149. doi: 10.1159/000070263. [DOI] [PubMed] [Google Scholar]
- 38.Kuan J, Saier MH., Jr The mitochondrial carrier family of transport proteins: structural, functional, and evolutionary relationships. Crit Rev Biochem Mol Biol. 1993;28:209–233. doi: 10.3109/10409239309086795. [DOI] [PubMed] [Google Scholar]
- 39.Park JH, Saier MH., Jr Phylogenetic characterization of the MIP family of transmembrane channel proteins. J Membr Biol. 1996;153:171–180. doi: 10.1007/s002329900120. [DOI] [PubMed] [Google Scholar]
- 40.Labrie SJ, Samson JE, Moineau S. Bacteriophage resistance mechanisms. Nat Rev Microbiol. 2010;8:317–327. doi: 10.1038/nrmicro2315. [DOI] [PubMed] [Google Scholar]
- 41.von Heijne G. Membrane protein structure prediction. Hydrophobicity analysis and the positive-inside rule. J Mol Biol. 1992;225:487–494. doi: 10.1016/0022-2836(92)90934-c. [DOI] [PubMed] [Google Scholar]
- 42.Andersson H, von Heijne G. Membrane protein topology: effects of delta mu H+ on the translocation of charged residues explain the ‘positive inside’ rule. Embo J. 1994;13:2267–2272. doi: 10.1002/j.1460-2075.1994.tb06508.x. [DOI] [PMC free article] [PubMed] [Google Scholar]
- 43.Nilsson J, Persson B, von Heijne G. Comparative analysis of amino acid distributions in integral membrane proteins from 107 genomes. Proteins. 2005;60:606–616. doi: 10.1002/prot.20583. [DOI] [PubMed] [Google Scholar]
- 44.Park T, Struck DK, Deaton JF, Young R. Topological dynamics of holins in programmed bacterial lysis. Proc Natl Acad Sci U S A. 2006;103:19713–19718. doi: 10.1073/pnas.0600943103. [DOI] [PMC free article] [PubMed] [Google Scholar]
- 45.Grundling A, Blasi U, Young R. Biochemical and genetic evidence for three transmembrane domains in the class I holin, lambda S. J Biol Chem. 2000;275:769–776. doi: 10.1074/jbc.275.2.769. [DOI] [PubMed] [Google Scholar]
- 46.Callaway TR, Adams KA, Russell JB. The ability of “low G + C gram-positive” ruminal bacteria to resist monensin and counteract potassium depletion. Curr Microbiol. 1999;39:226–230. doi: 10.1007/s002849900449. [DOI] [PubMed] [Google Scholar]
- 47.Costerton JW, Damgaard HN, Cheng KJ. Cell envelope morphology of rumen bacteria. J Bacteriol. 1974;118:1132–1143. doi: 10.1128/jb.118.3.1132-1143.1974. [DOI] [PMC free article] [PubMed] [Google Scholar]
- 48.Ramanculov E, Young R. Genetic analysis of the T4 holin: timing and topology. Gene. 2001;265:25–36. doi: 10.1016/s0378-1119(01)00365-1. [DOI] [PubMed] [Google Scholar]
- 49.Tran TA, Struck DK, Young R. Periplasmic domains define holin-antiholin interactions in t4 lysis inhibition. J Bacteriol. 2005;187:6631–6640. doi: 10.1128/JB.187.19.6631-6640.2005. [DOI] [PMC free article] [PubMed] [Google Scholar]
- 50.White R, Tran TA, Dankenbring CA, Deaton J, Young R. The N-terminal transmembrane domain of lambda S is required for holin but not antiholin function. J Bacteriol. 2010;192:725–733. doi: 10.1128/JB.01263-09. [DOI] [PMC free article] [PubMed] [Google Scholar]
- 51.Chang AB, Lin R, Keith Studley W, Tran CV, Saier MH., Jr Phylogeny as a guide to structure and function of membrane transport proteins. Mol Membr Biol. 2004;21:171–181. doi: 10.1080/09687680410001720830. [DOI] [PubMed] [Google Scholar]
- 52.Lam VH, Lee JH, Silverio A, Chan H, Gomolplitinant KM, Povolotsky TL, Orlova E, Sun EI, Welliver CH, Saier MH., Jr Pathways of transport protein evolution: recent advances. Biol Chem. 2011;392:5–12. doi: 10.1515/BC.2011.018. [DOI] [PMC free article] [PubMed] [Google Scholar]
Associated Data
This section collects any data citations, data availability statements, or supplementary materials included in this article.