Abstract
Motivation: The nucleosome is the basic repeating unit of chromatin. It contains two copies each of the four core histones H2A, H2B, H3 and H4 and about 147 bp of DNA. The residues of the histone proteins are subject to numerous post-translational modifications, such as methylation or acetylation. Chromatin immunoprecipitiation followed by sequencing (ChIP-seq) is a technique that provides genome-wide occupancy data of these modified histone proteins, and it requires appropriate computational methods.
Results: We present NucHunter, an algorithm that uses the data from ChIP-seq experiments directed against many histone modifications to infer positioned nucleosomes. NucHunter annotates each of these nucleosomes with the intensities of the histone modifications. We demonstrate that these annotations can be used to infer nucleosomal states with distinct correlations to underlying genomic features and chromatin-related processes, such as transcriptional start sites, enhancers, elongation by RNA polymerase II and chromatin-mediated repression. Thus, NucHunter is a versatile tool that can be used to predict positioned nucleosomes from a panel of histone modification ChIP-seq experiments and infer distinct histone modification patterns associated to different chromatin states.
Availability: The software is available at http://epigen.molgen.mpg.de/nuchunter/.
Contact: chung@molgen.mpg.de
Supplementary information: Supplementary data are available at Bioinformatics online.
1 INTRODUCTION
The genome of eukaryotes is packaged into a macromolecular structure called chromatin. The basic repeating unit of chromatin is the nucleosome, which contains two copies each of the four core histones H2A, H2B, H3 and H4, around which a 147-bp stretch of DNA is wrapped in a flat left-handed superhelix (Luger and Richmond, 1998). Nucleosomes form approximately every 200 bp along the genome to package the underlying DNA. Apart from the packaging function, nucleosomes may serve as a signaling module (Turner, 2012) that is integrated into biological processes acting with and on chromatin. This signaling function depends on post-translational modifications of the histone proteins, such as acetylation and methylation of lysine residues. These histone modifications may serve as a binding platform for non-histone proteins, whose activities change chromatin structure and function.
When nucleosomes tend to form at the same or nearby genomic positions in different cells, they are called (well) positioned. Positioned nucleosomes are important for the hypothesis that nucleosomes constitute a signaling module, because gross movements of modified nucleosomes along the chromatin fibers may lead to a loss of coherence between the modifications and the genomic features and/or functions.
The binding locations of modified histone proteins can be determined by a technique called chromatin immunoprecipitation followed by sequencing [ChIP-seq; Johnson et al. (2007)]. The immunoprecipitation step enriches for chromatin fragments containing a histone modification of interest, whereas the sequencing step is used to quantify the abundance of the underlying DNA.
Because the core histone proteins are part of a stable protein–DNA complex, it is natural to assume that the localization of modified histone proteins corresponds to the position of the nucleosomes. This suggests that histone modification ChIP-seq data can be used to infer nucleosome positions. However, this is far from being a trivial task for a number of reasons: (i) histone binding does not seem to be as sequence-specific as for many transcription factors; (ii) nucleosome positions can change considerably with time and across cells; and (iii) the data are affected by sparse sampling and high noise.
Nucleosome calling algorithms, such as the one presented here, aim at detecting positioned nucleosomes. To obtain a comprehensive and reliable set of predictions, one should combine the information contained in as many ChIP-seq experiments as possible and allow for some plasticity in the shape of the signal. However, modified histones tend to be mixed-source factors (Landt et al., 2012), which means that the degree of positioning can vary considerably across the genome. In regions where nucleosomes occupy different positions in different cells (e.g. within the body of actively transcribed genes), nucleosome calling algorithms are less suitable than segmentation approaches [Song and Smith (2011); Zang et al. (2009), to mention a few], which aim at detecting domains of high nucleosome abundance.
A number of tools for the inference of nucleosome positions have already been developed. Most of them apply signal processing techniques, such as Fourier transforms (Flores and Orozco, 2011), wavelet decomposition (Zhang et al., 2008a) and ad hoc filters (Albert et al., 2007; Weiner et al., 2010), to smooth the enrichment profile, followed by the detection of local maxima. Others are based on Bayesian modeling of the nucleosome enrichment pattern (Zhang et al., 2012). These methods do not allow one to control for systematic biases by comparing the nucleosome calls with data from control experiments. Furthermore, they cannot integrate data from multiple histone marks in a straightforward manner. Finally, because of the large size of the problem, e.g. the human genome, and the potentially high number of histone modifications, the runtime and memory consumption of these tools may limit their applicability.
Our tool can use information from a control sample to correct for systematic biases inherent in this high-throughput technology. It is designed to integrate multiple histone marks to broaden the range of nucleosome positions that can be detected. It annotates each identified nucleosome with the contributing histone modifications. We will demonstrate that these annotations can be used to cluster nucleosomes by their histone modification patterns. This clustering yields patterns of modifications that can be correlated to the function of the chromatin, such as transcriptional start sites and enhancers, or to the underlying process, such as transcriptional elongation by RNA polymerase II. These results support the assumption that nucleosomes serve as signal modules for biological process and that the corresponding histone modification patterns are a reflection of the signaling taking place on these modules.
2 METHODS
The algorithm performs three major steps: (i) a preprocessing step, where each file containing the chromosomal positions of mapped reads is turned into a numerical signal, (ii) a shape detection step, where candidate positions for nucleosome formation sites are detected and (iii) a filtering step, where these candidates are filtered and scored accounting for a number of possible sources of bias. In the following, we will refer to the enrichment profile on the positive or negative strand as the signal that counts for each location the number of positive or negative reads whose 5′ end maps there, and they will be denoted P(p) and N(p), respectively, where p is the chromosomal position.
2.1 Preprocessing
A well-positioned nucleosome typically exhibits the enrichment profile shown in Figure 1: a peak of positive strand reads upstream of the nucleosome location, and one of negative strand reads downstream. To obtain a consensus signal, which will be called the input signal I, the enrichment profile on the positive strand P is shifted to the right, the one on the negative strand N is shifted to the left and the sum of the two is considered. Denoting with F the average length of a fragment in the DNA library, the amount of this shift is about  , which yields the input signal:
In case of single-end sequencing data, usually the average fragment length needs to be estimated from the data itself. This estimation can be carried out by several available tools [such as Zhang et al. (2008b)]. However, because of the mixed source nature of the data, we found the available methods unsatisfactory when applied to histone marks, and therefore, as part of NucHunter, we also provide a method for estimating the average fragment length (described in Section 2.4).
Fig. 1.
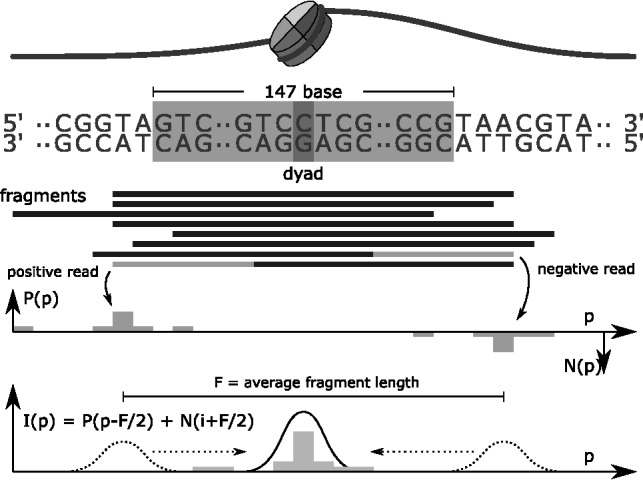
Preprocessing: from mapped reads to consensus signal. Positive and negative reads generate a strand specific enrichment profile which counts at each position the amount of reads whose 5′ end maps there. The consensus signal is obtained by shifting the strand specific enrichment profiles F/2 bases downstream, where F is the average fragment size, and summing them up
2.2 Peak detection
In the peak detection step (see Fig. 2), a suitable filter is applied to the input signal, followed by the detection of local maxima in the filtered signal and the analysis of the statistical significance of these maxima.
Fig. 2.
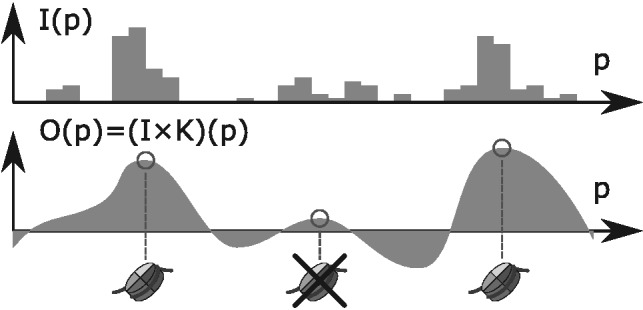
Peak detection from the consensus input signal. The input signal is smoothed using a filter with a certain impulse response, then the maxima of the resulting signal are detected and non-significant local maxima are filtered out
A filter (more precisely a linear time-invariant filter) is characterized by a discrete signal K(p) called impulse response. Given an input signal I(p), the filter output O(p) is the result of the following operation, called convolution:
where the index j ranges over positions where K(j) is not 0.
The impulse response in our approach has been chosen according to the following two criteria: first, it must separate sharp peaks from more spread out read distributions or non-enriched regions; second, it must have good smoothing properties, so that the convoluted signal contains a limited number of local maxima (Rice, 1944) and, therefore, the algorithm returns fewer false positives. We chose as impulse response the second derivative of a Gaussian density function, also known as the Mexican hat wavelet (see Fig. 3):
The Mexican hat wavelet removes from the Fourier spectrum of the input signal both high- and low-frequency components (band-pass filter), which is appropriate if we interpret high frequencies as random oscillations because of noise or insufficient coverage, and low frequencies as broad ambiguous peaks coming from a mixture of nucleosome positions, or as local biases such as GC content or open chromatin. The wavelet is parametrized by the scale parameter σ. In our studies, we chose a default value of 50 for σ because, in general, it corresponds to a good compromise between calling too many peaks and merging closely spaced ones. The parameter can also be fitted to the dataset under consideration using the method outlined in Section 2.4.
Fig. 3.
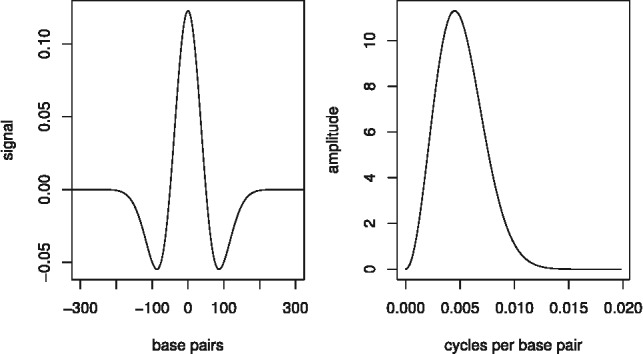
The Mexican hat wavelet for  (on the right) and its frequency spectrum (on the left)
Obtaining the convoluted signal for large genomes poses computational problems. In fact, a long signal as impulse response results in a slow convolution operation. In NucHunter the convolution has been implemented using recursive filters, an efficient signal-processing technique (Hale, 2006).
Once local maxima are extracted from the filter output, their statistical significance is assessed. To this end, we model the noise by assuming that values of the input signal within a certain region are independent identically distributed random variables (rvs). Using this assumption, we derive the mean and standard deviation of the convoluted signal, and we assign a z-score to each local maximum. If I(p) denotes the input signal, K(p) the impulse response and O(p) the convoluted signal at position p, let m(p) and std(p) denote, respectively, the mean and standard deviation of the input signal in a large region R that contains position p, then the z-score is given by:
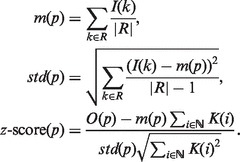 |
The detected peaks are all those local maxima with a z-score above a certain threshold. This z-score represents the strength of a peak, and a user-defined threshold, whose default value is 3, specifies how many standard deviations above average the peaks’ strength must be.
Additionally, the peaks are assigned a fuzziness score that represents the degree of uncertainty about the peak position, given by the formula:
 |
where  denotes the second discrete derivative of the filter output.
2.3 Filtering and scoring
After a set of putative peaks has been derived, additional filtering steps are carried out when a control sample is available. They are all based on the enrichment level of a peak, defined as the total number of reads that contribute to the input signal in a window of a certain size (by default 147 bp) centered around the peak.
Peaks are filtered in a similar manner as in Zhang et al. (2008b): the enrichment level is modeled as a Poisson rv whose parameter is estimated from both a global and a local average of the control sample, which is rescaled so that the number of sequenced reads in the two samples matches. From this model a P-value is obtained, and peaks can be filtered based on a user-defined threshold (which defaults to  ).
).
In more detail, let G denote the genome length. The noise level in the control sample is rescaled according to the total coverage ratio  , so that the local and global noise estimates
  and
and  can be expressed, respectively, as
  and
and  , and the final noise estimate λ is chosen as the maximum between the two (W defaults to 1000). Finally, the null model for the read counts in a window of a fixed radius R is given by:
The next filtering step consists in controlling the relative amount of positive and negative reads in the enrichment level, as highly unbalanced contributions from the two strands are likely to arise from mapping biases. Following the approach of Zhang et al. (2008a), we filter out peaks where the ratio between the two contributions is not contained in the interval  , where r defaults to 4.
A final step takes place when the sample is obtained from multiple ChIP-seq experiments. In this case, the consensus input signals from the different samples are added together, and the above steps are carried out as if the signal came from a single experiment. After that, however, the enrichment level at each peak is decomposed into the contributions of the different experiments, and each of them is tested independently to assess whether a certain histone modification is present or not (see Fig. 4). The tests are carried out using the same noise model and formulas shown above, where now I corresponds to the consensus signal derived from the single histone modifications.
Fig. 4.
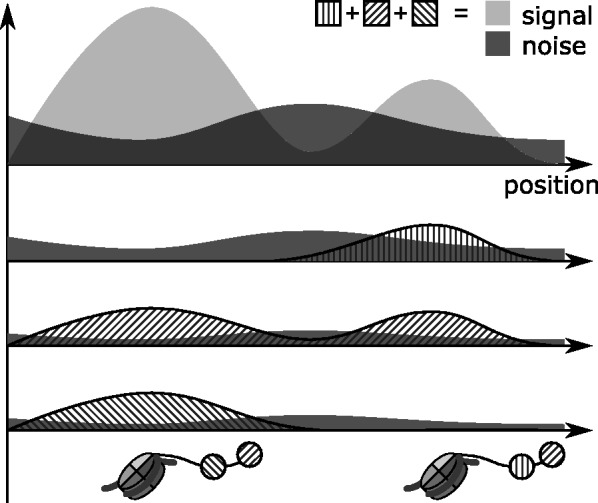
Integration of multiple histone modification experiments. First, peak detection is performed on the sum of the input signals, then the signal is decomposed into the contributions of the single histone modifications and then a statistical test is performed for each of them to asses whether their contribution is significant or not
Finally, for each nucleosome call the algorithm provides, along with the genomic coordinates, the following statistics: (i) the z-score (peak strength), (ii) the input signal enrichment level (sum of the raw read counts in a window of 147 bp around the peak), (iii) the control signal enrichment level (sum of the smoothed read counts in the same window), (iv) a P-value derived from the comparison between input and control enrichment levels (significance of the enrichment) and (v) the fuzziness score for the peak position. In case multiple samples are simultaneously analyzed, it is also provided, for each input sample and each nucleosome call, the contribution to the total enrichment level in terms of raw reads and the result of the statistical test as an on/off flag.
2.4 Inferring the average fragment length
The average fragment length F is typically inferred based on the strand cross-correlation function, defined as:
where the index p spans all genomic positions. For point-source factors and low noise levels the cross-correlation function usually has a peak at position F (the ‘fragment peak’), as shown in Figure 5, which yields a straightforward method for the estimation of F. However, for many histone marks the cross-correlation plot is harder to interpret because of the presence of a so-called phantom-peak (Landt et al., 2012) and other systematic biases, which can sometimes completely obscure the fragment peak (see Fig. 5b). To account for these biases, we introduce a modified cross-correlation function that we call peak cross-correlation (pcc):
The signals  and
and  are a dense representation of the peaks obtained applying a peak detection algorithm to the strand-specific signals N and P. More specifically,
  and
and  are binary signals whose only non-zero entries are ones occurring at the peaks’ locations. The peak detection technique presented in Section 2.2 applied to the consensus signal I is applied to the signals N and P.
Fig. 5.
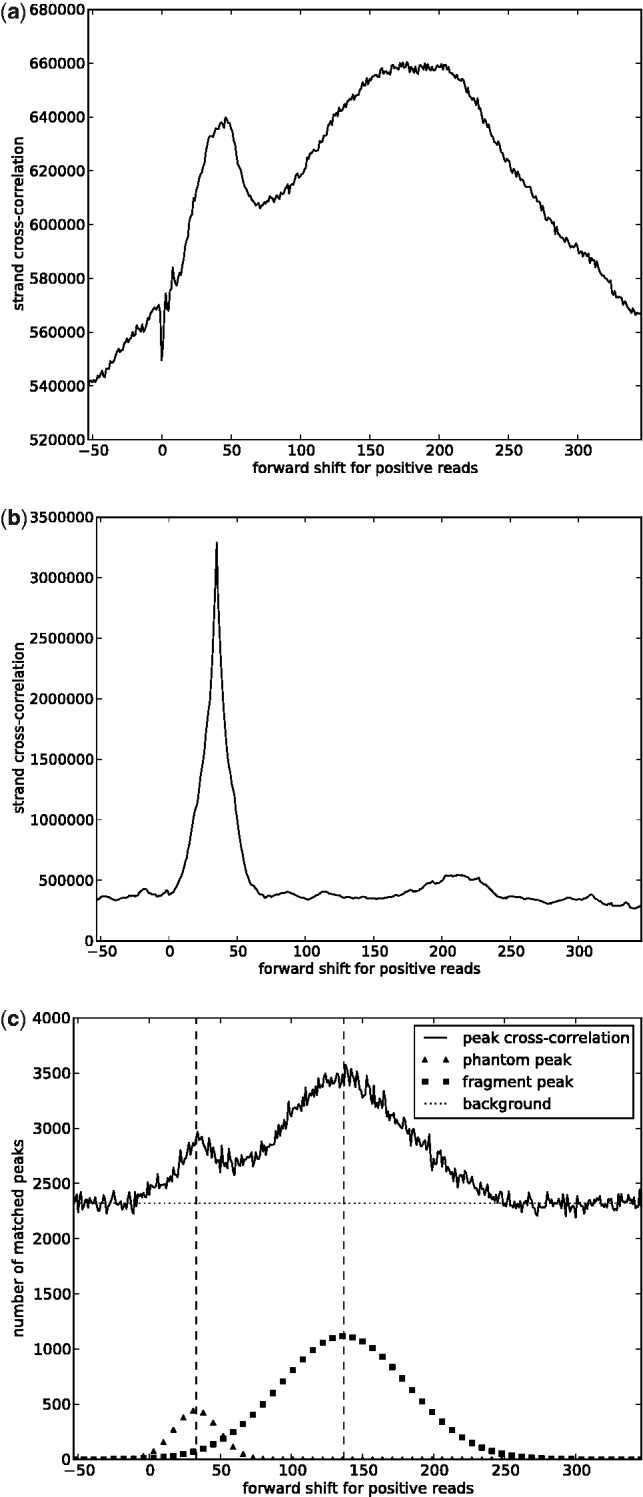
Strand cross-correlation analysis for some ChIP-seq experiments in human K562 cells. (a) Histone modification H3K4me3, a point-source or mixed-source factor. The phantom peak and the fragment peak are clear. (b) Histone modification H3K9me3, a broad-source factor. The fragment peak is almost not visible, in contrast with the phantom peak. (c) The pcc for the histone modification H3K9me3. Now also the fragment peak is visible, and it is possible to infer the average fragment length with an EM algorithm
The pcc function, which is used to infer F, can also indicate how appropriate the choice of σ is, where σ is the parameter used for peak detection (see Section 2.2). If N and P are assumed to be two replicates of the same signal with a systematic shift of F base pairs in the nucleosome peaks, a good choice of σ should result in a strong peak in the pcc function around position F, whereas a bad choice should lead to almost independent peaks in the two strands and a flat pcc function.
After the pcc function is computed, a clustering technique is applied to interpret it, which yields an estimate for F and a quality score for σ. We assume that the plot is generated by sampling from a mixture of three rvs: a uniform rv to model the background noise, a Gaussian rv to model the phantom peak and another Gaussian rv to model the fragment peak, as shown in Figure 5c. The parameters of these distributions are inferred using an expectation-maximization algorithm, and the mean of the Gaussian rv corresponding to the fragment peak is used as an estimate for the average fragment length. The quality score, which is derived from the likelihood of the inferred model, can be computed for different values of σ and yields a score curve (see Section 1 in Supplementary Material for more details).
3 RESULTS
3.1 Comparison to other available tools
We have developed NucHunter to identify nucleosome positions using histone modification ChIP-seq data. To test the predictive power of our algorithm and to compare it with other available tools, we ran NucHunter and two other tools [Nucleosome Positioning from Sequencing (NPS) from Zhang et al. (2008a); Template Filter from Weiner et al. (2010)] on a H3K9ac dataset from yeast (Weinberger et al., 2012). Some tools had to be excluded from the comparison either because they were not able to deal with the large amount of data or because the results obtained using default parameters were unsatisfactory. We chose yeast because we wanted to compare the predictions to a base pair resolution map of nucleosome positions in yeast (Brogaard et al., 2012). This map has been obtained with a technique that, even if it has not been tested widely yet, is independent from ChIP-seq, and it is claimed to be more accurate.
In line with previous studies (Chung and Vingron, 2009), to compare the nucleosome predictions with the nucleosome map, we used the (normalized) area under the cumulative error curve (AUC) as a performance measure. The AUC was obtained applying the following procedure (see also Supplementary Material):
we consider the set of all distances between nucleosome predictions and nucleosomes in the map <73 bp,
we obtain a cumulative error curve. In such a curve, a point
 means that a fraction y of the distances is less than x base pairs (see Supplementary Fig. S5),
we compute the AUC and we normalize it, so that a set of perfect predictions has an AUC of 1 and a random set of genomic positions has an expected AUC of 0.5.
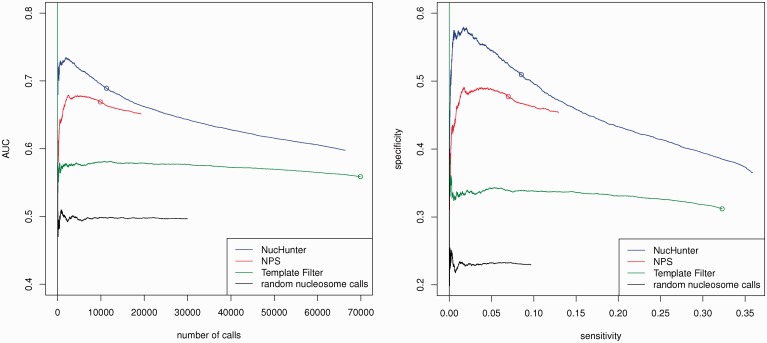
Along with the AUC, we also computed the sensitivity and the specificity, defined, respectively, as the fraction of nucleosomes in the map that are closer than 20 bp to a nucleosome prediction and the fraction of nucleosome predictions that are closer than 20 bp to a nucleosome in the map. Moreover, to account for the great variability in the number of predictions returned by each tool, we repeated the performance measurements for different score thresholds.
The results from Figure 6 show that NucHunter makes more accurate predictions compared with the other tools. Considering the default score thresholds, NucHunter and NPS return a similar number of predictions but the former has an higher AUC than the second, whereas Template Filter returns many more predictions and of lower quality. When the score threshold is increased, the AUC difference between NucHunter and NPS becomes much more pronounced. This suggests that the nucleosome predictions with highest score from NucHunter are, in general, much more precise compared with those from the other tools. All the tools suffer from low sensitivity in this dataset, in particular NucHunter and NPS when the default score thresholds are used.
Fig. 6.
Accuracy assessment of different tools on the yeast dataset. The performance measures (AUC, sensitivity and specificity) are computed for every possible score threshold, which results in an AUC number of calls curve (left) and a specificity–sensitivity curve (right). The circles indicate the performance of the algorithms using the default thresholds
The reasons for unidentified nucleosomes or incorrect predictions can be many. In the first place, the experimental procedures used for the ChIP-seq experiment and that used for the nucleosome map are different. Roughly 5.6% of the nucleosomes in the map, for instance, are located in low-mappability regions and are not covered by any read. Moreover, the ChIP-seq experiment targeted only acetylated nucleosomes, as opposed to the nucleosome map. A more general problem is the identification of fuzzily positioned nucleosomes. If the nucleosome positioning varies extensively from cell to cell, the assumptions made by the algorithms are violated and nucleosomes are hard to identify. Lastly, both specificity and sensitivity are affected from high noise levels, insufficient sequencing coverage and sequencing biases.
In addition to the yeast dataset, we also tested the algorithms on a simulated dataset and on different histone modification ChIP-seq files in human K562 cells. In the simulated dataset, the nucleosome map is randomly generated and the reads are generated accordingly. Because there is no nucleosome map for the human dataset, we used pairs of replicate experiments and pairs of different histone modifications as gold standard-predictions pairs. The details of the simulation and the performance evaluations are reported in Supplementary Material in Sections 3 and 4. In general, the results are in agreement with those shown previously. In the Supplementary Material, it is also shown that NucHunter runs faster and requires less memory than the other two algorithms (see Supplementary Material Section 5).
3.2 Clustering of nucleosomes based on histone marks
We ran NucHunter on a composite dataset from a human leukemia cell line [K562, Myers et al. (2011)] consisting of a control experiment and 12 ChIP-seq experiments for different histone modifications. For each detected nucleosome and for each experiment the algorithm returned, along with other statistics, the raw read count within a window of a specified width (which defaults to 147) around the inferred nucleosome location (see Methods).
We used these read counts for an exploratory analysis of the chromatin landscape. After a normalization procedure that corrects the read counts taking into account the control sample, the different sequencing depths of the datasets and the nucleosome abundance at each locus, we obtained a joint histone modification level distribution and we applied the k-means clustering algorithm on it (see Supplementary Material for more details). Given a parameter k, this unsupervised learning method aims at partitioning the data points into k different families (clusters) such that elements in the same cluster are as similar to each other as possible. Each cluster is characterized by its centroid, which is, in our case, a prototypical histone modification pattern.
We found that with k equals 6 the results are robust, whereas for higher values of the parameter the clusters tend to change depending on the initialization (see Supplementary Material). Moreover and most importantly, we found that such a partitioning, derived solely from the histone modification patterns, can also capture biologically meaningful positional features of the nucleosomes. We assigned labels to each cluster based on the histone modification pattern and genomic localization. The labeled centroids are shown in Figure 7.
Fig. 7.
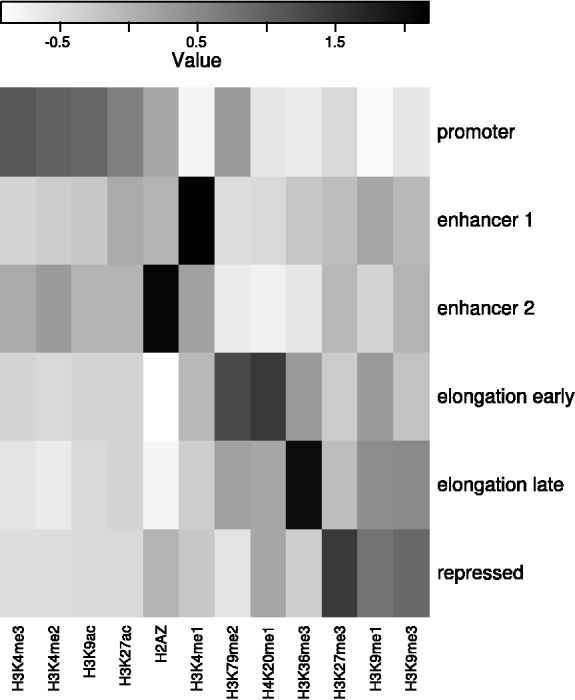
Using the k-means algorithm, 422 547 nucleosomes called by NucHunter were clustered into six clusters: promoter (20.4%), enhancer 1 (19.8%), enhancer 2 (14.4%), elongation early (16.4%), elongation late (14.7%) and repressed (14.3%). The rows of the heatmap represent the centroids of the clusters and the columns represent the histone modifications. The labels have been assigned based on prior biological knowledge
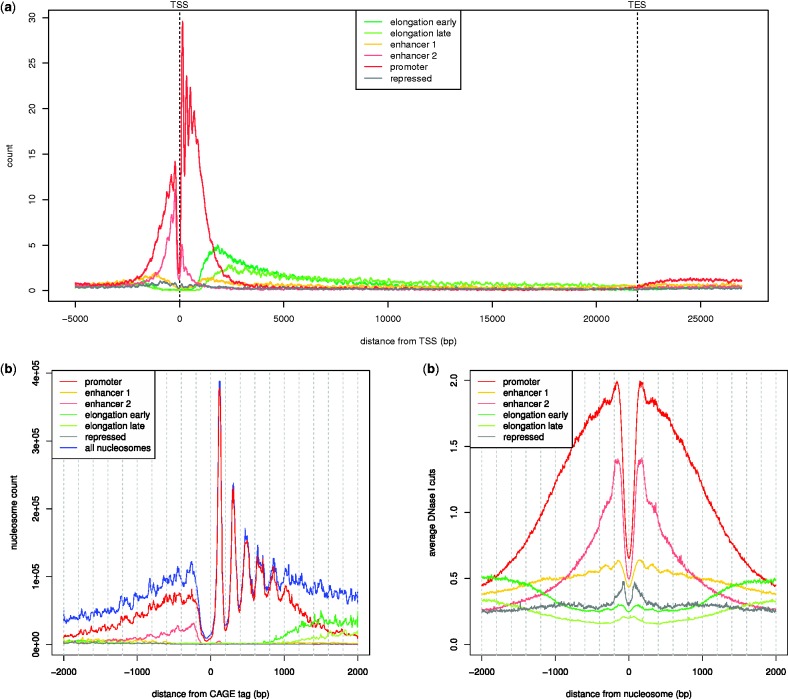
We studied the genomic localization of nucleosomes from the different clusters using the RefSeq annotation dataset as well as publicly available data from cap analysis of gene expression (CAGE) and DNase I hypersensitivity sequencing experiments (Myers et al., 2011). We performed the following analyses (further discussed in Supplementary Material): (i) we derived a consensus nucleosome profile along genes by considering a large set of annotated genes, by rescaling their nucleosome profiles to the same length and by adding them up (Fig. 8a); (ii) we analyzed the nucleosome positioning around promoters of active genes by considering the distribution of distances between CAGE tags and nucleosomes (Fig. 8b); and (iii) we obtained the average DNase I hypersensitivity profile around nucleosomes for each class (Fig. 8c).
Fig. 8.
Genomic localization of the different nucleosome classes in human K562 cells. (a) Occupancy of nucleosomes from the different classes along the gene body. The nucleosome occupancy profiles from a subset of genes in RefSeq have been rescaled to the same length and summed up. (b) Nucleosome distribution at promoters of active genes. The profile has been obtained by computing the distribution of distances between CAGE tags and nucleosomes. (c) DNase I hypersensitivity levels in relation to nucleosomes. The profile for each nucleosome class is the average DNase I hypersensitivity profile of all nucleosomes from that class
Overall these data give a clear picture of the nucleosome landscape and recapitulate previous knowledge (see Fig. 7). The nucleosomes in the first family are characterized by a strong enrichment of H3K4me2/3 and H3K9ac, and they tend to reside in the 5′ portion of a gene near the transcriptional start site (TSS; Fig. 8a). Thus, we labeled them ‘promoter’ nucleosomes. In proximity of promoters of active genes, these nucleosomes exhibit a strikingly regular pattern (Fig. 8b), whose main features are a nucleosome-depleted region right upstream the TSS and a well-positioned nucleosome 170 bp downstream (the +1 nucleosome). The second and third clusters show an enrichment of H3K4me1 and H2AZ as well as a general enrichment of active marks, whereas TSS-associated histone marks, such as H3K4me2/3 and H3K9ac, are less enriched compared with the promoter cluster. These features, together with the high levels of DNase I hypersensitivity that we observe (Fig. 8c), suggest that these nucleosomes may flank enhancer sequences. Thus, we labeled them as ‘enhancer 2’ and ‘enhancer 1’ nucleosomes. The fourth centroid is enriched in H3K79me2 and H4K20me1, whereas the fifth centroid is enriched in H3K36me3 and H3K9me1, which are all histone marks related to elongation of RNA polymerase II (Vavouri and Lehner, 2012). The localization of these two classes of elongation nucleosomes along the gene body, shown in Figure 8a, suggests that the 5th centroid is enriched toward the 3′ end of a gene, whereas the 4th centroid is enriched more to the 5′ end. Thus, we termed them ‘elongation early’ and ‘elongation late’ nucleosomes, respectively. The last centroid is characterized by an enrichment of H3K9me3 and H3K27me3, suggesting that it represents chromatin-repressed genomic regions (Margueron and Reinberg, 2011). Thus, we termed it ‘repressed’.
Lastly, we explored the relation between the different clusters that we obtained and a previously published study (Ernst and Kellis, 2010) that aimed at classifying the chromatin landscape into discrete states. Even though the last method uses a more complex model, different data sources and positional relations between histone modification patterns, we found that the overall results are comparable (see Supplementary Material). We believe that the joint analysis of histone modification patterns and nucleosome positioning that NucHunter allows for provides complementary information and offers a greater potential than histone modification studies based on arbitrary binning schemes of the genome.
4 DISCUSSION
The fast-paced development of chromatin immunoprecipitation-based techniques is heading toward an increased spatial resolution for DNA–protein interactions. In line with this trend, we developed NucHunter, a software for base pair resolution nucleosome identification in ChIP-seq experiments. The innovative aspects of this tool reside in a more accurate and efficient signal processing, an improved statistical analysis of the peaks, the possibility of integrating data from a control sample and to consider multiple histone modifications at once.
We put forward a nucleosome-centric view, because if we view the modifications (either sequentially or in a combinatorial pattern) as a reflection of a signaling activity then nucleosomes can be viewed as ‘signaling modules’ (Turner, 2012). In agreement with this idea, we found that nucleosomes can be clustered into distinct subgroups. These subgroups either mark certain functional regions of the genome, such as promoters and enhancers, or are related to biological processes, such as elongation or chromatin-mediated repression. Although this is not a new finding [see Ernst and Kellis (2010)], we think that our approach has the benefit of assigning the data to a physical entity that carries the information: the nucleosome. Thus, separation of different histone modification patterns into distinct subgroups becomes much more meaningful than by arbitrarily binning the genome into non-overlapping windows (Ernst and Kellis, 2010), where two nucleosomes with different modification patterns could be present.
In summary, we developed a new tool called NucHunter that is able to identify positioned nucleosomes along the genome using ChIP-seq data of histone modifications and annotates each nucleosome with (i) a flag indicating presence or absence of a certain histone modification and (ii) the number of contributing reads (if one is interested in a more quantitative view). We demonstrated that NucHunter performs better than currently available tools and has some features not present in any of them. By focusing on the nucleosome as information carrier, charting the epigenome will become much more meaningful and will in the long run allow for unraveling novel chromatin-mediated mechanisms.
Supplementary Material
ACKNOWLEDGEMENTS
A special thank goes to Johannes Helmuth and Matthew Huska for critical reading of the manuscript.
Funding: This work was supported by the International Max Planck Research School for Computational Biology and Scientific Computing; and the Bundesministerium für Bildung und Forschung for the ‘Deutsches Epigenom Programm' (DEEP) [01KU1216C].
Conflict of Interest: none declared.
REFERENCES
- Albert I, et al. Translational and rotational settings of H2a.Z nucleosomes across the Saccharomyces cerevisiae genome. Nature. 2007;446:572–576. doi: 10.1038/nature05632. [DOI] [PubMed] [Google Scholar]
- Brogaard K, et al. A map of nucleosome positions in yeast at base-pair resolution. Nature. 2012;486:496–501. doi: 10.1038/nature11142. [DOI] [PMC free article] [PubMed] [Google Scholar]
- Chung HR, Vingron M. Sequence-dependent nucleosome positioning. J. Mol. Biol. 2009;386:1411–1422. doi: 10.1016/j.jmb.2008.11.049. [DOI] [PubMed] [Google Scholar]
- Ernst J, Kellis M. Discovery and characterization of chromatin states for systematic annotation of the human genome. Nat. Biotechnol. 2010;28:817–825. doi: 10.1038/nbt.1662. [DOI] [PMC free article] [PubMed] [Google Scholar]
- Flores O, Orozco M. nucleR: a package for non-parametric nucleosome positioning. Bioinformatics. 2011;27:2149–2150. doi: 10.1093/bioinformatics/btr345. [DOI] [PubMed] [Google Scholar]
- Hale D. Technical Report CWP REPORT 546. Center for Wave Phenomena, Colorado School of Mines; 2006. Recursive Gaussian filters. [Google Scholar]
- Johnson DS, et al. Genome-wide mapping of in vivo protein-DNA interactions. Science. 2007;316:1497–1502. doi: 10.1126/science.1141319. [DOI] [PubMed] [Google Scholar]
- Landt SG, et al. ChIP-Seq guidelines and practices of the ENCODE and modENCODE consortia. Genome Res. 2012;22:1813–1831. doi: 10.1101/gr.136184.111. [DOI] [PMC free article] [PubMed] [Google Scholar]
- Luger K, Richmond TJ. DNA binding within the nucleosome core. Curr. Opin. Struct. Biol. 1998;8:33–40. doi: 10.1016/s0959-440x(98)80007-9. [DOI] [PubMed] [Google Scholar]
- Margueron R, Reinberg D. The polycomb complex PRC2 and its mark in life. Nature. 2011;469:343–349. doi: 10.1038/nature09784. [DOI] [PMC free article] [PubMed] [Google Scholar]
- Myers RM, et al. A user’s guide to the encyclopedia of DNA elements (ENCODE) PLoS Biol. 2011;9:e1001046. doi: 10.1371/journal.pbio.1001046. [DOI] [PMC free article] [PubMed] [Google Scholar]
- Rice SO. Mathematical Analysis of Random Noise. Bell System Technical Journal. 1944;23:282–332. [Google Scholar]
- Song Q, Smith AD. Identifying dispersed epigenomic domains from ChIP-Seq data. Bioinformatics. 2011;27:870–871. doi: 10.1093/bioinformatics/btr030. [DOI] [PMC free article] [PubMed] [Google Scholar]
- Turner BM. The adjustable nucleosome: an epigenetic signaling module. Trends Genet. 2012;28:436–444. doi: 10.1016/j.tig.2012.04.003. [DOI] [PubMed] [Google Scholar]
- Vavouri T, Lehner B. Human genes with CpG island promoters have a distinct transcription-associated chromatin organization. Genome Biol. 2012;13:R110. doi: 10.1186/gb-2012-13-11-r110. [DOI] [PMC free article] [PubMed] [Google Scholar]
- Weinberger L, et al. Expression noise and acetylation profiles distinguish HDAC functions. Mol. Cell. 2012;47:193–202. doi: 10.1016/j.molcel.2012.05.008. [DOI] [PMC free article] [PubMed] [Google Scholar]
- Weiner A, et al. High-resolution nucleosome mapping reveals transcription-dependent promoter packaging. Genome Res. 2010;20:90–100. doi: 10.1101/gr.098509.109. [DOI] [PMC free article] [PubMed] [Google Scholar]
- Zang C, et al. A clustering approach for identification of enriched domains from histone modification ChIP-Seq data. Bioinformatics. 2009;25:1952–1958. doi: 10.1093/bioinformatics/btp340. [DOI] [PMC free article] [PubMed] [Google Scholar]
- Zhang X, et al. Probabilistic inference for nucleosome positioning with MNase-based or sonicated short-read data. PLoS One. 2012;7:e32095. doi: 10.1371/journal.pone.0032095. [DOI] [PMC free article] [PubMed] [Google Scholar]
- Zhang Y, et al. Identifying positioned nucleosomes with epigenetic marks in human from ChiP-Seq. BMC Genomics. 2008a;9:537. doi: 10.1186/1471-2164-9-537. [DOI] [PMC free article] [PubMed] [Google Scholar]
- Zhang Y, et al. Model-based analysis of ChiP-Seq (MACS) Genome Biol. 2008b;9:R137. doi: 10.1186/gb-2008-9-9-r137. [DOI] [PMC free article] [PubMed] [Google Scholar]
Associated Data
This section collects any data citations, data availability statements, or supplementary materials included in this article.


