

Abstract
Matrix-assisted laser desorption/ionization imaging mass spectrometry (MALDI IMS) is a powerful tool for the visualization of proteins in tissues and has demonstrated considerable diagnostic and prognostic value. One main challenge is that the molecular identity of such potential biomarkers mostly remains unknown. We introduce a generic method that removes this issue by systematically identifying the proteins embedded in the MALDI matrix using a combination of bottom-up and top-down proteomics. The analyses of ten human tissues lead to the identification of 1400 abundant and soluble proteins constituting the set of proteins detectable by MALDI IMS including >90% of all IMS biomarkers reported in the literature. Top-down analysis of the matrix proteome identified 124 mostly N- and C-terminally fragmented proteins indicating considerable protein processing activity in tissues. All protein identification data from this study as well as the IMS literature has been deposited into MaTisse, a new publically available database, which we anticipate will become a valuable resource for the IMS community.
Matrix-assisted laser desorption/ionization imaging mass spectrometry (MALDI IMS)1 is an emerging technique that can be described as a multi-color molecular microscope as it allows visualizing the distribution of many molecules as mass to charge (m/z) signals in parallel in situ (1). Originally described some 15 years ago (2) the method has been successfully adapted to different analyte classes including small molecule drugs (3), metabolites (4), lipids (5), proteins (6), and peptides (7) using e.g. formalin fixed paraffin embedded (FFPE) as well as fresh frozen tissue (8). Because the tissue stays intact in the process, MALDI IMS is compatible with histochemistry (9) as well as immunohistochemistry and thus adds an additional dimension of molecular information to classical microscopy based tissue analysis (10). Imaging of proteins is appealing as it conceptually allows determining the localization and abundance of proteoforms (11) that naturally occur in the tissue under investigation including modifications such as phosphorylation, acetylation, or ubiquitination, protease mediated cleavage or truncation (12). Therefore a proteinous m/z species detected by MALDI IMS can be viewed as an in situ molecular probe of a particular biological process. In turn, m/z abundance patterns that discriminate different physiological or pathological conditions might be used as diagnostic or even prognostic markers (13, 14). In recent years, MALDI IMS of proteins has been successfully applied to different cancer types from the brain (15), breast (16, 17), kidney (18), prostate (19), and skin (20). Furthermore, the technique has been applied in the context of colon inflammation (21), embryonic development (22), Alzheimer's disease (23), and amyotrophic lateral sclerosis (24). With a few notable exceptions (13, 14, 16–18, 20, 24–30), the identity of the proteins constituting the observed characteristic m/z patters has generally remained elusive. This not only precludes the validation of the putative biomarkers by, for example, immunohistochemistry, but also the elucidation of the biological processes that might underlie the observed phenotype.
Here, we introduce a straightforward extraction and identification method for proteins embedded in the MALDI matrix layer that represent the molecular species amenable to MALDI IMS. Using a bottom-up proteomics approach including tryptic digestion and liquid chromatography tandem mass spectrometry (LC-MS/MS), we first created an inventory list of proteins derived from this layer, which we term the MALDI matrix proteome. Although the bottom-up approach breaks the link between the identified proteins and the m/z species detected in MALDI IMS, the list of identified proteins serves as the pool of proteins from which all potential biomarkers are most likely derived. Indeed we detected >90% of all human MALDI IMS biomarkers reported in the literature by analyzing just ten human tissues. In addition, the results demonstrate that the same inventory can be used as a focused database for direct top-down sequencing and identification of proteins extracted from the MALDI matrix layer. The proposed method is generic and can be applied to any MALDI IMS study, which is why we believe that one of the major challenges in identifying MALDI IMS biomarkers has now been overcome. In addition, we provide a list of all proteins and peptides identified in the MALDI matrices and tissues studied here as well as a comprehensive list of m/z species identified in the literature dealing with MALDI imaging of humans and rodents. This information has been compiled in MaTisse (http://www.wzw.tum.de/bioanalytik/matisse), a new publically available and searchable database, which we believe will become a valuable tool for the MALDI imaging community.
EXPERIMENTAL PROCEDURES
Human Tissue
Fresh frozen tissue specimen from ten different tissues (esophagus, stomach carcinoma, stomach normal tissue, colon mucosa, colon muscle, colon adenoma, colon carcinoma, two different mamma carcinomas and osteosarcoma) were provided by the archive of the Institute of Pathology, Technische Universität München and collected from patients on the basis of written informed consent. This study was approved by the Ethics committee of the Technische Universität München.
MALDI IMS Sample Preparation
Cryosections (10 μm) of fresh frozen tissue were cut on a cryostat (CM1950, Leica Microsystems, Wetzlar, Germany) and transferred to cooled (−20 °C) conductive Indium-Tin-Oxide (ITO) coated glass slides (Bruker Daltonik, Bremen, Germany) and treated with 1:1 poly-lysine: 0.1% Nonidet P-40 (nonyl phenoxylpolyethoxylethanol 40). The sections were washed in 70% ethanol and 100% ethanol for 1 min each, air-dried, and subsequently coated with MALDI matrix (10 g/l sinapinic acid, Sigma Aldrich, in 60% acetonitrile, 0.2% trifluoroacetic acid, TFA) using the ImagePrep spray device (Bruker Daltonik). The detailed method can be found in the Supplemental Material.
Protein Extraction from Matrix Coated Cryosections
Proteins were extracted from IMS samples in three steps that are illustrated in supplemental Fig. S1A. In the first step, the matrix coated area of the cryosection (approx. surface area 5 cm2) was covered with 150 μl of 7.5% acetonitrile in 0.2% TFA, incubated for 1 min and the liquid containing the protein extract was recovered using a pipette. This step was repeated using a further 300 μl of solvent and both extracts were combined. In the second step, the same area was covered with a total of 150 μl of 60% acetonitrile 0.2% TFA and the liquid was immediately collected again. Note that the first extraction step (low organic content) allowed extracting the matrix without liquid spreading beyond the covered area. The second extraction step (high organic content) dissolved the matrix completely to recover all of the embedded protein in a separate tube. In a third step, the solvent extracted remaining tissue was removed from the slide by means of a scalpel and collected in a tube as a third sample. The two solvent extracts and the excised tissue section were dried using a vacuum concentrator.
SDS Gel Electrophoresis and In-Gel Digestion
Seventy-five microliters of 2× LDS sample buffer (lithium dodecyl sulfate, Invitrogen, Carlsbad, CA) containing 100 μm dithiothreitol (DTT) were added to each of the dried samples. After incubation for 1 h at 90 °C on a shaker, 17.5 μl of a 550 mm iodoacetamide (IAA) was added, and the sample was incubated for 30 min in the dark to alkylate cysteines. After 10 min of centrifugation at 11,340 × g, samples were heated to 90 °C for 10 min and 25 μl of the sample were loaded onto a denaturing gradient gel (4–12% NuPAGE, Invitrogen). The run time for acetonitrile extracts was 5 min (just to run the samples into the gel) and 45 min for the total tissue extracts (to separate the proteins) at a constant voltage of 200 V. Gel lanes derived from total tissue extracts were cut into 12 equally sized slices. Samples derived from the matrix extracts were cut as a single piece. In-gel tryptic digestion of the proteins was performed according to (31) using sequencing grade trypsin (Promega, Mannheim, Germany).
LC-MS/MS Analysis for Bottom-Up Protein Identification
Nanoflow LC-MS/MS was performed by coupling a nanoLC-Ultra 1D (Eksigent, Dublin, CA, USA) to an LTQ-Orbitrap XL (Thermo Scientific, Bremen, Germany). Tryptic peptides were dissolved in 20 μl of 0.1% formic acid, and 10 μl were injected for each analysis. Peptides were delivered to a trap column (100 μm inner diameter 2 cm length, packed with 5 μm C18 resin, Reprosil PUR AQ; Dr. Maisch, Ammerbuch, Germany) at a flow rate of 5 μl/min in 100% buffer A (0.1% FA in HPLC grade water). After 10 min of loading and washing, peptides were transferred to an analytical column (75 μm x 40 cm C18 Reprosil PUR AQ, 3 μm; Dr. Maisch). Peptides from acetonitrile extracts of the tissues were separated using a 210-min gradient from 7 to 35% of buffer B (0.1% FA in acetonitrile) at 300 nl/min flow rate. Peptides from total lysates of tissue sections were separated by a 90 min gradient form 2 to 35% of buffer B at 300 nl/min. The LTQ-Orbitrap was operated in data-dependent mode, automatically switching between MS (in Orbitrap) and MS2 (in ion trap). Full scan MS spectra were acquired in the Orbitrap at 60,000 resolution and an AGC (automatic gain control) target value of 1e6. Internal lock mass calibration was performed using the ion signal [(Si(CH3)2O)6H]+ at m/z 445.120025 present in ambient laboratory air. Tandem mass spectra were generated by collision induced dissociation (CID) for up to 15 peptide precursors in the linear ion trap at a target value of 5000 and a normalized collision energy of 35. Precursors selected for fragmentation were dynamically excluded for 30 s.
MS Data Processing and Protein Identification
Mascot Distiller version 2.2.1 (Matrix Science, London, UK) was used for peak picking, charge deconvolution and de-isotoping. The resulting peak list files were searched against the IPI human database (version 3.68, 87,061 sequences) using the Mascot search engine version 2.2.04 (Matrix Science). Search parameters included a precursor mass tolerance of 10 ppm and fragment tolerance of 0.6 Da. Enzyme specificity was set to trypsin with a maximal number of two missed cleavages. Carbamidomethylation of cysteine residues was set as a fixed modification and deamidation of asparagine and glutamine, oxidation of methionine and acetylation at the peptide N terminus were set as variable modifications. Mascot search results were loaded into Scaffold (version 3.00.08, Proteome Software, Portland, OR, USA) and filters in Scaffold (32) were applied to result in false discovery rates (FDR) of 0.8% on protein level and 0.4% on peptide level.
Sample Preparation for Top-Down Protein Identification
Protein containing tissue extracts were prepared as described for the bottom-up approach. The 7.5 and 60% acetonitrile extracts were combined and dried in a vacuum centrifuge. To remove particles that might interfere with LC-MS analysis, the dried samples were reconstituted in 50% acetonitrile, 0.2% TFA and passed through STAGE tips (33) packed with C18 Empore™ extraction disks (3 m). The flow-through fraction containing the proteins was dried and reconstituted in buffer A (0.1% formic acid).
LC-MS/MS Analysis for Top-Down Protein Identification
Nano-LC-MS measurements of intact proteins were carried out using a nanoLC-Ultra 1D+ (Eksigent) coupled to an LTQ-Orbitrap Elite mass spectrometer (Thermo Scientific). Samples were loaded onto the same columns, using the same solvents as above. Gradient separation was performed as follows: 2–10% B in 1 min; 10–35% B in 34 min; 35–90% B in 2 min; 90% B for 4 min; 90–2% B in 0.5 min; 2% B for 3.5 min. The Orbitrap Elite was operated in data dependent mode automatically switching between full MS and MS/MS mode. Full MS spectra were acquired in the Orbitrap over a mass range from 430 to 1800 m/z collecting four microscans. The three most intense precursor ions with charge states greater than three were selected for fragmentation using higher-energy collisional dissociation (HCD) using a normalized collision energy of 30. Eight, respectively four microscans were acquired for each precursor in separate LC-MS/MS runs to generate tandem mass spectra with sufficient quality for peptide identification. Both MS and MS/MS were acquired at a resolution of 60,000 in the Orbitrap and using a target value of 1e6. Internal calibration was performed as described above. Raw mass spectra were processed using Mascot Distiller version 2.4.2 (Matrix Science). The resulting charge-deconvoluted and de-isotoped spectra were searched against the IPI human database (version 3.68, 87,061 sequences) using the Mascot search engine version 2.3.02 (Matrix Science). The same data was also searched against an in-house generated fasta file (using the export function of Scaffold) containing 5465 sequences assembled from the bottom-up analysis described in this study (3738 protein sequences and 1727 isoform sequences, supplemental File S1). All searches used 7 ppm precursor tolerance and 0.04 Da fragment ion tolerance. Acetylation of lysine, protein and peptide N terminus, deamindation of glutamine and asparagine as well as oxidation of methionine were set as variable modifications. No enzyme was specified for searching. To sequence less abundant precursors, the data dependent acquisition search results of the first measurement were used to compile an exclusion list for further LC-MS/MS iterations. The peak list files of all runs were merged into one file using MASCOT daemon. Top-down searches were run without the decoy option 1) because searching against human IPI would have taken excessively long (an estimated 8 days on a 12 CPU server) and 2) because the target-decoy approach is not well suited to estimate FDRs in low complexity samples such as the ones analyzed here. Search results were loaded into Scaffold version 3.6.3. For protein identifications to be accepted, the mascot ion score had to be equal or above the mascot homology score of 52. In addition, proteins identified by a single peptide were verified by manual inspection of the tandem mass spectra. Identifications based on tryptic peptides originating from carry over from previous runs were excluded.
Bioinformatic Data Analysis and Data Availability
Lists of identified proteins were analyzed for cellular compartment, biological function and canonical pathways using Ingenuity Pathway Analysis, IPA (Ingenuity Systems, www.ingenuity.com). For the survey of proteins from published human MALDI IMS studies, the reported protein accession numbers were mapped to IPI accession numbers using the ID mapping tool of Uniprot (http://www.uniprot.org). For papers reporting proteins from other organisms, respective sequences were first analyzed by BLAST (http://www.uniprot.org/) and subsequently mapped to the corresponding human ortholog.
A complete list of identified proteins and peptides along with all supporting evidence such as annotated tandem mass spectra has been assembled into two Scaffold files available from http://www.proteomexchange.org, accession PXD000125). Protein identification data as generated in this study as well as that extracted from the literature is available via the supplemental Tables 1–3, 6,7 and the newly created MaTisse database under http://www.wzw.tum.de/bioanalytik/matisse.
RESULTS
Characterization of the Matrix Proteome
In keeping with the idea that any IMS protein biomarker must be contained in the MALDI matrix layer to be detectable by the mass spectrometer, we set out to identify these proteins systematically (Fig. 1). Tissue samples were prepared for MALDI IMS according to standard procedures but instead of executing an imaging experiment, we extracted proteins from the MALDI matrix layer using 7.5% acetonitrile (ACN) followed by 60% ACN and finally recovered the entire remaining material from the glass slide. Analytical SDS-PAGE separation of the three protein pools (Fig. 1B) shows that the 7.5% ACN extract mainly contains small proteins (<35 kDa). Increasing the concentration of the organic solvent to 60% ACN dissolves the MALDI matrix layer completely and extracts proteins up to ∼70 kDa in size (the strong band is human albumin). The total tissue protein extract (Fig. 1B) shows the typical range of proteins expressed in human tissues covering the entire mass scale. We processed samples from ten different tissues in this way (Fig. 2A) and subjected all to tryptic digestion and protein identification using LC-MS/MS (the bottom-up proteomic approach). Using 20% of each extract of a single microscopic slide with ∼5 cm2 tissue surface, 400, 700, and 2,100 proteins were identified on average from the 7.5% ACN, 60% ACN, and total extracts respectively (Fig. 2A). The total number of proteins identified from all matrix extracts was 1435 and 3709 from all total extracts. With a few exceptions (37 proteins), all proteins identified from the matrix extracts were also present in the total extracts (the core proteome (34)) showing that the sample preparation used for MALDI IMS studies extracts a subset of the total proteome of a human tissue.
Fig. 1.
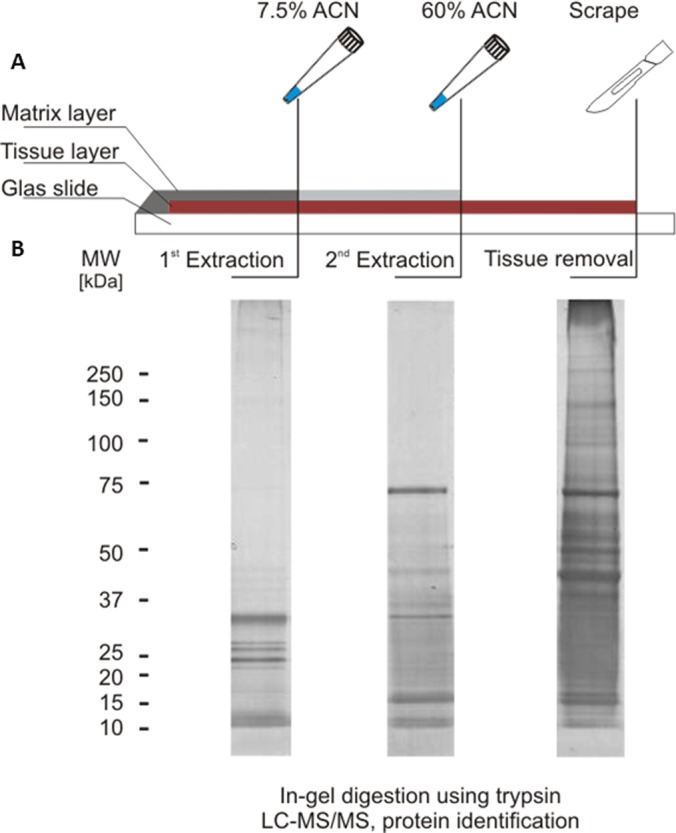
Extraction of proteins from MALDI IMS slides. A, the sinapinic acid matrix layer of a ready-to-measure MALDI IMS microscopy slide (here prepared from normal stomach tissue is removed by a two-step extraction procedure using 7.5 and 60% acetonitrile in 0.2% tri-fluoro acetic acid (TFA). The remaining tissue is recovered by means of a scalpel (see also supplemental Fig. S1A) B, silver stained SDS-PAGE of the proteins recovered from the microscopy slide showing that the acetonitrile extractions primarily recover low molecular weight proteins (see also supplemental Fig. S1B).
Fig. 2.

Bottom-up proteomic characterization of MALDI IMS samples. A, protein identification summary of ten human tissues. B, cumulated number of identified proteins from the ten different tissues and three protein extractions. Samples are ordered such that the highest number of identifications is obtained for the smallest number of samples combined. C, distribution of identified proteins by molecular weight. Bins were chosen according to the marker used in the SDS-PAGE shown in Fig. 1B. Blue bars represent the distribution of entries in the Uniprot database (human only). D, distribution of proteins by cellular compartment.
Notably, the core tissue proteomes were rather similar among tissues as accumulating all distinct protein identifications across the tissues lead to rapid saturation (Fig. 2B). A similar but less pronounced effect was also observed for the acetonitrile extracts indicating that the data mainly covers ubiquitously expressed abundant proteins. An analysis of the molecular weight (MW) distribution of the identified proteins (Fig. 2C) shows that many more small proteins (<25kDa) are detected in the matrix layer compared with the total tissue, which is consistent with the data obtained by SDS-PAGE analysis and MALDI IMS data from the literature where most protein features are detected between 2–25 kDs (1) and seldom beyond 40 kDa (35). The bottom-up protein identification data from the matrix layer did, however, also identify many nominally medium sized and large proteins (by MW in Uniprot). This is inconsistent with the SDS-PAGE data shown in Fig. 1 and indicates that the larger proteins are either present in quantities below the detection limit of silver staining or that these represent protein fragments arising from protease cleavage (see also below). The majority of all proteins identified from extracts are cytoplasmic proteins (Fig. 2D) and the matrix extracts contain relatively more extracellular proteins but relatively fewer plasma membrane proteins than the tissue extracts. Taken together, the characterization of the matrix proteome shows that it mainly consists of small, soluble, abundant, and well annotated human proteins.
A Near Complete List of Published MALDI IMS Biomarkers
As noted in the introduction, the molecular identities of m/z patterns detected in MALDI IMS studies often remain unknown. We conducted a comprehensive literature survey and compiled a list of 254 m/z species that were identified from human and rodent tissue (supplemental Table S4). Thirteen of the 22 reports analyzed human tissue specimen and identified 60 distinct human proteins (Table I). We then asked if these proteins were also identified in our work and, if so, in which extracts and how often they were found. Interestingly, 90% of all IMS markers reported in the literature were found in our matrix proteomes despite the fact that the organs used in the literature were different from the ones used here. It is also noteworthy that the same proteins tend to be identified in multiple studies indicating they are rather abundant and not necessarily specific for a particular tissue or disease. Many IMS studies use rodents as disease models and our list of identified human matrix proteins also covers nearly 80% of the rodent orthologs (supplemental Table S5). To assess protein abundance specifically, we ranked all 3700 proteins identified in the total tissue extracts by the number of tandem mass spectra with which they were identified (divided by the size of the protein) and highlighted the IMS biomarkers from the literature in orange (Fig. 3A). The expression range of proteins in the total tissue extract spans approximately four orders of magnitude and most of the IMS biomarkers appear to be abundant cellular proteins. When plotting the 1400 matrix proteins on the same scale (Fig. 3B), most of the reported IMS markers are also abundant in the matrix. However, there are also some proteins with quite high abundance in the matrix but only medium or low abundance in the tissue (e.g. cytochrome c oxidase). This may suggest that MALDI IMS, at least in principle, can access proteins across several orders of magnitude in cellular protein expression. An alternative explanation is that the spray coating process may strongly favor the solubilization of some particular proteins.
Table I. Proteins previously reported in published MALDI IMS studies and their frequency of observation in the present study. The maximum number of observations ‘in extracts’ is 20 (i.e. 10 human samples, two acetonitrile extractions each) and 10 “in tissue.” The column “reference” points to the publication in which the respective protein was originally identified.
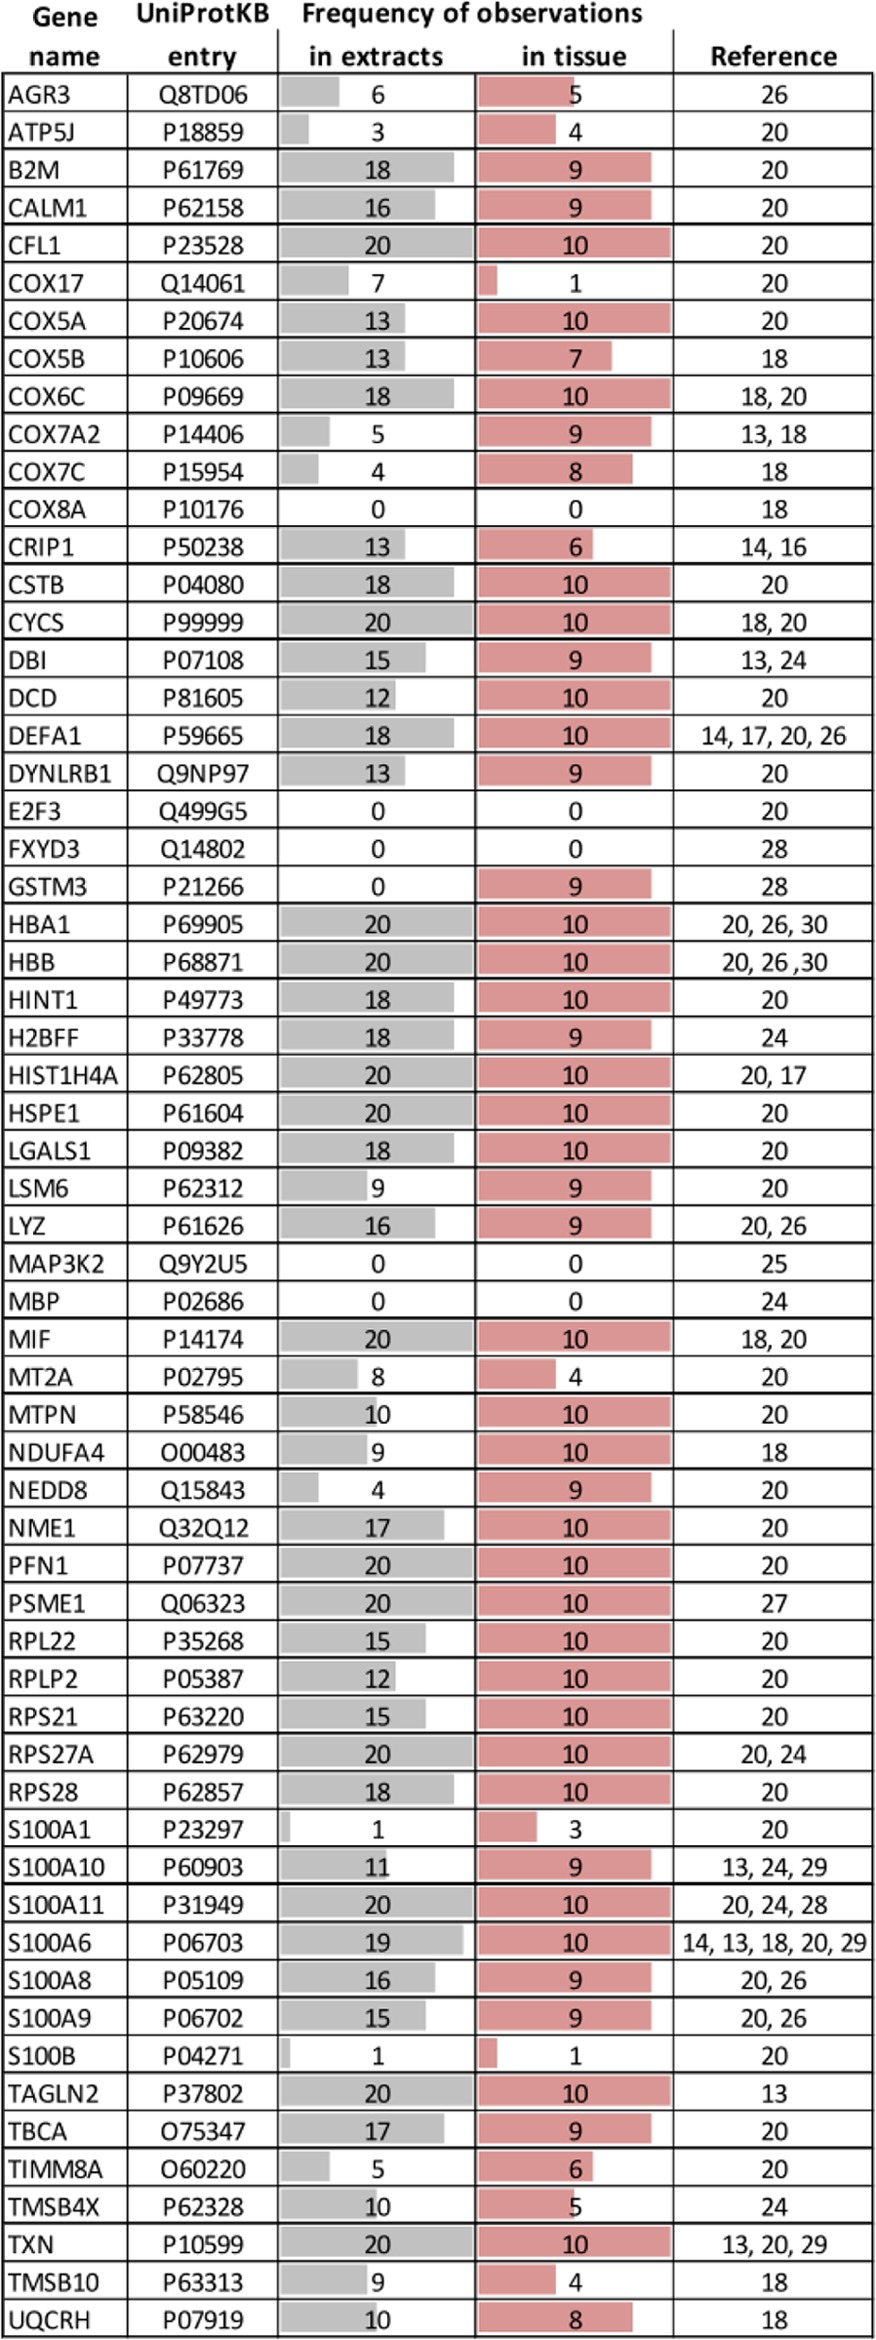
Fig. 3.

Relative abundance of proteins identified in MALDI IMS. A, Proteins from all 10 human tissues were ranked according to the number of assigned spectra divided by the molecular weight of the proteins' database entry. MALDI IMS markers extracted from the literature (see also Table I and supplemental Table S5) are indicated in orange showing that these are mainly abundant cellular proteins. B, Proteins identified from the MALDI matrix layer plotted against the ranked protein abundance used in panel A).
Closing the Gap: Top-Down Protein Identification
The above bottom-up proteomic approach created a list of proteins from which essentially all m/z features detectable by MALDI IMS in human tissue should be derived. Eventually, any particular m/z feature of interest in a MALDI IMS spectrum (i.e. discriminating among two or more tissue states) must be identified. This is ideally done directly and without the use of a protease because it can otherwise not be ascertained that the detected m/z feature and the protein identified following proteolysis are indeed the same. Therefore, the mass spectrometric fragmentation of the intact molecule is required (top-down proteomic approach). Progress in the performance of mass spectrometers is now making this more readily possible (36) and the short-list of MALDI IMS proteins generated in this study is of tremendous help for this purpose. As a proof-of-concept, we prepared MALDI matrix extracts from esophagus and colon tissue sections, mixed the extracts and analyzed these by LC-MS/MS on a high field Orbitrap mass spectrometer (36). Tandem mass spectra were charge deconvoluted and deisotoped before searching against a collection of ∼5,500 protein sequences assembled from protein identifications made in MALDI IMS studies including the ones presented above (subsetDB, supplemental Files S1 and S2). An example of an acetylated and top-down sequenced 5 kDa peptide including nine internal lysine residues is shown in Fig. 4A (full length thymosin beta-4, TMSB4X). When searching either the commonly used human IPI database (37) or the 15× smaller subsetDB, 124 proteins were identified in common and only very few identifications were exclusive for either database (Fig. 4B). However, the much reduced search space enabled the search engine (here Mascot) to assign over four times the number of spectra above homology threshold (∼2500) when using subsetDB compared with human IPI (supplemental Fig. S4) resulting in more than three times the number of identified peptides for the respective proteoforms. The vast majority of the identified peptides are smaller than 4 kDa but it is noteworthy that peptides as large as 12 kDa could also be identified top-down using sample quantities recovered from a single microscopic slide (Fig. 4C). Interestingly, many of the identified proteins are represented as C-Terminal and N-Terminal fragments (Fig. 4D) suggesting significant protein processing within the tissue that gives rise to these species.
Fig. 4.

Top-down protein identification. A, charge deconvoluted and deisotoped tandem mass spectrum of intact and acetylated thymosin beta-4. (only b and y ions are shown, for a completely annotated spectrum see supplemental Fig. S3). B, comparison of top-down protein identifications made by searching the human IPI database (87,061 entires) or subsetDB (5455 entires) showing that almost all proteins can be identified in the 15x smaller subsetDB. C, distribution of precursor ion masses leading to a successful top-down identification. D, normalized sequence coverage plot of top-down identified proteins in which each line represents one protein. The darker the gray scale density, the more spectra matched to the respective region of the protein indicating that most proteins identified from MALDI IMS samples are fragments of the original protein sequence.
MaTisse: a Searchable Database of Protein Identifications in MALDI IMS Studies
To facilitate the translation of protein identifications made in different IMS studies, we have created a new database, MaTisse, which contains the complete bottom up matrix and tissue proteomes as well as the top-down identifications made in this study. In addition, we supplemented MaTisse with protein identification data from the published literature. MaTisse enables scientists to search either for proteins or for m/z values resulting in the rapid identification of potential protein candidates that generally facilitates the association of m/z values to proteins in any MALDI IMS study. Because of this unique feature, we anticipate that MaTisse will become a valuable source of information for the MALDI IMS community.
DISCUSSION
The application of MALDI IMS of proteins has grown steadily over the past 15 years. At the same time, there still is a striking discrepancy between the sophistication with which such images can be generated and the ability to identify the underlying proteins. Out of the many hundreds of publications reporting MALDI IMS data and biomarkers, only about 22 (13 human, 9 rodent), and mostly very recent papers, have also revealed the name of the protein. There are many reasons for this general inability to identify a protein using MALDI IMS. First, a mass measurement of a protein or fragment thereof as provided by MALDI IMS is not a good indicator for protein identity because any such mass can be generated from nearly any protein sequence within the mass accuracy of the experiment (1–2 Da). Second, the direct mass spectrometric sequencing of the detected m/z feature in a MALDI mass spectrum is generally not possible owing to the generally inadequate sensitivity, resolution and mass accuracy and mass range of these instruments in tandem MS mode. Many researchers have therefore decoupled the imaging experiment from the protein identification experiment and resorted to detailed bottom-up proteomic analysis of a separate tissue sample from which the image was created (28). In a more sophisticated approach, on-tissue tryptic digestion followed by MS analysis has been employed for protein identification (7). Although these have sometimes been successful, they are also time consuming and, in fact, there has often been a fair amount of ‘educated guessing’ in trying to connect molecular weight information from the MALDI IMS experiment to a list of proteins identified from a tissue. The above shortcomings have plagued the field to an extent that there is growing concern, at least in parts of the community, about the general value of m/z feature information for biomarker discovery in the absence of protein identification information. This is because the identity of any biomarker must be known to validate and develop it into a useful clinical tool.
In this study, we have taken an alternative approach to solving the above issues. We reasoned that any protein detectable by MALDI IMS must not only be present in the underlying tissue, but also reside in the matrix layer of the tissue preparation. We therefore developed a simple extraction procedure that recovers the proteins from the matrix, digested them with the protease trypsin and identified the “matrix proteome” by high performance LC-MS/MS. Exemplified on ten human tissues, this enabled us to generate a shortlist of ∼1400 mostly small, abundant and soluble proteins that contain nearly all MALDI IMS protein biomarkers reported in the literature thus far. Proteins (e.g. E2F3, S100B) that were found only rarely (or never) may have been difficult to distinguish from closely related proteins, possibly misidentified in the original publication, or of too low abundance in the tissues analyzed here (e.g. myelin basic protein, MBP, P02686, which is essentially only expressed in central nervous system tissue, http://www.proteinatlas.org/ENSG00000197971). Many of the reported biomarkers were identified in many if not most of the tissues analyzed here. For example, the pro-inflammatory cytokine MIF (macrophage migration inhibitory factor, P14174) was found in all ten tissues as well as each of the acetonitrile extracts and this is also true for many other cases. Ingenuity pathway analysis (IPA) of protein identified here and in the MALDI IMS literature (both human and rodents) show significant overrepresentation of, for example, “mitochondrial dysfunction” and “EIF2 signaling” both of which are intimately linked to cancer (supplemental Table S8). In light of the above and because IMS biomarkers are generally abundant proteins, our observations strongly suggest that IMS biomarkers are mostly molecular surrogate markers of rather broad specificity rather than proteins involved in the molecular mechanism underlying a specific disease or physiology.
Compared with direct MALDI MS/MS or on-tissue digestion, the bottom-up LC-MS/MS approach has the advantage of superior sensitivity and analytical depth (i.e. the number of proteins that can be identified). Still, it is important to connect a protein identification back to the m/z feature measured in the IMS experiment. To affect this, we subjected the proteins extracted from the MALDI matrix layer to direct top-down LC-MS/MS and confidently identified 124 proteins in this way from four human tissues. To the best of our knowledge, it is the first time that this has been successfully demonstrated on MALDI IMS samples. The top-down analysis has been greatly aided by the short list of proteins identified from the tissues and assembled in the subsetDB and by employing a very high performance mass spectrometer (36).This subsetDB is 4× smaller than Swissprot and 15× smaller than the original human IPI database commonly used in proteomics (37) and thus vastly reduces the number of proteins that have to be considered in a database search and increases the confidence in peptide identification scores. Because no protease can be specified in the search, the very high mass accuracy afforded by the mass spectrometer (single digit ppm) for intact peptides as well as fragment ions together with the small sequence database enables searching the data in a reasonable time and reduces the number of possible false positive identifications (38).
An interesting observation from our literature survey and the top-down analysis is that the majority of the IMS biomarkers reported in the literature were detected as full length, unmodified proteins whereas the top-down analysis clearly showed that many of the m/z species in the matrix layer are fragments of much larger proteins (Fig. 4D) or post-translationally modified (Fig. 4A). This has been generally overlooked in the past because these fragments could technically not be readily identified. It further suggests that many more IMS biomarkers could now be identified without the common “educated molecular weight guessing” based on the simple (but often invalid) assumption that a protein would be detected as an intact, unmodified molecule. Recent evidence suggests that the fragmented proteins are not the result of sample preparation and degradation artifacts but are genuine and discriminating surrogates of biological processes occurring in the respective tissue (25, 27, 39).
Despite the very considerable methodological progress represented by this study, there are areas that should be improved. First, the typical productive range of MALDI IMS for the detection of biomarkers is about 25 kDa yet our top-down analysis so far only extends to 12 kDa. This is not a principle limit of the method and we indeed detected larger precursor ions in the primary mass spectrometry data, but the current sensitivity of the LC-MS/MS system precluded their identification by tandem mass spectrometry. Second, by recovering proteins from the MALDI matrix layer, the spatial context, i.e. the x-y coordinates at which the MALDI IMS experiment detected a particular protein within the tissue is lost. It would obviously be highly desirable if this information could be retained. Using laser capture microdissection (LCM) (40) or more elegant local extraction of the matrix (41) should improve this but, again, the sensitivity of current LC-MS/MS systems cannot yet analyze such material.
Overall, we believe that the method proposed in this study is a very significant improvement over current practice in the field as it removes the protein identification issue as perhaps the most disabling factor in MALDI IMS. The bottom-up identification of proteins from the MALDI matrix layer is generic, very easily performed and the database MaTisse in which all the information of our study as well as that of the literature is assembled, constitutes a valuable database for the identification of biomarkers. In fact, we recommend including this step in any MALDI IMS study to define the set of proteins from which a biomarker will eventually be drawn. The top-down approach is technically somewhat more demanding but as more and more high performance mass spectrometry systems become available, this crucial step will also become more easily taken than previously possible. Using this or similar future approaches, we think that more and more IMS biomarkers will be furnished with a protein name from now on, which will be of tremendous value in validating and developing these molecules for use in basic research as well as the clinic.
Supplementary Material
Acknowledgments
We thank Zhixiang Wu and Fiona Pachl for excellent support with the Orbitrap systems, Harald Marx and Mathias Wilhelm for bioinformatics support and Mareike Elsner and Sonja Englert for provision of samples.
Footnotes
* This work was supported in part by a grant provided by the German Ministry for Education and Research (BMBF), grant number: 0315508WP2 (to SKM and AKW).
 This article contains supplemental Figs. S1 to S4, Tables S1 to S8, and Files S1 and S2.
1 The abbreviations used are:
- FDR
- false discovery rate
- FFPE
- formalin fixed paraffin embedded
- HCD
- higher collision energy dissociation
- IAA
- iodoacetamide
- IMS
- imaging mass spectrometry
- ITO
- Indium-Tin-Oxide
- LDS
- lithium dodecyl sulphate
- NP40
- nonyl phenoxylpolyethoxylethanol 40.
REFERENCES
- 1. Balluff B., Schöne C., Höfler H., Walch A. (2011) MALDI imaging mass spectrometry for direct tissue analysis: technological advancements and recent applications. Histochem. Cell Biol. 136, 227–244 [DOI] [PubMed] [Google Scholar]
- 2. Caprioli R. M., Farmer T. B., Gile J. (1997) Molecular imaging of biological samples: localization of peptides and proteins using MALDI-TOF MS. Anal. Chem. 69, 4751–4760 [DOI] [PubMed] [Google Scholar]
- 3. Römpp A., Guenther S., Takats Z., Spengler B. (2011) Mass spectrometry imaging with high resolution in mass and space (HR(2) MSI) for reliable investigation of drug compound distributions on the cellular level. Anal. Bioanal. Chem. 401, 65–73 [DOI] [PubMed] [Google Scholar]
- 4. Signor L., Varesio E., Staack R. F., Starke V., Richter W. F., Hopfgartner G. (2007) Analysis of erlotinib and its metabolites in rat tissue sections by MALDI quadrupole time-of-flight mass spectrometry. J. Mass Spectrom. 42, 900–909 [DOI] [PubMed] [Google Scholar]
- 5. Liu Y., Chen Y., Momin A., Shaner R., Wang E., Bowen N. J., Matyunina L. V., Walker L. D., McDonald J. F., Sullards M. C., Merrill A. H., Jr (2010) Elevation of sulfatides in ovarian cancer: an integrated transcriptomic and lipidomic analysis including tissue-imaging mass spectrometry. Mol. Cancer 9, 186. [DOI] [PMC free article] [PubMed] [Google Scholar]
- 6. Chaurand P., Latham J. C., Lane K. B., Mobley J. A., Polosukhin V. V., Wirth P. S., Nanney L. B., Caprioli R. M. (2008) Imaging mass spectrometry of intact proteins from alcohol-preserved tissue specimens: bypassing formalin fixation. J. Proteome Res. 7, 3543–3555 [DOI] [PMC free article] [PubMed] [Google Scholar]
- 7. Schober Y., Guenther S., Spengler B., Römpp A. (2012) High-resolution matrix-assisted laser desorption/ionization imaging of tryptic peptides from tissue. Rapid Commun. Mass Spectrom. 26, 1141–1146 [DOI] [PubMed] [Google Scholar]
- 8. Wisztorski M., Franck J., Salzet M., Fournier I. (2010) MALDI direct analysis and imaging of frozen versus FFPE tissues: what strategy for which sample? Methods Mol. Biol. 656, 303–322 [DOI] [PubMed] [Google Scholar]
- 9. Deutskens F., Yang J., Caprioli R. M. (2011) High spatial resolution imaging mass spectrometry and classical histology on a single tissue section. J. Mass Spectrom. 46, 568–571 [DOI] [PMC free article] [PubMed] [Google Scholar]
- 10. Seeley E. H., Schwamborn K., Caprioli R. M. (2011) Imaging of intact tissue sections: moving beyond the microscope. J. Biol. Chem. 286, 25459–25466 [DOI] [PMC free article] [PubMed] [Google Scholar]
- 11. Kelleher N. L. (2012) A Cell-Based Approach to the Human Proteome Project. J. Am. Soc. Mass Spectrom. 23, 1617–1624 [DOI] [PMC free article] [PubMed] [Google Scholar]
- 12. Tipton J. D., Tran J. C., Catherman A. D., Ahlf D. R., Durbin K. R., Kelleher N. L. (2011) Analysis of Intact Protein Isoforms by Mass Spectrometry. J. Biol. Chem. 286, 25451–25458 [DOI] [PMC free article] [PubMed] [Google Scholar]
- 13. Elsner M., Rauser S., Maier S., Schöne C., Balluff B., Meding S., Jung G., Nipp M., Sarioglu H., Maccarrone G., Aichler M., Feuchtinger A., Langer R., Jütting U., Feith M., Küster B., Ueffing M., Zitzelsberger H., Höfler H., Walch A. (2012) MALDI imaging mass spectrometry reveals COX7A2, TAGLN2 and S100-A10 as novel prognostic markers in Barrett's adenocarcinoma. J. Proteomics. [DOI] [PubMed] [Google Scholar]
- 14. Balluff B., Rauser S., Meding S., Elsner M., Schöne C., Feuchtinger A., Schuhmacher C., Novotny A., Jütting U., Maccarrone G., Sarioglu H., Ueffing M., Braselmann H., Zitzelsberger H., Schmid R. M., Höfler H., Ebert M. P., Walch A. (2011) MALDI imaging identifies prognostic seven-protein signature of novel tissue markers in intestinal-type gastric cancer. Am. J. Pathol. 179, 2720–2729 [DOI] [PMC free article] [PubMed] [Google Scholar]
- 15. Schwartz S. A., Weil R. J., Johnson M. D., Toms S. A., Caprioli R. M. (2004) Protein profiling in brain tumors using mass spectrometry: feasibility of a new technique for the analysis of protein expression. Clin. Cancer Res. 10, 981–987 [DOI] [PubMed] [Google Scholar]
- 16. Rauser S., Marquardt C., Balluff B., Deininger S. O., Albers C., Belau E., Hartmer R., Suckau D., Specht K., Ebert M. P., Schmitt M., Aubele M., Höfler H., Walch A. (2010) Classification of HER2 receptor status in breast cancer tissues by MALDI imaging mass spectrometry. J. Proteome Res. 9, 1854–1863 [DOI] [PubMed] [Google Scholar]
- 17. Bauer J. A., Chakravarthy A. B., Rosenbluth J. M., Mi D., Seeley E. H., De Matos Granja-Ingram N., Olivares M. G., Kelley M. C., Mayer I. A., Meszoely I. M., Means-Powell J. A., Johnson K. N., Tsai C. J., Ayers G. D., Sanders M. E., Schneider R. J., Formenti S. C., Caprioli R. M., Pietenpol J. A. (2010) Identification of markers of taxane sensitivity using proteomic and genomic analyses of breast tumors from patients receiving neoadjuvant paclitaxel and radiation. Clin. Cancer Res. 16, 681–690 [DOI] [PMC free article] [PubMed] [Google Scholar]
- 18. Oppenheimer S. R., Mi D., Sanders M. E., Caprioli R. M. (2010) Molecular analysis of tumor margins by MALDI mass spectrometry in renal carcinoma. J. Proteome Res. 9, 2182–2190 [DOI] [PMC free article] [PubMed] [Google Scholar]
- 19. Schwamborn K., Krieg R. C., Reska M., Jakse G., Knuechel R., Wellmann A. (2007) Identifying prostate carcinoma by MALDI-Imaging. Int. J. Mol. Med. 20, 155–159 [PubMed] [Google Scholar]
- 20. Hardesty W. M., Kelley M. C., Mi D., Low R. L., Caprioli R. M. (2011) Protein signatures for survival and recurrence in metastatic melanoma. J. Proteomics. 74, 1002–1014 [DOI] [PMC free article] [PubMed] [Google Scholar]
- 21. M'Koma A. E., Seeley E. H., Washington M. K., Schwartz D. A., Muldoon R. L., Herline A. J., Wise P. E., Caprioli R. M. (2011) Proteomic profiling of mucosal and submucosal colonic tissues yields protein signatures that differentiate the inflammatory colitides. Inflamm. Bowel Dis. 17, 875–883 [DOI] [PMC free article] [PubMed] [Google Scholar]
- 22. Burnum K. E., Tranguch S., Mi D., Daikoku T., Dey S. K., Caprioli R. M. (2008) Imaging mass spectrometry reveals unique protein profiles during embryo implantation. Endocrinology 149, 3274–3278 [DOI] [PMC free article] [PubMed] [Google Scholar]
- 23. Stoeckli M., Staab D., Staufenbiel M., Wiederhold K. H., Signor L. (2002) Molecular imaging of amyloid beta peptides in mouse brain sections using mass spectrometry. Anal. Biochem. 311, 33–39 [DOI] [PubMed] [Google Scholar]
- 24. Hanrieder J., Ekegren T., Andersson M., Bergquist J. (2012) MALDI Imaging of Post Mortem Human Spinal Cord in Amyotrophic Lateral Sclerosis. J. Neurochem. [DOI] [PubMed] [Google Scholar]
- 25. Cazares L. H., Troyer D., Mendrinos S., Lance R. A., Nyalwidhe J. O., Beydoun H. A., Clements M. A., Drake R. R., Semmes O. J. (2009) Imaging mass spectrometry of a specific fragment of mitogen-activated protein kinase/extracellular signal-regulated kinase kinase kinase 2 discriminates cancer from uninvolved prostate tissue. Clin. Cancer Res. 15, 5541–5551 [DOI] [PubMed] [Google Scholar]
- 26. Kim H. K., Reyzer M. L., Choi I. J., Kim C. G., Kim H. S., Oshima A., Chertov O., Colantonio S., Fisher R. J., Allen J. L., Caprioli R. M., Green J. E. (2010) Gastric cancer-specific protein profile identified using endoscopic biopsy samples via MALDI mass spectrometry. J. Proteome Res. 9, 4123–4130 [DOI] [PMC free article] [PubMed] [Google Scholar]
- 27. Lemaire R., Menguellet S. A., Stauber J., Marchaudon V., Lucot J. P., Collinet P., Farine M. O., Vinatier D., Day R., Ducoroy P., Salzet M., Fournier I. (2007) Specific MALDI imaging and profiling for biomarker hunting and validation: fragment of the 11S proteasome activator complex, Reg alpha fragment, is a new potential ovary cancer biomarker. J. Proteome Res. 6, 4127–4134 [DOI] [PubMed] [Google Scholar]
- 28. Meding S., Balluff B., Elsner M., Schöne C., Rauser S., Nitsche U., Maak M., Schäfer A., Hauck S. M., Ueffing M., Langer R., Höfler H., Friess H., Rosenberg R., Walch A. (2012) Tissue Based Proteomics Reveals FXYD3, S100A11 and GSTM3 as Novel Markers for Regional Lymph Node Metastasis in Colon Cancer. The Journal of Pathology. [DOI] [PubMed] [Google Scholar]
- 29. Nipp M., Elsner M., Balluff B., Meding S., Sarioglu H., Ueffing M., Rauser S., Unger K., Höfler H., Walch A., Zitzelsberger H. (2012) S100-A10, thioredoxin, and S100-A6 as biomarkers of papillary thyroid carcinoma with lymph node metastasis identified by MALDI imaging. J. Mol. Med. 90, 163–174 [DOI] [PubMed] [Google Scholar]
- 30. Rahman S. M., Shyr Y., Yildiz P. B., Gonzalez A. L., Li H., Zhang X., Chaurand P., Yanagisawa K., Slovis B. S., Miller R. F., Ninan M., Miller Y. E., Franklin W. A., Caprioli R. M., Carbone D. P., Massion P. P. (2005) Proteomic patterns of preinvasive bronchial lesions. Am. J. Respir. Crit. Care Med. 172, 1556–1562 [DOI] [PMC free article] [PubMed] [Google Scholar]
- 31. Shevchenko A., Wilm M., Vorm O., Mann M. (1996) Mass spectrometric sequencing of proteins silver-stained polyacrylamide gels. Anal. Chem. 68, 850–858 [DOI] [PubMed] [Google Scholar]
- 32. Searle B. C. (2010) Scaffold: a bioinformatic tool for validating MS/MS-based proteomic studies. Proteomics 10, 1265–1269 [DOI] [PubMed] [Google Scholar]
- 33. Rappsilber J., Mann M., Ishihama Y. (2007) Protocol for micro-purification, enrichment, pre-fractionation and storage of peptides for proteomics using StageTips. Nat Protoc. 2, 1896–1906 [DOI] [PubMed] [Google Scholar]
- 34. Schirle M., Heurtier M. A., Kuster B. (2003) Profiling core proteomes of human cell lines by one-dimensional PAGE and liquid chromatography-tandem mass spectrometry. Mol. Cell Proteomics. 2, 1297–1305 [DOI] [PubMed] [Google Scholar]
- 35. Grey A. C., Chaurand P., Caprioli R. M., Schey K. L. (2009) MALDI imaging mass spectrometry of integral membrane proteins from ocular lens and retinal tissue. J. Proteome Res. 8, 3278–3283 [DOI] [PMC free article] [PubMed] [Google Scholar]
- 36. Michalski A., Damoc E., Lange O., Denisov E., Nolting D., Müller M., Viner R., Schwartz J., Remes P., Belford M., Dunyach J.-J., Cox J., Horning S., Mann M., Makarov A. (2012) Ultra High Resolution Linear Ion Trap Orbitrap Mass Spectrometer (Orbitrap Elite) Facilitates Top Down LC MS/MS and Versatile Peptide Fragmentation Modes. Mol Cell Proteomics. [DOI] [PMC free article] [PubMed] [Google Scholar]
- 37. Kersey P. J., Duarte J., Williams A., Karavidopoulou Y., Birney E., Apweiler R. (2004) The International Protein Index: an integrated database for proteomics experiments. Proteomics 4, 1985–1988 [DOI] [PubMed] [Google Scholar]
- 38. Pappin D. J., Hojrup P., Bleasby A. J. (1993) Rapid identification of proteins by peptide-mass fingerprinting. Curr. Biol. 3, 327–332 [DOI] [PubMed] [Google Scholar]
- 39. Lagarrigue M., Alexandrov T., Dieuset G., Perrin A., Lavigne R., Baulac S., Thiele H., Martin B., Pineau C. (2012) A new analysis workflow for MALDI imaging mass spectrometry: application to the discovery and identification of potential markers of Childhood Absence Epilepsy. J. Proteome Res. [DOI] [PubMed] [Google Scholar]
- 40. Waanders L. F., Chwalek K., Monetti M., Kumar C., Lammert E., Mann M. (2009) Quantitative proteomic analysis of single pancreatic islets. Proc. Natl. Acad. Sci. U.S.A. 106, 18902–18907 [DOI] [PMC free article] [PubMed] [Google Scholar]
- 41. Eikel D., Vavrek M., Smith S., Bason C., Yeh S., Korfmacher W. A., Henion J. D. (2011) Liquid extraction surface analysis mass spectrometry (LESA-MS) as a novel profiling tool for drug distribution and metabolism analysis: the terfenadine example. Rapid Commun. Mass Spectrom. 25, 3587–3596 [DOI] [PubMed] [Google Scholar]
Associated Data
This section collects any data citations, data availability statements, or supplementary materials included in this article.