

Abstract
One of the principal goals of glycoprotein research is to correlate glycan structure and function. Such correlation is necessary in order for one to understand the mechanisms whereby glycoprotein structure elaborates the functions of myriad proteins. The accurate comparison of glycoforms and quantification of glycosites are essential steps in this direction. Mass spectrometry has emerged as a powerful analytical technique in the field of glycoprotein characterization. Its sensitivity, high dynamic range, and mass accuracy provide both quantitative and sequence/structural information. As part of the 2012 ABRF Glycoprotein Research Group study, we explored the use of mass spectrometry and ancillary methodologies to characterize the glycoforms of two sources of human prostate specific antigen (PSA). PSA is used as a tumor marker for prostate cancer, with increasing blood levels used to distinguish between normal and cancer states. The glycans on PSA are believed to be biantennary N-linked, and it has been observed that prostate cancer tissues and cell lines contain more antennae than their benign counterparts. Thus, the ability to quantify differences in glycosylation associated with cancer has the potential to positively impact the use of PSA as a biomarker. We studied standard peptide-based proteomics/glycomics methodologies, including LC-MS/MS for peptide/glycopeptide sequencing and label-free approaches for differential quantification. We performed an interlaboratory study to determine the ability of different laboratories to correctly characterize the differences between glycoforms from two different sources using mass spectrometry methods. We used clustering analysis and ancillary statistical data treatment on the data sets submitted by participating laboratories to obtain a consensus of the glycoforms and abundances. The results demonstrate the relative strengths and weaknesses of top-down glycoproteomics, bottom-up glycoproteomics, and glycomics methods.
The fact that most proteins are glycosylated underscores the critical roles played by glycosylation during evolution; glycoconjugate expression is a key mechanism whereby organisms maintain fitness in response to evolutionary pressures (1). All living cells are coated with glycoconjugates, through which they interact with their environment. Glycans consist of combinations of epitopes built on common core structures (2). These epitopes are recognized by carbohydrate-binding lectin domains present in numerous protein families. Thus, glycosylation serves to modulate the adhesive properties of a glycoprotein. In this way, the function of a glycan arises through the protein(s) to which it binds.
The attachment of N-glycans to proteins in the endoplasmic reticulum is part of the calnexin–calreticulin protein-folding quality-control pathway. Glycans may subsequently be elaborated in the Golgi apparatus to acquire complex architecture as a result of the actions of a series of biosynthetic enzymes. The mature glycan structures are heterogeneous, a reflection of the fact that the biosynthetic events do not go to completion. It appears that function arises in the context of heterogeneous glycans built on common cores. This heterogeneity of N-glycans has biological effects through elaboration of the physico-chemical properties and biological functions of proteins.
Protein N-glycosylation occurs primarily on NXT/NXS consensus sites (X should not be P). Although a given protein may have several such consensus sites, typically not all are occupied. Partial occupation of a consensus site in a population of protein molecules is also possible. The structures of glycans on a given glycoprotein molecule differ depending on the glycosylation site. The N-glycan structures are generally classified into three different categories (high mannose, complex, and hybrid types) and are characterized by a common chitobiose core (Man3GlcNAc2). Thus, the glycan structure at a given site affects protein function through the lectin-glycan binding interactions it enables. As a result, it is necessary to develop analytics capable of confident mapping of the N-glycan structures present on a given asparagine residue on a given glycoprotein. The range of N-glycans expressed becomes altered during the development of cancer (3–5). Specifically, tumor cells display increased β1–6 branching of N-glycans as a result of the up-regulation of GlcNAc transferase V (6–8). In addition, the change in the amount and linkage of sialic acids (9–12) and the expression of N-glycolylneuraminic acid in human tumors (13, 14) have been described, but structural detail is required in order to improve understanding from a mechanistic and pathological point of view.
The goal of glyco-analytics is to determine glycoprotein structures that represent those giving rise to biological function in a given context. Profiling produces information about the composition of biomolecules. The tandem mass spectrometry dimension confirms the composition (15, 16). The high sensitivity, dynamic range, and mass accuracy of tandem mass spectrometry data can provide both quantitative and sequence/structural information that, in principle, can enable systems-wide “omics” experimentation for glycoproteins (17, 18).
In recent years, a Human Proteome Organization study compared methods for profiling glycoprotein N-glycans (19). The study demonstrated the effectiveness of matrix-assisted laser desorption (MALDI)1 time-of-flight (TOF) MS for profiling permethylated glycans and of electrospray ionization LC-MS for the profiling of native and reductively aminated glycans. Most of the glycopeptide data submitted for the study were qualitative in nature. A second Human Proteome Organization study focused on methods for the profiling of O-glycosylation. Two approaches were particularly effective: the direct MS analysis of permethylated reduced glycans, and the analysis of native reduced glycans in negative mode via LC-MS (19, 20). That study was semi-quantitative in nature.
The focus of the 2012 Glycoprotein Research Group ABRF study was on evaluating methods for site-specific glycoprotein glycosylation profiling (18, 21–23). In order to determine relative quantities of specific glycans occupying a given site, it is necessary to detect the glycopeptides or glycoprotein directly. This requirement is the crux of the analytical challenge. Glycosylation decreases the peptide hydrophobicity and thus the ionization efficiency of glycopeptides. The heterogeneous nature of glycosylation complicates the task of assigning observed masses to compositions. A peptide containing an N-glycosylation consensus sequence is expected to be modified with a series of glycan compositions. Thus, it may be necessary to use tandem MS in order to assign unambiguously the composition of a glycan that modifies a given peptide.
The goal of this study was to determine the ability of the field to conduct comparative analysis of glycoprotein glycosylation using human prostate specific antigen (PSA) as the target. We selected PSA as the target molecule for the present study for two reasons. Firstly, PSA is a low-molecular-weight glycoprotein (∼30,000 Da) characterized by a single site of N-glycosylation at Asn-69. This single glycosylation site permitted participants to use bottom-up, peptide-N-glycosidase F (PNGase F), or top-down glycosylation profiling. Secondly, there is significant biological interest in the PSA glycosylation structure: PSA is used as a screening biomarker for prostate cancer. PSA is secreted as a proenzyme into the lumen of the prostate gland. In cases of prostate disease, the basement membrane can become disrupted, resulting in PSA access to the peripheral circulation; however, the correlation between concentration of PSA and cancer is not absolute. If the concentration of PSA in blood plasma is in the range of 2.5–10 ng/ml, a man has a 25% chance of prostate cancer and a 75% chance of no disease, prostatitis, or benign prostatic hyperplasia. If the concentration of PSA in the plasma increases to more than 10 ng/ml, the likelihood of cancer increases to >60%. Age, race, family history of prostate cancer, PSA level, PSA velocity, digital rectal examination result, and previous prostate biopsy are factors that can influence the probability of cancer. There is a strong need to improve the specificity of prostate cancer detection in order to minimize harm to patients through unnecessary surgical treatment. Researchers have tried different approaches for improving this specificity. In the blood, PSA may be free or complexed with alpha-1-antichymotrypsin or alpha macroglobulin. The ratio of free to complexed PSA may serve as an indication of prostate cancer (25). The detection of cancer-specific isoforms of PSA may permit discrimination between benign and malignant cases (26, 27). Another promising approach is related to the glycosylation profile of PSA. There is a great deal of interest in exploiting the alteration of protein glycoforms that may occur with cancer development in order to improve biomarker performance (28–30).
The goal of this study was to determine the ability of the international glycoproteomics community to compare N-glycosylation in two different sources of PSA via mass spectrometry. For practical reasons, including the need to obtain samples of adequate quantity, adequate purity, and reasonable cost, we chose a commercially available source of PSA. Two different forms of PSA with different glycosylation profiles were obtained by the commercial vendor from the bulk purification of seminal fluid. The PSA samples were characterized by the study organizers in order to demonstrate their suitability. These preliminary data were not shared with the participants. In total, 35 samples of PSA and PSA high isoform were sent to laboratories around the world, and 25 data sets were returned. Here we present the study results and a global overview of the approaches and methodologies used for differential characterization, and we highlight challenges faced by researchers in this area. We used statistical methods and comparative analysis to derive a consensus on the interlaboratory data, with the ultimate goal of comparing the glycoforms both qualitatively and quantitatively. We evaluated which sample preparation, separation, and analysis methods produced the most consistent results. We then built a consensus data set for the two sources of PSA and used it to show which glycan compositions differed significantly in abundance between the two sources. The results demonstrate the challenges in achieving reproducible results using bottom-up analysis of proteolytic glycopeptides.
MATERIALS AND METHODS
Guidelines for the 2012 ABRF Glycoprotein Research Group Study
A description of the glycoproteins and a brief background on the study were sent to each participant along with the samples. We highlighted different approaches that the participants might explore in their approach (top-down, bottom-up, and analysis of released glycans), based upon preliminary analysis of the samples in our laboratory. The term “top-down” includes intact protein mass profiling and intact protein tandem MS. We suggested that participants use bottom-up LC-MS/MS and label-free quantification on glycopeptides for both qualitative and differential quantitative analysis. We also asked participants to consider carefully the choice of enzyme, cleanup, chromatography, mass spectrometry (high and low resolution and mass accuracy), and tandem MS methods (supplemental Fig. S1).
Samples
PSA and PSA high isoform samples were obtained as a gift from Lee Biosolutions (St. Louis, MO). PSA and PSA High Isoelectric Point Isoform (PSA high isoform) were purified from seminal fluid in lot-matched batches. PSA high isoform was obtained through a proprietary process used to bulk-purify proteins that is dependent upon isoelectric point. Each participant received 100 μg of PSA (lot number M02015) and 20 μg PSA high isoform (lot number M15097) in the same buffer. The proteins were stored in 0.05 m phosphate buffer, pH 7.5, containing 0.15 m NaCl and 0.09% NaN3 at 4°C. The samples were shipped using cold packs in a liquid state.
Participating Laboratories
In total, 35 PSA sample sets were sent to laboratories in North America (20), Europe (12), Australia (1), Japan (1), and China (1). After analysis, 24 laboratories sent back 26 data sets. Laboratories 2 and 9 completed two different data sets (designated a and b), one using bottom-up glycopeptide analysis and the other for glycans released using PNGase F. The survey results of laboratories 11, 15, 17, and 24 were not complete and consequently were not included in the final differential statistical study; however, their results were used to confirm observations made by the other participants.
Methodology
The analytical approaches that were used by the different participating laboratories are summarized in Table I. They included analysis of glycoproteins (top-down approach), analysis of glycopeptides (bottom-up approach), and analysis of released glycans (PNGase F approach). Traditional LC-MS/MS for peptide sequencing and label-free differential quantification as suggested in the participant guide were used by 17 participants. Four participants performed top-down analysis. Deglycosylation by PNGase F and analysis of the released N-glycans was performed by five participants. The analytical protocols used by each of the laboratories, including preparation of samples, enzymatic digestion conditions, and sample cleanup, are provided in supplemental Fig. S2.
Table I. Summary of analytical approaches and instrumentation used by the participating laboratories.
| Enzyme | Chrom. | Lab. | Instrument | MS/MS | Res/Mass Acc | Workup (Rep) | |
|---|---|---|---|---|---|---|---|
| (A) Bottom-up analysis of glycopeptides | Tryp | C18 | 1 | **AB SCIEX, QstarElite, Q-TOF | CID | 15,000; 20 ppm | 1 (2) |
| 2(a) | **Bruker, AmazonETD, Ion Trap | CID | 5,000/160 ppm | 2 | |||
| 3 | Thermo, LTQ-FT Ultra | CID | 25,000 | 1 (2) | |||
| 4 | Thermo, LTQ-FT Ultra | SID | 200,000/0.2 | 1 (10) | |||
| 5 | Thermo, LTQ Orbitrap XL | CID/HCD | 60,000 | 1 (4) | |||
| 6 | Thermo, LTQ Orbitrap Velos | CID/HCD | 15,000/<5 ppm | 3 | |||
| 7 | Thermo, LTQ Orbitrap Velos | CID/HCD | 60,000/<3 ppm | 1 (5) | |||
| 8 | Thermo, LTQ Orbitrap Elite | HCD/ETD | 60,000/<10 ppm | 2 | |||
| PGC | 9(a) | Bruker, HCT 3D, Ion Trap | CID | 5,000/0.1–0.3 Da | 1 (1) | ||
| CE | 10 | Bruker, Maxis Quad, Q-TOF | CID | 40,000/1 mDa | 1 (1) | ||
| Chym | C18 | 11 | Thermo, LTQ-FT | CID | 100,000/10 ppm | 1 (2) | |
| 12 | AB SCIEX, Qstar Elite, Q-TOF | CID | 12,000/15 ppm | 3 | |||
| Tryp-Chym | 13 | Thermo, LTQ Orbitrap XL | CID | 30,000/5 ppm | 2 | ||
| ArgC | 14 | *Waters, QTOF Premier, Q-TOF | CID | 10,000/30 ppm | 1 (1) | ||
| 19(a)1 | Bruker, AmazonETD, Ion Trap | CID | 7,000/0.5 Da | 2 (3) | |||
| ArgC-Tryp | 15 | Thermo, LTQ | - | - | 1 (2) | ||
| LysC | C8 | 16 | Bruker, Maxis 4G, Q-TOF | CID | 45,000/<0.02 Da | 1 (1) | |
| C18 | 18(a)1 | Thermo, Orbitrap Elite | ETD/HCD | 240,000/<5 ppm | - | ||
| Lysyl Endo | C30 | 17 | ABI Voyager DEPro MALDI-TOF | - | 480/0.5 Da | - | |
| (B) Top-down | - | PLRP-S | 18(b) | Thermo, Orbitrap Elite | ETD/HCD | 240,000/<10 ppm | 2 |
| RP-4H | 19(b) | Bruker, Maxis 4G, Q-TOF | - | 40,000/10 ppm | 1 (2) | ||
| C8 | 20 | Bruker, Maxis, Q-TOF | - | 40,000/<0.2 Da | 1 (1) | ||
| CE | 21 | Bruker, micrOTOF-Q | - | 15,000/1 Da | 1 (1) | ||
| (C) Analysis of PNGAse F released glycans | PNGase F, Red | PGC | 9(b) | Agilent, MSD XCT 3D, Ion Trap | CID | 5,000/<0.3 Da | 1 |
| PNGase F, Red | PGC | 2(b) | Bruker, AmazonETD, Ion Trap | CID | >2,000/50 ppm | 2 | |
| PNGase F | PGC | 22 | Agilent, TOF 4224 | - | 10,000/<2 ppm | 2 (2) | |
| PNGase F Permet | - | 23 | Perspective Biosystem Voyager DE-RF, MALDI TOF | - | 10,000/<0.2 Da | 1 (3) | |
| PNGase F and other enzymes*** | HPAEC | 24 | Pulsed Amperometric Detection | - | Identification via standards | 1 (2) |
* Glycopeptides were enriched using a sialic acid capture-and-release protocol [27] where sialic acid is a prerequisite for the enrichment but is also removed during the procedure.
** ZIC-HILIC or HILIC cleanup.
*** Other enzymes used were α2–3 sialidase, non-specific neuraminidase, Neu5Ac.
1 Laboratory 18 and 19 carried out a bottom-up approach to confirm qualitative results obtained with their top-down approach. No quantitative data were submitted.
Bottom-up Methods
Glycopeptide analysis and label-free quantification were used to profile the N-glycans by 17 of 24 participating laboratories. Trypsin was the most popular choice of enzyme (laboratories 1–10). Other enzymes used were chymotrypsin (laboratories 11 and 12) (31), chymotrypsin/trypsin (laboratory 13), endoproteinase Arg-C (laboratory 14), endoproteinase Arg-C/trypsin (laboratory 15), endoproteinase Lys-C (laboratory 16), and lysyl endoproteinase (laboratory 17). LC-MS with reversed-phase C18 chromatography was used by 11 laboratories (1–8 and 11–15). Other approaches included capillary electrophoresis (CE) (laboratory 10), porous graphitized carbon chromatography (laboratory 9), and reversed-phase C8 chromatography (laboratory 16). Laboratories 1 and 2 enriched the products obtained from the trypsin digestion with hydrophilic interaction chromatography. Laboratory 17, based upon preliminary MALDI analysis, used a C30 reversed-phase cleanup approach to separate glycopeptides from peptides. Three laboratories (2, 9, and 17) used low-resolution mass spectrometry (full width at half-maximum) (r = 5000), and 7 (1, 6, 12, 14, 21, 22, and 23) used instruments with resolution between r = 10,000 and r = 20,000. Resolution greater than r = 20,000 was used by the other participants. The method of ionization used by all except laboratory 17 (MALDI) was electrospray. More than 80% of the participants acquired tandem MS data. Two laboratories (laboratories 8 and 18) used electron transfer dissociation to identify the site of glycosylation, and the other groups used collision-induced dissociation or higher energy C-trap dissociation, or a combination of the two. Laboratories 9, 2, 18, and 19 used the bottom-up approach in parallel with either PNGase F or top-down methods. Laboratories 2 and 9 furnished a complete data set for both experiments. We note that results indicating serious analytical problems (laboratories 11, 15, and 17) were not included in the final data analysis. Laboratory 15 did not detect any sialylated compounds; laboratory 11 enriched the chymotrypsin-obtained glycopeptides following digestion using a sialic acid capture-and-release protocol (31), furnishing a partial N-glycan profile; and laboratory 17 did not present any data corresponding to the glycoforms of PSA.
Top-down MS and Tandem MS
Intact protein mass profile measurements and top-down MS/MS were performed by laboratories 18(b), 19(b), 20, and 21, each of which opted for a different type of separation prior to MS: polymeric reversed-phase chromatography, reversed-phase monolithic chromatography, reversed-phase C8, and CE, respectively. Laboratory 18(b) reduced and alkylated the proteins prior to MS. Tandem MS approaches involved with the top-down analysis were electron transfer dissociation and higher energy C-trap dissociation for laboratory 18(b). Resolution higher than r = 240,000 and a mass accuracy better than 10 ppm were obtained. Laboratory 19 chose a two-step strategy to establish the N-glycan profiles. First a bottom-up approach using Arg-C digestion allowed the researchers to determine the N-glycan compositions. The resulting N-glycan compositions were used to facilitate the interpretation of the MS profile of the intact protein isoforms, and quantification was established on this intact protein profile. The resolution of the mass spectrometer used by this group was r = 40,000 with a mass accuracy of ∼10 ppm. Laboratories 19(b), 20, and 21 did not acquire any top-down tandem MS data. The deconvoluted mass spectra allowed the participants to interpret the N-glycan compositions by matching the mass differences with possible glycan compositions. Prior to the MS analysis, laboratory 21 separated the PSA sialylated glycoforms using CE. Laboratory 19(b) fractionated the glycoprotein using an RP-H4 column, and laboratory 20 fractionated the glycoprotein using C8 reversed-phase chromatography.
Deglycosylation by PNGase F and Analysis of Released N-glycans
The release of glycans using PNGase F followed by characterization via MS was performed by five laboratories. Laboratories 9(b), 2(b) (32), and 22 detected the released glycans by means of porous graphitized carbon LC-MS. Laboratory 21 used MALDI-TOF-MS to detect permethylated N-glycans. Laboratories 9 and 2 obtained collision-induced dissociation tandem MS data. The mass resolution used by the participating laboratories ranged from r = 2000 to r = 10,000. Laboratory 24 identified released N-glycans using high-pH anion exchange chromatography with a pulsed amperometric detector. The glycans of PSA and PSA high isoform were identified by comparing the elution times of those compounds with those of standards. Some glycans present at between 20% and 40% of relative intensity were not characterized and remained unknown. This N-glycan profile therefore presented too many unidentified glycans and was thus not included in the statistical analysis of the interlaboratory data.
Interpretation of Tandem MS Data
More than 75% of the participating laboratories acquired tandem MS data to propose the N-glycan profiles of PSA and PSA high isoform. Whereas MS data might allow one to propose a composition based upon mass accuracy, mass differences, and knowledge of the compounds studied (glycans, glycopeptides, and glycoproteins), tandem MS data confirm the assignment. The majority of laboratories analyzed the tandem data manually, clearly indicating the lack of informatics tools necessary for their interpretation (supplemental Fig. S3). Laboratories reported using the following software for bottom-up data: FindPept (33) (laboratory 2(a)), Glycopep (34) (laboratory 3), SimGlycan (35) (laboratory 8), and GlyPID (36) (laboratory 6). One laboratory used Prosight PC 3.0 software (37, 38) for top-down data. Laboratory 19(a) used a combination of ProteinScape and Glycoquest (Bruker Daltonics Bremen, Germany) for processing bottom-up data to interpret the glycopeptides obtained from an Arg C digestion. After interpretation of the glycans, that laboratory reported the global interpretation from top-down data. Laboratories 20 and 21 did not acquire tandem MS data and presented their results solely based upon the MS profile. Laboratories 2 and 9 performed a bottom-up approach, reported as 2(a) and 9(a), and analysis of glycans released using PNGase F digestion, reported as 2(b) and 9(b).
Data Analysis
Each participating laboratory furnished a list of N-glycan compositions with their corresponding relative intensities for PSA and PSA high isoform. The lists ranged from 8 to 58 glycan compositions. Prior to processing via statistical treatment, all compounds with intensities lower than 0.1% or that were observed by only one laboratory (or both) were removed from the data set. Once data from the 22 complete data sets had been combined, a total of 60 compositions passed this filter.
Statistical Data Analysis
The PSA samples represented the type of analytical challenge one might expect to characterize within a core laboratory. Although example protocols were suggested, the participants chose the methods used. The consequence was that it was necessary to use statistics appropriate for the variety of methods used and the number of participant data sets. To model the data across participating laboratories, primary statistical treatment using agglomerative hierarchical clustering (AHC) was performed. AHC (39, 40) is one of the most common statistical tools used to define the degree of similarity/dissimilarity between objects and groups. It allows for the iterative grouping or segmentation of objects—in this case, the intensities of N-glycan compositions from PSA and PSA high isoform obtained from different laboratories. Statistical analyses using AHC and manual confirmation of the clustering results were performed using R scripts and spreadsheets. Clustering was then performed to group the results from the participants.
Another goal of the study was to perform a comparison of the reliability and reproducibility of the methods employed by the laboratories in this study. We performed permutation tests to attempt to establish a ranking in the standard deviation of measured abundances, averaged across all glycans for each methodology (top-down, bottom-up, and PNGase F release). We calculated this average standard deviation for the true data from 22 laboratories and then for 10,000 permutations of methodology assignments and compared differences in our actual average standard deviations to those in our resampled data. AHC was then applied to the data to determine which N-glycans differed between the PSA and PSA high isoform, and in which proportions. We then applied the Wilcoxon signed-rank test (W-test) to the data. The W-test is a non-parametric test that evaluates the difference in the mean values of the two sample sets (PSA and PSA high isoform) and assigns for each glycan composition a p value, as recommended by Cairns (42) and Dakna et al. (43). The threshold of significance for the p value was established as 0.0008, which is the standard 0.05 confidence level adjusted for 60 tests conducted using a Bonferroni correction. The data were then plotted as a heat map, and a second application of AHC was performed across the N-glycans and the differences in intensity between PSA and PSA high isoforms.
RESULTS AND DISCUSSION
The study results were broken down into three aspects: sample integrity, qualitative analysis, and differential quantitative analysis. Preliminary analysis by the study organizers demonstrated that the PSA and PSA high isoform samples were of sufficient integrity for the interlaboratory study. Qualitative analysis was primarily concerned with determining the site of N-glycosylation and the description of the glycans contained in PSA and PSA high isoform. Correlation of the results obtained from different laboratories was then performed in order to rank the experimental approaches. Finally, we measured the degree of consistency in the differential quantification of glycans in order to determine the best consensus set of results.
Sample Integrity
Prior to shipment, the purity of the samples was assessed using LC-MS-based proteomics and SDS-PAGE (supplemental Fig. S1). As the samples were shipped with cold packs to participating laboratories, we took note of the transport time for each sample, which varied from overnight to more than 7 days. Degradation of the proteins was thus a concern (32). We addressed this problem by measuring the results of two laboratories that received the samples within different time frames: 24 h (laboratory 23), and more than 7 days (laboratory 9). Laboratory 9 profiled the glycans of PSA by immobilizing PSA on PVDF membrane, digesting with PNGase F, reducing the released N-glycans, and cleaning up via methanol precipitation. Laboratory 22 deglycosylated the PSA using PNGase F in solution and followed with permethylation of the glycans and subsequent MS analysis. The glycan profiles of PSA and PSA high isoform obtained by these two laboratories were similar, indicating that the proteins had not degraded significantly during transportation (supplemental Fig. S4).
Qualitative Analysis of Glycan Isoforms on PSA and PSA High Isoform
Site Determination
Almost all laboratories using bottom-up or top-down methodology correctly assigned the N-glycosylation site at position Asn-69 for PSA and PSA high isoform. Some laboratories (laboratories 15, 17, 20, and 21) did not perform MS2 experiments to identify the site of glycosylation.
Four laboratories reported additional glycosylation sites. Two laboratories (18(a) and 19(a)) reported an N-glycosylation site at Asn-78, presumed to be due to a mutation of aspartic acid to asparagine for the PSA, described as a high-mannose type with a main composition of Hex5HexNAc2. This mutated form of PSA was reported by laboratory 19(a) as a trace contaminant of the PSA sample. We noted that the identified peptide sequence SFPHPLYNMSLLK was homologous to a peptide of kallikrein 2 (KLK2) and that the sequence homology between KLK2 and PSA (KLK3) is ∼77%. KLK2 plays a role in the proteolytic activation of PSA (44), and there was a possibility that KLK2 was co-isolated with PSA. KLK2 was not detected in our proteomics data. The results from the bottom-up approach of laboratory 18(a) remove any ambiguity regarding the presence of KLK2 as a contaminant. The identified peptide sequence reported by laboratory 18(a) was SVILLGRHSLFHPEDTGQVFQVSHSFPHPLYNMSLLK, and not the identified sequence NSQVWLGRHNLFEPEDTGQRVPVSHSFPHPLYNMSLLK issuing from KLK2.
Laboratory 11 performed enrichment of the glycopeptides prior to MS analysis by using a sialic acid capture-and-release procedure; the results were consistent with the presence of an O-glycosylation site for PSA high isoform only. The O-glycosylation site was reported on the amino acid Ser-23 based on tandem MS data. A Mascot search identified the peptide sequence LILSRIVGGW carrying the O-glycan composition HexNAcHexNeuAc. Laboratory 24 used an indirect method to identify potential O-glycosylation. The amounts of glucosamine and galactosamine were determined using monosaccharide analysis of acid hydrolyzed samples of both the intact PSA samples. There was a slight increase in the amount of galactosamine in PSA high isoform relative to PSA when the entire protein was hydrolyzed, suggesting an increased amount of O-glycosylation in the PSA high isoform. In parallel, the N-glycans of both proteins were released by PNGase F and isolated. Galactosamine and glucosamine amounts in the N-glycans were measured and observed to be constant for the released N-glycans; however, given that other proteins were present in the samples, it cannot be determined conclusively that the unaccounted-for galactosamine abundance was due to O-glycosylation of PSA.
N-glycans of PSA and PSA High Isoform
The 22 complete data sets identified 142 glycoforms for PSA and PSA high isoform together. Each glycoform that was observed by only one laboratory or with an intensity lower than 0.1% was eliminated. A total of 61 glycoforms passed this initial filter for PSA and PSA high isoform, reducing the initial data set by more than 57%. The reductions in data, according to the method used, were as follows: top-down, 27% of the non-significant compounds; bottom-up, 16%; and PNGase release, 14%.
The N-glycans of PSA and PSA high isoform with a relative intensity greater than 0.1% and detected by more than one laboratory were then classified into three sub-groups to facilitate data interpretation (Table II).
Table II. Percentage of participating laboratories detecting N-glycan. The percentage of N-glycan detected has been calculated for the methods used (bottom-up, top-down, and PNGase). For example, the compound Hex5HexNAc4NeuAc1 was detected by 82% of the total participating labs (18 out of 22 participating labs), by 71% of the participants using a bottom-up approach (12 out of 17 labs), and by 100% of the participants using top-down and PNGase approaches (4 out of 4 labs). The up-arrows indicate that the percentage of N-glycan detected per methodology is higher than the percentage of N-glycan detected for all the participants. The right-facing arrows indicate that both percentages are the same. The down-arrows indicate that the percentage of N-glycan detected per methodology is lower than the percentage of N-glycans detected by all the participating laboratories. The top-down and PNGase methodologies presented better detection efficiencies than the bottom-up approach for the major and intermediate N-glycans. The minor compounds did not present any such trend.
| Class | Composition | Percentage of participating laboratories (%) | Bottom-up (%) | Top-down (%) | PNGAse (%) |
|---|---|---|---|---|---|
| Major glycan | Hex5HexNAc4dHex1NeuAc1 | 95 | ↓ 93 | ↑ 100 | ↑ 100 |
| Hex5HexNAc4dHex1NeuAc2 | 93 | ↓ 89 | ↑ 100 | ↑ 100 | |
| Hex5HexNAc4NeuAc2 | 84 | ↓ 75 | ↑ 100 | ↑ 100 | |
| Hex5HexNAc4NeuAc1 | 82 | ↓ 71 | ↑ 100 | ↑ 100 | |
| Hex4HexNAc3dHex1NeuAc1 | 80 | ↓ 75 | ↑ 88 | ↑ 88 | |
| Hex4HexNAc4dHex1NeuAc1 | 80 | ↓ 71 | ↑ 88 | ↑ 100 | |
| Hex6HexNAc3NeuAc1 | 68 | ↓ 64 | ↑ 75 | ↑ 75 | |
| Intermediate N-glycan | Hex4HexNAc5dHex1NeuAc2 | 61 | → 61 | ↑ 63 | ↑ 63 |
| Hex5HexNAc4dHex1 | 61 | ↑ 64 | ↑ 75 | ↓ 38 | |
| Hex4HexNAc5 NeuAc1dHex1 | 57 | ↓ 46 | ↑ 100 | ↓ 50 | |
| Hex4HexNAc3NeuAc1 | 57 | ↓ 43 | ↑ 63 | ↑ 100 | |
| Hex4HexNAc5NeuAc1 | 55 | ↓ 43 | ↑ 63 | ↑ 88 | |
| Hex4HexNAc4NeuAc1 | 52 | ↓ 43 | ↑ 63 | ↑ 75 | |
| Hex4HexNAc3dHex1 | 52 | ↓ 50 | ↓ 50 | ↑ 63 | |
| Hex3HexNAc5dHex1NeuAc1 | 41 | ↓ 39 | ↑ 50 | ↓ 38 | |
| Hex5HexNAc2 | 34 | ↓ 25 | ↓ 25 | ↑ 75 | |
| Hex4HexNAc4dHex1 | 34 | ↑ 36 | ↓ 25 | ↑ 38 | |
| Hex4HexNAc5NeuAc2 | 34 | ↓ 25 | ↑ 50 | ↑ 50 | |
| Minor N-glycan | Hex5HexNAc3NeuAc1 | 27 | ↓ 14 | ↑ 63 | ↑ 38 |
| Hex3HexNAc5NeuAc1 | 25 | → 25 | → 25 | → 25 | |
| HexNAc5dHex1NeuAc1Hex4SO3 | 23 | ↓ 21 | ↓ 13 | ↑ 38 | |
| Hex4HexNAc5dHex1 | 23 | ↑ 25 | ↑ 25 | ↓ 13 | |
| Hex6HexNAc2 | 23 | ↓ 4 | ↑ 25 | ↑ 88 | |
| Hex6HexNAc3 | 23 | ↓ 21 | ↑ 50 | ↓ 0 | |
| Hex5HexNAc4 | 20 | ↑ 25 | ↓ 0 | ↑ 25 | |
| Hex5HexNAc5NeuAc2 | 20 | ↓ 11 | ↑ 63 | ↓ 13 | |
| Hex4HexNAc5 | 20 | ↓ 11 | ↑ 50 | ↑ 25 | |
| Hex5HexNAc5dHex1NeuAc1 | 20 | ↓ 18 | ↑ 50 | ↓ 0 | |
| Hex3HexNAc4dHex1NeuAc1 | 20 | ↓ 14 | ↑ 38 | ↑ 25 | |
| Hex6HexNAc3dHex1NeuAc1 | 20 | ↑ 29 | ↓ 0 | ↓ 13 | |
| NeuAc1Hex6HexNAc4 | 18 | ↓ 14 | ↑ 50 | ↓ 0 | |
| Hex4HexNAc2 | 18 | ↓ 14 | ↓ 0 | ↑ 50 | |
| Hex4HexNAc5dHex1SO3 | 18 | ↑ 21 | ↓ 0 | ↑ 25 | |
| Hex5HexNAc4dHex2NeuAc1 | 18 | ↑ 21 | ↓ 0 | ↑ 25 | |
| Hex3HexNAc6dHex1NeuAc1 | 16 | ↓ 11 | ↑ 38 | ↓ 13 | |
| Hex5HexNAc5 | 14 | ↑ 14 | ↓ 0 | ↑ 25 | |
| Hex6HexNAc5dHex1NeuAc2 | 14 | ↓ 11 | ↓ 13 | ↑ 25 | |
| Hex6HexNAc4NeuAc2 | 14 | ↓ 4 | ↑ 50 | ↓ 13 | |
| Hex6HexNAc5dHex1NeuAc3 | 14 | ↓ 7 | ↑ 25 | ↑ 25 | |
| Hex5HexNAc5NeuAc1 | 14 | ↑ 14 | ↑ 25 | ↓ 0 | |
| Hex4HexNAc5NeuAc1SO3 | 14 | ↑ 14 | ↓ 0 | ↑ 25 | |
| Hex3HexNAc6NeuAc1 | 14 | ↑ 14 | ↓ 13 | ↓ 13 | |
| Hex3HexNAc3dHex1 | 11 | ↑ 18 | ↓ 0 | ↓ 0 | |
| Hex3HexNAc4dHex1 | 11 | ↑ 18 | ↓ 0 | ↓ 0 | |
| Hex5HexNAc5 dHex1 | 11 | ↓ 4 | ↑ 50 | ↓ 0 | |
| Hex6HexNAc3 dHex1 | 11 | ↓ 4 | ↑ 38 | ↑ 13 | |
| Hex3HexNAc3dHex1NeuAc1 | 9 | ↑ 14 | ↓ 0 | ↓ 0 | |
| Hex3HexNAc4dHex1SO3 | 9 | ↓ 7 | ↑ 25 | ↓ 0 | |
| Hex3HexNAc5SO3 | 9 | ↓ 7 | ↓ 0 | ↑ 25 | |
| Hex5HexNAc5NeuAc1dHex2 | 9 | ↑ 11 | ↓ 0 | ↑ 13 | |
| Hex3HexNAc5(SO3)2 | 7 | ↓ 4 | ↓ 0 | ↑ 25 | |
| Hex4HexNAc4NeuAc1SO3 | 7 | ↓ 4 | ↓ 0 | ↑ 25 | |
| Hex6HexNAc4dHex1 | 7 | ↓ 0 | ↑ 38 | ↓ 0 | |
| Hex6HexNAc5 | 7 | ↓ 0 | ↑ 13 | ↑ 25 | |
| HexNAc1 | 7 | ↓ 0 | ↑ 38 | ↓0 | |
| Hex7HexNAc3NeuAc1 | 7 | ↑ 11 | ↓ 0 | ↓ 0 | |
| Hex4HexNAc5dHex2NeuAc1 | 7 | ↑ 11 | ↓ 0 | ↓ 0 | |
| Hex4HexNAc4NeuAc2 | 5 | ↓ 0 | ↓ 0 | ↑ 25 | |
| Hex5HexNAc4dHex1NeuAc1NeuGc1 | 5 | ↓ 0 | ↑ 25 | ↓ 0 | |
| Hex5HexNAc4SO3 | 5 | ↓ 4 | ↓ 0 | ↑ 13 | |
| Hex4HexNAc4NeuAc2 | 5 | ↓ 0 | ↓ 0 | ↑ 25 |
Major group N-glycans: seven N-glycans were observed by more than 65% of the participants.
Intermediate group N-glycans: 11 N-glycans were observed by between 30% and 65% of the participants.
Minor group N-glycans: 43 N-glycans were observed by less than 30% of the participants.
The number of observed N-glycans correlated inversely to intensity. Qualitatively, 37% of the N-glycans reported were unsialylated, 50% were monosialylated, and 13% were disialylated; additionally, 48% of the N-Glycans were fucosylated. A total of 10% of the glycans belonging to the minor group were reported as sulfated or phosphorylated.
Major and intermediate group compositions represented more than 80% of the total. Their average relative intensities ranged between 0.2% and 20%. All of the major glycoforms had been reported previously (45–48): Hex5HexNAc4dHexNeuAc, Hex5HexNAc4dHexNeuAc2, Hex6HexNAc3NeuAc, Hex5HexNAc4NeuAc2, Hex5HexNAc4NeuAc, Hex4HexNAc3dHexNeuAc, and Hex4HexNAc4dHexNeuAc. All of the major compositions contained NeuAc, two contained two NeuAc residues, and four were fucosylated. Except for the hybrid glycans Hex6HexNAc3NeuAc and Hex4HexNAc3dHexNeuAc, all were biantennary complex compositions. In the intermediate group, 7 out of 11 glycans were sialylated and 4 out of 11 were fucosylated. Except for Hex5HexNAc2, all were biantennary N-glycans. A total of 4 out of 11 intermediate N-glycans corresponded to the compositional range Hex4HexNAc5dHex0–1NeuAc1–2. Three laboratories (14, 17, and 19(a)) proposed a degree of interpretation of the branching structure of the glycans. The structure of Hex4HexNAc5NeuAc1 was described by laboratories 14 and 17 as an asymmetrical biantennary N-glycan containing the antenna NeuAcα2–6GalNAcβ1–4GlcNAcβ1–2Man. Regarding the intermediate compounds, Hex4HexNAc5dHexNeuAc was described by laboratories 14 and 17 as containing the same antennary structure. These assignments for the N-glycans correlate with those described in the literature (49–51). Laboratories 14 and 19(a) described Hex4HexNAc3dHex0–1NeuAc containing the same antenna. Triantennary Hex6HeNAc5dHexxNeuAcy and Hex5HexNAc5dHexxNeuAcy were observed within the class of minor compositions. Laboratories 14, 17, and 19(a) concluded that the majority of the PSA and PSA high isoform N-glycans were biantennary.
Three high-mannose compositions were observed—Hex4HexNAc2, Hex5HexNAc2, and Hex6HexNAc2—with PSA containing higher relative abundances than PSA high isoform. The most abundant high-mannose composition was Hex5HexNAc2 (intermediate group), which was observed by 25% of the laboratories using top-down MS, 64% using bottom-up, and 75% using PNGase F release. The relative intensities of the PNGase F–released high-mannose N-glycans were higher than those observed in analyses of bottom-up glycopeptides, possibly because the high-mannose isoforms were released from a contaminating protein in addition to PSA. The release of N-glycans by PNGase enzymatic digestion does not distinguish the site of glycosylation, and the glycan profile is the result of the N-glycans present on all glycoproteins in the samples. The purity of the sample and the number of glycosylation sites are thus major limitations in the approach of analyzing PNGase F–released N-glycans.
Because the PSA was of human origin, NeuAc was the only sialic acid expected; however, laboratories 20, 21, and 15 reported the presence of NeuGc. The compositions identified were not consistent, and the relative intensities were lower than 2%. The identifications were based on exact masses, not tandem MS data.
The presence of sulfated and/or phosphorylated N-glycans was reported by laboratory 24, which used a high-performance anion exchange chromatography method. The N-glycans were first obtained by means of PNGase F release of PSA and PSA high isoform and then digested using nonspecific neuraminidase and α(2–3)-specific neuraminidase enzymes. The high-performance anion exchange chromatograms indicated the presence of a minor peak, consistent with a charged oligosaccharide with the potential to carry sulfate and/or phosphate substituents. The presence of sulfated and/or phosphorylated glycans also was detected for PSA and PSA high isoform by participants analyzing bottom-up (laboratories 6, 10, 9(a), and 16), PNGase F–released glycans (laboratories 9(b) and 22), and top-down (laboratories 20 and 21) data. Laboratories 20, 21, and 22 did not provide tandem MS evidence. The average intensity of this set of compounds was lower than 1%. The most abundant such composition, Hex4HexNAc5dHex(SO3), was reported by laboratories 6, 9(a), 9(b), 10, and 16 for PSA and by laboratories 7, 9(a), and 9(b) for PSA high isoform. Except for Hex4HexNAc5dHex1Neu1Ac(SO3), sulfated/phosphorylated N-glycans were observed by fewer than three participants, and, with the exception of laboratory 9, they were not observed in both PSA and PSA high isoform. We conclude that the consensus for identification of sulfated/phosphorylated glycans among the participants was not strong.
Quantitative Analysis of Glycan Isoforms on PSA and PSA High Isoform
We conducted quantitative analysis of PSA and PSA high isoform data as follows. We derived a consensus data set using preliminary AHC of the participant data. Next, a differential comparison of the N-glycan profiles observed between PSA and PSA high isoform was obtained from the consensus data. Finally, a W-test was used to determine N-glycan compositions that differed significantly in abundance between PSA and PSA high isoform.
AHC Analysis
We used AHC of the complete data set to compare results from participating laboratories for observation and quantification of N-glycans of PSA and PSA high isoform. The results (Fig. 1) illustrate the multivariate analysis and clustering in two dimensions across all groups into four clusters (A, B, C, and D). A (laboratory 8), B (laboratory 22), and D (laboratories 14, 4, and 13) represent a total of five experiments out of 22 of the participating laboratories, and cluster C contains the results from 17 laboratories. The cluster C results were the most uniform and were used to construct consensus data. In order to better understand the AHC results, we plotted the average of the intensity of each major and intermediate N-glycan composition for the four clusters, as shown in Fig. 2.
Fig. 1.
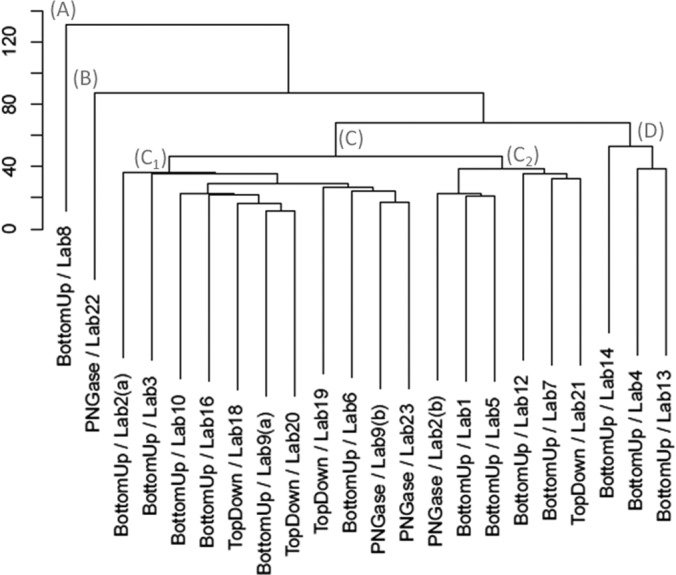
Agglomerative hierarchal clustering of N-glycans profiles for PSA and PSA high isoform from the participating labs. The dendrogram illustrates by clustering (X axis) and height (Y axis) the degree of similarity of profile of different N-glycans of PSA and PSA high Isoform detected by different labs. The main clusters reported are: (A), (B), (C), (D), and sub-clustering could be distinguished (C1), (C2).
Fig. 2.

Average relative intensity of each compound per cluster for the major, intermediate and minor N-glycans. Clusters A (Lab 8) and B (lab22) showed a complete difference with the other participating laboratories in term of repartition for PSA and PSA high isoform. Lab 8 reported Hex4HexNac3dHex1Neu1 as the major compound (> 60%) for the PSA sample, while clusters C and D reported the same compounds with an intensity lower than 15%. Lab 8 did not report any of the major N-glycans that the other labs observed for PSA High Isoform and PSA except the Neu1dHex1Hex4HexNac3. Cluster B for PSA and PSA high Isoform presented higher intensity for N-glycans Hex5HexNac3Neu2 and Hex5HexNac4dHex1Neu2 than the other clusters C and D. Only in cluster C were intermediate N-glycans detected. In cluster A, the average relative intensity of compound dHex1Hex5HexNac4 is 23.5% while it is lower than 6% for all the other clusters. (b) Minor N-glycans. The main difference is observed for the compound Hex6HexNac4NeuAc1 of the PSA high isoform that is detected by cluster A with a relative intensity of 68% compared to less than 1% for the other clusters.
Cluster A
Cluster A comprised a single set of results reported from laboratory 8. None of the major compositions were detected except for Hex4HexNAc3dHexNeuAc at 63.5% for PSA and 4% for PSA high isoform. By comparison, this composition was observed with an average intensity of 14.7% in cluster C. The compounds reported with the highest intensity were Hex4HexNAc4dHexNeuAc (23.5%) and Hex6HexNAc4NeuAc (68.5%)for PSA high isoform. The average intensities for the same compounds in consensus cluster C were 2.8% and 5.2%, respectively. Although the results disagreed with those of the consensus cluster, laboratory 8 reported that they performed comprehensive analysis including tandem MS experiments (both higher energy C-trap dissociation and electron transfer dissociation) on glycopeptides resulting from a tryptic digestion using high-resolution MS (r = 60,000, mass accuracy = 10 ppm). The tandem MS data were searched to identify glycans using ByonicTM and SimGlycanTM software. The quantification was made using peptide NKSVILLGR.
Cluster B
Cluster B comprised a single set of results reported by laboratory 22 and differed significantly from the consensus cluster. The N-glycan composition Hex6HexNAc3NeuAc was not reported for PSA and PSA high isoform, whereas the averages of the relative intensities for this composition in cluster C were 14.7% for PSA and 1.1% for PSA high isoform. The Hex4HexNAc3dHexNeuAc composition was not detected for PSA, and a low intensity (0.1%) was observed for PSA high isoform. By comparison, in cluster C, the average relative intensity of this composition was 14.3% and 2.3% for PSA and PSA high isoform, respectively. The compositions Hex5HexNAc4dHexNeuAc2 and Hex5HexNAc4NeuAc2 differed in cluster B relative to cluster C by a factor ranging from 9 to 14 for PSA and 2 to 4 for PSA high isoform. The N-glycan composition Hex5HexNAc4dHexNeuAc was lower for cluster B than cluster C by a factor of 9 for PSA and 13 for PSA high isoform. Among the intermediate compositions, only Hex4HexNAc4NeuAc and Hex4HexNAc3NeuAc were detected for PSA. The results also included some tri- and tetra-antennary compositions that were not observed by other participants. The samples were processed using PNGase F release followed by LC-MS analysis. No tandem MS data were reported.
Cluster D
Cluster D contained results from laboratories 14, 4, and 13. The N-glycan profile contained distinct characteristics relative to the results reported in consensus cluster C. In cluster D, the abundant N-glycan compositions Hex4HexNAc4dHexNeuAc and Hex6HexNAc3dHex for PSA high isoform and Hex6HexNAc3dHex for PSA were not detected. The majority of the other compositions differed in intensity significantly between clusters D and C. For example, whereas the average intensities of the compositions of the two most abundant major glycans (Hex5HexNAc4dHexNeuAc and Hex5HexNAc4dHexNeuAc2) were higher for the PSA high isoform than for PSA for cluster C, they were nearly the same in cluster D. In cluster C, the Hex5HexNAc4NeuAc2 composition was more intense in the PSA high isoform (4.3%, compared with 2.3% for PSA), whereas the inverse was observed in cluster D (10.1% and 4.9%). The compositions Hex4HexNAc4dHexNeuAc, Hex4HexNAc3dHexNeuAc, and Hex6HexNAc3NeuAc were more intense for PSA than PSA high isoform in cluster C. Clusters C and D also differed in the observation of intermediate and minor compositions. About half the intermediate compositions seen in PSA in cluster C, including Hex4HexNAc4dHex, Hex4HexNAc5NeuAc2, Hex3HexNAc5dHexNeuAc, and Hex4HexNAc4NeuAc, were not detected in cluster D. Many minor compounds were not observed for PSA or PSA high isoform in cluster D (7 out of 43 and 9 out of 43 compositions detected, respectively, compared with 39 out of 43 and 37 out of 43 compositions detected in cluster C).
Cluster C
Results from 17 of the 22 participating laboratories were grouped to make up consensus cluster C. Two sub-clusters were observed: C1 (laboratories 2(a), 3, 6, 9(a), 9(b), 10, 16, 18(b), 19(b), 20, and 23) and C2 (laboratories 1, 2(b), 5, 7, 12, and 21). The differences between clusters C1 and C2 were small. The results are presented in supplemental Fig. S5. The average intensities of major and minor compounds in PSA and PSA high isoform are comparable for almost all the major and intermediate compounds in clusters C1 and C2, except for Hex4HexNAc3dHex and Hex5HexNAc4NeuAc2. We observed that if a compound was more intense for PSA than for PSA high isoform in cluster C1, the tendency was the same for cluster C2. We observed that the differences in relative intensities between C1 and C2 did not exceed 10.8% for Hex5HexNAc4dHexNeuAc2 in PSA high isoform.
Comparative Analysis of Applied Methodologies
Following the analysis of the primary clusters A through D, we performed a more detailed evaluation of each method step, including sample preparation, separation methods, choice of proteolytic enzyme, and choice of MS method.
Separation Methods Used for the Analysis of Intact Protein, Glycans, and Glycopeptides
Peptides resulting from the enzymatic digestion were separated via different types of chromatography: C18 reversed-phase chromatography was used by laboratories 1, 2(a), 3, 4, 5, 6, 7, 8, 11, 13, 14, and 15; C8 reversed-phase column chromatography was used by laboratory 16; porous graphitized carbon column chromatography was used by laboratory 9(a); and CE was used by laboratory 10. The glycans resulting from PNGase F digestion were separated via porous graphitized carbon chromtaography (laboratories 2(b), 9(b), and 22). The glycoprotein was separated using a polymeric reversed-phase column by laboratory 19(b), via RP-4H by laboratory 20, via C8 reversed-phase chromatography by laboratory 21, and by means of CE by laboratory 22.
The diversity of chromatography methods used, combined with the limited number of participating laboratories, prevented the establishment of a clear trend concerning the approaches; however, the results presented in clusters A and D were submitted by laboratories using C18 reversed-phase chromatography.
Enzymatic Digestion Used to Prepare Glycopeptides
The choice of enzyme and digestion conditions (pH, enzyme/glycoprotein ratio) may affect the results of enzymatic digestion in terms of the nature and number of glycopeptides produced. In addition, there are two important considerations regarding PSA that can affect the results obtained by different laboratories. The glycosylation site is in close proximity to two tryptic cleavage sites, and PSA itself is a protease that can, if not handled properly, induce self-digestion. The susceptibility of the PSA peptide backbone to proteolytic cleavage might depend on the structure of the glycan present. Because such glycans represent a heterogeneous population, the effects on the proteolytic cleavage pattern might impact glycopeptide quantification. Stavenhagen et al. (52) proved clearly, through the study of synthesized glycopeptides, the effect of the nature of glycopeptides on the free label quantification.
Choice of Enzyme
As with sample separation, we did not observe a discernible trend based on the type of proteolytic enzyme used. Again, this was due to the diversity of enzymatic digestion methods and the limited number of participants. We note that laboratory 8 (cluster A) reported using trypsin digestion and laboratories in cluster D reported using Arg-C, trypsin, or both chymotrypsin and trypsin. The consensus cluster C contained results obtained using trypsin (eight laboratories), Lys-C (one laboratory), and chymotrypsin (one laboratory).
Data Analysis
A trend was observed in the clustering data concerning the number of peptides in the bottom-up experiment that were used to quantify the different N-glycan compositions.
Among the participating laboratories in cluster D, laboratory 14 used two different peptides (NK and NKSVILLGR), laboratory 4 used four peptides (NKSVILLGR, GRAVCGGVLVHPQWVLTAAHCIRNK, AVCGGVLVHPQWVLTAAHCIRNK, and AVCGGVLVHPQWVLTAAHCIRNKSVILLGR), and laboratory 13 used three peptides (NKSVIL, RNKSVILL, and NKSVILLGR). Cluster C contained results from 10 participating laboratories using a bottom-up approach; 7 of these used a single peptide for quantification. Laboratories 1, 5, and 7 used NKSVILLGR; laboratory 16 used HSQPWQVLVASRGRAVCGGVLVHPQWVLTAAHCIRNK; and laboratories 3, 9(a), and 10 used NK. We note that laboratory 9(a) performed quantification of PSA high isoform mainly on the peptide NK (80%), but also on the peptide NKSVILLGR (20%).
Results from laboratories 3, 9(a), 10, and 16 were grouped in cluster C1, and results from laboratories 1, 5, and 7 constituted cluster C2. The correlation between clustering and the number of peptides used for quantification might result from differences in chromatographic separation efficiency or from the fact that the efficiency of ionization differs among peptides, or both. If the quantification of the N-glycans were performed using the same peptide(s) among different laboratories, error due to these effects would be minimized.
Choice of MS Method: Top-down versus Bottom-up versus PNGase F Release
All of the participating laboratories using top-down analysis obtained comparable results that were grouped in cluster C. A total of 75% of the laboratories using PNGase F release and 71% of those using bottom-up analysis were also included in cluster C.
To determine whether results were dependent upon the method(s) used, the average percentage for all laboratories observing a particular glycan composition was compared with the average percentage reported for the same compositions for a given method analysis (top-down, bottom-up, or PNGase F). For example, the compound Hex5HexNAc4NeuAc1 was detected by 82% of the total participating laboratories (18 out of 22 participating laboratories), 71% of the participants using a bottom-up approach (12 out of 17 laboratories), and 100% of the participants using top-down and PNGase approaches (4 out of 4 laboratories). The results are presented in Table II. We observed a clear trend in the major and intermediate groups of N-glycan compositions. The average abundances for N-glycan compositions for top-down and PNGase F–released glycans were higher than the global average. Thus, the top-down and PNGase F approaches were more efficient in detecting the major and intermediate compositions than the bottom-up approach. A clear trend could not be established for the minor compositions.
The robustness of different methods, which we defined by the consistency in results, was compared by calculating the differences in average standard deviations. Permutation tests were used to artificially extend the data set and to calculate the differences in standard deviation between different approaches. The robustness of the methods was ranked using the p values obtained between pairs of approaches. The results are shown in Fig. 3. The red lines show the difference between the average standard deviations for the two methods in each plot. The p values correspond to double the area of the bars to the left of the red line in each plot. When all 22 participants were included, the following p values resulted: comparison between top-down and PNGase F release, p = 0.21; top-down and bottom-up, p = 0.15; PNGase F release and bottom-up, p = 1.00. Although the permutation test fails to provide statistical significance for this ranking of methods, the consistency of results according to this statistical measure may be ranked as follows: top-down ≥ PNGase F release > bottom-up. We note that top-down analysis is usually performed in dedicated mass spectrometry facilities with experience in this area and that the methodology involves minimal sample manipulation, both of which may contribute to a lower occurrence of errors due to sample handling and preparation. We also note that laboratories that routinely perform PNGase F protocols tend to have considerable experience in the field of glycomics and might be more skilled in sample preparation and analyses for glycan characterization.
Fig. 3.

Comparison of robustness for bottom-up, top-down and PNGAse F release methods used by the participating laboratories. (A) Data from 22 participating laboratories were included in the permutation tests. (B) Data from consensus cluster C were used in the permutation tests. The red lines show the difference between the average standard deviations for the two methods in each plot. The p-values correspond to double the area of bars to the left of the red line in each plot.
Using AHC, laboratories 8, 22, 13, 4, and 14 were excluded from the consensus data cluster C. These excluded participants used a bottom-up approach, except for laboratory 22, which analyzed PNGase F–released glycans. The same statistical treatment as described above was applied to the consensus data. We obtained improved adjusted p values: top-down and PNGase F release, p = 0.54; top-down versus bottom-up, p = 0.31; PNGase F and bottom-up, p = 0.75. Again, although we were unable to establish statistical significance for this ranking, mainly because of the limited numbers of data sets, our data in this subset show reliability rankings for these data sets as follows: top-down ≥ PNGase F release > bottom-up.
The following comments apply to the observed ranking of methods:
The PSA glycoproteins possess a single N-glycosylation site and a relatively low molecular weight. It is likely that the ranking of methods would differ if a larger glycoprotein with more than one glycosylation site were studied. In such a case, the use of top-down analysis would be more challenging. The analysis of released N-glycans would require prior purification of glycopeptides.
The consensus data set (cluster C) consisted of 17 laboratories using a bottom-up approach, 4 using top-down, and 4 using PNGase F release. It will be of interest to confirm the conclusions of the present study using larger numbers of participating laboratories using top-down and PNGase F release methods.
N-glycan Profiles of PSA and PSA High Isoform
The ability to quantify glycoforms has the potential to increase the diagnostic sensitivity and specificity of the PSA cancer biomarker. The literature reports that the oligosaccharide profiles of PSA differ in healthy versus prostate tumor metastatic LNCaP cells (47, 53, 54). The oligosaccharides of PSA from healthy patients include sialylated biantennary fucosylated complex glycoforms, some with antenna GalNAc. The presence of high-mannose and hybrid N-glycans has also been reported. The GalNAc was observed in increased abundance in LNCaP glycans. Peracaula et al. reported that the LNCaP oligosaccharides were almost all neutral and had a high fucose content (53). Those from seminal fluid PSA were almost completely sialylated and possessed a lower degree of fucosylation. However, Ohyama et al. (45) reported the presence of sialic acid in the PSA secreted by LNCaP cells. These contradictory results might be due to differences in the cell growth conditions or the deviation of cells from the parent cell line. Recently, PSA N-glycans from tissues of healthy individuals were reported to be less sialylated than those of cancer patients (41). However, other authors have concluded that N-glycans of PSA from the seminal fluid of healthy patients are more sialylated than those from cancer patients (24). The α2–3 sialic acid linkage has also been reported as a marker that can be used to distinguish malignant from benign cancer (45, 46), but results are not consistent among studies. A more recent study on PSA from prostate tissue from healthy and cancerous donors highlighted the finding that the sialylated glycoforms were elevated in cancer tissues (41). Despite the clear evidence that glycan profiles differentiate healthy states from cancer states, the analytical data show contradictory results regarding the most abundant glycans that are likely; this is the result of variability among PSA sources, the purity of the protein, and the analytical methods used to profile the glycans. Developing analytical methods that allow the reproducible characterization of relative abundances of N-glycans from different sources of PSA is thus a crucial step in improving the value of PSA as a biomarker.
Consensus N-glycan Profiles of PSA and PSA High Isoform
The consensus cluster C N-glycan profiles were established for PSA and PSA high isoform using data from participating laboratories (2(a), 2(b), 3, 5, 6, 7, 9(a), 9(b), 10, 11, 12, 16, 18(b), 19(b), 20, 21, and 23). Among these, 4 participants used top-down, 3 used PNGase F, and 10 used bottom-up methods.
The heat map in Fig. 4 shows the differences in the relative intensities of N-glycan compositions between PSA and PSA high isoform. Hierarchical clustering data were processed for differences in relative intensities for N-glycan compositions in order to define which carbohydrates differ between PSA and PSA high isoform. Fig. 4 shows clearly that the intensities of more than 75% of the N-glycan compositions were not significantly different between PSA and PSA high isoform (cluster 7). Clusters 1, 2, 3, 4, 5, 6, and 8 contained N-glycan compositions for which relatively significant differences in relative intensities between PSA and PSA high isoform were observed. Clusters 1, 3, 4, and 6 contained N-glycan compositions with higher relative intensities in PSA high isoform than in PSA; clusters 2, 5, and 8 contained relative intensities lower for PSA high isoform than for PSA. A Wilcoxon rank-sum statistical test on the consensus data determined that 8 of the 18 major and intermediate compositions differed significantly in relative abundance (p value < 0.0008). Four N-glycan compositions (Hex4HexNAc4dHexNeuAc, Hex4HexNAc3dHexNeuAc, Hex6HexNAc3NeuAc, and Hex4HexNAc3NeuAc) had a higher relative abundance in PSA than in PSA high isoform. The difference between PSA and PSA high isoform in terms of the average relative intensities for those compounds ranged between 2.6% and 13.8%. Four compositions (Hex5HexNAc4dHexNeuAc2, Hex5HexNAc4dHexNeuAc, Hex4HexNAc5dHexNeuAc2, and Hex5HexNAc4dHex) were reported to be more intense in PSA high isoform than in PSA, with differences in average relative intensity ranging from 2.4% to 22.2% (Fig. 5).
Fig. 4.

Heat map of the consensus data. Agglomerative hierarchical clustering results were processed based on the differences of relative intensity values for glycan compositions between PSA and PSA high isoform. Orange color indicates a null difference of relative intensity between PSA and PSA high isoform, yellow indicates a positive difference, red indicates a negative difference. The N-glycan compositions of cluster 7 (80% of the total compounds) are similar between PSA and PSA high isoform. Compositions are more intense in PSA high isoform than PSA for the cluster 1 (Hex5HexNAc4dHexNeuAc2, Hex5HexNAc4dHexNeuAc), cluster 3 (Hex4HexNAc5dHexNeuAc2), cluster 4 (NeuAc1Hex5HexNAc4NeuAc), cluster 6 (Hex5HexNAc4dHex, NeuAc2Hex5HexNAc4NeuAc2). Compositions are less intense in PSA high isoform than PSA for cluster 2 (Hex4HexNAc4dHexNeuAc, Hex4HexNAc3dHexNeuAc, Hex6HexNAc3NeuAc), cluster 5 (Hex4HexNAc4NeuAc, Hex5HexNAc2), cluster 8 (Hex3Hex5dHexNeuAc, Hex4Hex3NeuAc). In order to confirm the significance of the differences in N-glycan composition abundances between PSA and PSA high isoform, a W-test was used and revealed 8 significant compositions (indicated in bold).
Fig. 5.

Differential profile of N-glycan profilederived from the consensus data (Cluster C). A W-test was employed in order to determine 8 N-glycans (p value <0.0008) significantly different between PSA and PSA high isoform. The significant N-glycans are marked by **.
The consensus of the average relative intensities of the major and intermediate N-glycan compositions allowed us to distinguish the differences with regard to the sialylation and fucosylation of PSA and PSA high isoform (Table III). The PSA was less disialylated and fucosylated than PSA high isoform. The two samples had the same percentage of asialo compositions (∼5%). Finally, the most abundant PSA and PSA high isoform compositions corresponded to biantennary N-glycans.
Table III. Reported percentage repartition of un, mono, and disyalylated and fucosylated and unfucosylated N-glycans for the major and intermediate compounds. The significant N-glycans were revealed by the W- test as composition significantly different between PSA and PSA high isoform. PSA high isoform was more disialylaled than the PSA, when PSA is more monosialylated. The percentage of unsialylated compounds is relative comparable for PSA and PSA high isoform. PSA high isoform is more fucosylated than the PSA.
| N-glycans | Σ(average intensity N-glycans) |
Σ(average intensity significant N-glycans) |
||
|---|---|---|---|---|
| PSA | PSA high isoform | PSA | PSA high isoform | |
| Unsalylated | 4.4 | 4.5 | 0.3 | 2.8 |
| Mono Salylated | 71.2 | 43.5 | 57.4 | 32.5 |
| Disalylsated | 8.3 | 37.9 | 5.7 | 33.0 |
| Fucosylated | 53.4 | 72.9 | 45.9 | 67.1 |
| Unfucosylated | 30.5 | 13.0 | 17.7 | 1.3 |
CONCLUSION
The three analytical strategies employed by participant laboratories for the comparative analysis of PSA samples were top-down analysis of the glycoprotein, bottom-up analysis of glycopeptides, and analysis of PNGase F–released N-glycans. Consensus cluster C, representing 17 of the 22 participating laboratories, produced consistent results for the comparison of N-glycan compositional profiles between PSA and PSA high isoform. Of the 61 N-glycan compositions in the consensus data, 8 differed significantly in abundance between the two PSA samples. The data demonstrated that disialylated and fucosylated compositions were higher in abundance in the PSA high isoform than in the PSA sample.
These results highlight the value of top-down MS for the characterization of glycoproteins containing one glycosylation site. The advantage of top-down MS is that there is no need for proteolytic digestion and subsequent workup. The major disadvantage of top-down MS is that the glycoprotein is observed as a distribution of precursor ion m/z values corresponding to the heterogeneous glycoforms present. This heterogeneity divides the ion signal. Nonetheless, data from all participants using top-down MS (4 out of 22 laboratories) were represented in consensus cluster C. We conclude that top-down methods have potential for the analysis of glycoproteins containing one glycosylation site; however, future studies will be required in order to determine whether the top-down approach performs effectively in analyses with multiple sites of glycosylation.
Of the laboratories using bottom-up glycoproteomics, 71% were represented in the consensus data set (cluster C). The strongest factor that correlated with the consistency of bottom-up results was the number of peptide backbone sequences used to quantify the glycan compositions. A total of 70% of the participants in cluster C using bottom-up analysis used a single sequence for quantification. For the bottom-up data from participants not represented in the consensus cluster, all used more than one peptide sequence for glycan composition quantification. We conclude that a combination of factors makes combining glycosylation quantitative data from more than one peptide sequence challenging. Among these are false positive identifications and glycopeptide ionization efficiencies. It is clear that great care must be taken with regard to the selection of proteases, digestion conditions, and peptides used for comparative glycosylation studies using glycopeptides.
A total of 75% of the laboratories analyzing PNGase F–released glycans were included in the consensus data set. The ability to accurately characterize the abundances of N-glycan compositions was judged to be similar to that for top-down and better than that for bottom-up analysis. It must be noted, however, that the analysis of released N-glycans for an intact glycoprotein involves the assumption that the observed compositions derive from the target glycoprotein. Prior to the present study, we evaluated several glycoproteins from commercial sources; many of these contained high levels of proteins other than the target. For the PSA and PSA high isoform samples used in this study, other proteins were present at ∼10%. Other sources of PSA were considerably less pure. It therefore seems unwise to assume glycoprotein purity when designing an analytical strategy. We conclude that PNGase F release is best used on a glycoprotein of verified purity.
The application of top-down and glycan release methods becomes more challenging as the size of the glycoprotein, the number of glycosylation sites, and the heterogeneity increase. For large, complex glycoproteins, top-down analysis is presently limited to molecular weight profiling with glycosidase digestion to determine the extent of total glycosylation. Top-down tandem MS will be considerably more challenging for such glycoproteins, as they typically will be more heterogeneous than PSA. The analysis of released glycans is appropriate for peptide chains that carry only one glycosylation site. Such peptides may be purified in favorable cases. Thus, the use of proteolytic enzymes is likely to be necessary for glycoprotein analysis, despite the fact that bottom-up methods suffered from reproducibility problems in the present study.
Supplementary Material
Acknowledgments
We thank Lee Biosolutions for the gift of PSA samples and Bruker Daltonics and Thermo Scientific for offsetting the costs of sample packaging and shipment for the ABRF Glycoprotein Research Group 2012 Quantitative Glycoprotein Study. We also thank the Association of Biomolecular Resource Facilities for their support.
Footnotes
* The ABRF Glycoprotein Research Group 2012 Quantitative Glycoprotein Study was supported by NIH grants R01 098050, P41 P41GM104603, N01 HV 00239, S10 RR 015942, S10 RR 020946, and S10 RR 025082.
 This article contains supplemental material.
1 The abbreviations used are:
- AHC
- agglomerative hierarchical clustering
- CE
- capillary electrophoresis
- dHex
- deoxyhexose
- Hex
- hexose
- HexNAc
- N-acetylhexosamine
- KLK2
- kallikrein 2
- MALDI
- matrix-assisted laser desorption
- MS
- mass spectrometry
- PNGase F
- peptide-N-glycosidase F
- PSA
- prostate specific antigen
- TOF
- time-of-flight.
REFERENCES
- 1. Varki A. (2011) Evolutionary forces shaping the Golgi glycosylation machinery: why cell surface glycans are universal to living cells. Cold Spring Harb. Perspect. Biol. 3, a005462. [DOI] [PMC free article] [PubMed] [Google Scholar]
- 2. Cummings R. D. (2009) The repertoire of glycan determinants in the human glycome. Mol. Biosyst. 5, 1087–1104 [DOI] [PubMed] [Google Scholar]
- 3. Varki A., Cummings R. D., Esko J. D., Freeze H. F., Stanley P., Bertozzi C. R., Hart G. W., Etzler M. E. (2009) Essentials of Glycobiology, 2nd ed., Cold Spring Harbor Laboratory Press, Cold Spring Harbor, NY; [PubMed] [Google Scholar]
- 4. Fuster M. M., Esko J. D. (2005) The sweet and sour of cancer: glycans as novel therapeutic targets. Nat. Rev. Cancer 5, 526–542 [DOI] [PubMed] [Google Scholar]
- 5. Kannagi R., Yin J., Miyazaki K., Izawa M. (2008) Current relevance of incomplete synthesis and neo-synthesis for cancer-associated alteration of carbohydrate determinants. Biochim. Biophys. Acta 1780 [DOI] [PubMed] [Google Scholar]
- 6. Taniguchi N., Korekane H. (2011) Branched N-glycans and their implications for cell adhesion, signaling and clinical applications for cancer biomarkers and in therapeutics. BMB Rep. 44, 772–781 [DOI] [PubMed] [Google Scholar]
- 7. Varki A. (1993) Biological roles of oligosaccharides: all of the theories are correct. Glycobiology 3, 97–130 [DOI] [PMC free article] [PubMed] [Google Scholar]
- 8. Fukuda M. (1996) Possible roles of tumor-associated carbohydrate antigens. Cancer Res. 56, 2237–2244 [PubMed] [Google Scholar]
- 9. Zhu J., Wang F., Cheng K., Dong J., Sun D., Chen R., Wang L., Ye M., Zou H. (2013) A simple integrated system for rapid analysis of sialic acid-containing N-glycopeptides from human serum. Proteomics 18 [DOI] [PubMed] [Google Scholar]
- 10. Wang P. H. (2005) Altered glycosylation in cancer: sialic acids and sialyltransferases. Journal of Cancer Molecules 1, 73–85 [Google Scholar]
- 11. Granovsky M., Fata J., Pawling J., Muller W. J., Khokha R., Dennis J. W. (2000) Suppression of tumor growth and metastasis in Mgat5-deficient mice. Nat. Med. 6 [DOI] [PubMed] [Google Scholar]
- 12. Bresalier R. S., Ho S. B., Schoeppner H. L., Kim Y. S., Sleisenger M. H., Brodt P., Byrd J. C. (1996) Enhanced sialylation of mucin-associated carbohydrate structures in human colon cancer metastasis. Gastroenterology 110, 1354–1367 [DOI] [PubMed] [Google Scholar]
- 13. Malykh Y. N., Schauer R., Shaw L. (2001) N-glycolylneuraminic acid in human tumours. Biochimie (Paris) 83, 623–634 [DOI] [PubMed] [Google Scholar]
- 14. Varki A. (2001) N-glycolylneuraminic acid deficiency in humans. Biochimie (Paris) 83, 615–622 [DOI] [PubMed] [Google Scholar]
- 15. Bielik A. M., Zaia J. (2010) Historical overview of glycoanalysis. Methods Mol. Biol. 600, 9–30 [DOI] [PubMed] [Google Scholar]
- 16. Leymarie N., McComb M. E., Naimy H., Staples G. O., Zaia J. (2012) Differential characterization and classification of tissue specific glycosaminoglycans by tandem mass spectrometry and statistical methods. Int. J. Mass Spectrom. 312, 144–154 [DOI] [PMC free article] [PubMed] [Google Scholar]
- 17. Pan S., Chen R., Aebersold R., Brentnall T. A. (2011) Mass spectrometry based glycoproteomics—from a proteomics perspective. Mol. Cell. Prot. 10, 1–14 [DOI] [PMC free article] [PubMed] [Google Scholar]
- 18. Novotny M. V., Alley W. R., Jr., Mann B. F. (2013) Analytical glycobiology at high sensitivity: current approaches and directions. Glycoconj. J. 30, 89–117 [DOI] [PMC free article] [PubMed] [Google Scholar]
- 19. Wada Y., Azadi P., Costello C. E., Dell A., Dwek R. A., Geyer H., Geyer R., Kakehi K., Karlsson N. G., Kato K., Kawasaki N., Khoo K. H., Kim S., Kondo A., Lattova E., Mechref Y., Miyoshi E., Nakamura K., Narimatsu H., Novotny M. V., Packer N. H., Perreault H., Peter-Katalinic J., Pohlentz G., Reinhold V. N., Rudd P. M., Suzuki A., Taniguchi N. (2007) Comparison of the methods for profiling glycoprotein glycans—HUPO Human Disease Glycomics/Proteome Initiative multi-institutional study. Glycobiology 17, 411–422 [DOI] [PubMed] [Google Scholar]
- 20. Wada Y., Dell A., Haslam S. M., Tissot B., Canis K., Azadi P., Bäckström M., Costello C. E., Hansson G. C., Hiki Y., Ishihara M., Ito H., Kakehi K., Karlsson N., Hayes C. E., Kato K., Kawasaki N., Khoo K. H., Kobayashi K., Kolarich D., Kondo A., Lebrilla C., Nakano M., Narimatsu H., Novak J., Novotny M. V., Ohno E., Packer N. H., Palaima E., Renfrow M. B., Tajiri M., Thomsson K. A., Yagi H., Yu S. Y., Taniguchi N. (2010) Comparison of methods for profiling O-glycosylation: Human Proteome Organisation Human Disease Glycomics/Proteome Initiative multi-institutional study of IgA1. Mol. Cell. Proteomics 9, 719–727 [DOI] [PMC free article] [PubMed] [Google Scholar]
- 21. Li G. M., Chiu C., Wrammert J., McCausland M., Andrews S. F., Zheng N. Y., Lee J. H., Huang M., Qu X., Edupuganti S., Mulligan M., Das S. R., Yewdell J. W., Mehta A. K., Wilson P. C., Ahmed R. (2012) Pandemic H1N1 influenza vaccine induces a recall response in humans that favors broadly cross-reactive memory B cells. Proc. Natl. Acad. Sci. U.S.A. 109, 9047–9052 [DOI] [PMC free article] [PubMed] [Google Scholar]
- 22. Pasing Y., Sickmann A., Lewandrowski U. (2012) N-glycoproteomics: mass spectrometry-based glycosylation site annotation. Biol. Chem. 393, 249–258 [DOI] [PubMed] [Google Scholar]
- 23. Kolarich D., Lepenies B., Seeberger P. H. (2012) Glycomics, glycoproteomics and the immune system. Curr. Opin. Chem. Biol. 16, 214–220 [DOI] [PubMed] [Google Scholar]
- 24. Sarrats A., Saldova R., Comet J., O'Donoghue N., de Llorens R., Rudd P. M., Peracaula R. (2010) Glycan characterization of PSA 2-DE subforms from serum and seminal plasma. OMICS 14, 465–474 [DOI] [PubMed] [Google Scholar]
- 25. Sokoll L. J., Sanda M. G., Feng Z., Kagan J., Mizrahi I. A., Broyles D. L., Partin A. W., Srivastava S., Thompson I. M., Wei J. T., Zhang Z., Chan D. W. (2010) A prospective, multicenter, National Cancer Institute Early Detection Research Network study of [-2]proPSA: improving prostate cancer detection and correlating with cancer aggressiveness. Cancer Epidemiol. Biomarkers Prev. 19, 1193–2000 [DOI] [PMC free article] [PubMed] [Google Scholar]
- 26. Végvári A., Rezeli M., Welinder C., Malm J., Lilja H., Marko-Varga G., Laurell T. (2010) Identification of prostate-specific antigen (PSA) isoforms in complex biological samples utilizing complementary platforms. J. Proteomics 73, 1137–1147 [DOI] [PMC free article] [PubMed] [Google Scholar]
- 27. Sarrats A., Comet J., Tabares G., Ramirez M., Aleixandre R. N., de Lorens R. (2010) Differential percentage of serum PSA subforms suggests a new way to improve prostate cancer diagnosis. Prostate 70, 1–9 [DOI] [PubMed] [Google Scholar]
- 28. Vermassen T., Speeckaert M., Lumen N., Rottey S., Delanghe J. (2012) Glycosylation of prostate specific antigen and its potential diagnostic applications. Clin. Chim. Acta 413, 1500–1505 [DOI] [PubMed] [Google Scholar]
- 29. Rambaruth N. D., Dwek M. V. (2011) Cell surface glycan-lectin interactions in tumor metastasis. Acta Histochem. 113, 591–600 [DOI] [PubMed] [Google Scholar]
- 30. Lebrilla C. B., An H. J. (2009) The prospects of glycan biomarkers for the diagnosis of diseases. Mol. Biosyst. 5, 17–20 [DOI] [PubMed] [Google Scholar]
- 31. Nilsson J., Rüetschi U., Halim A., Hesse C., Carlsohn E., Brinkmalm G., Larson G. (2009) Enrichment of glycopeptides for glycan structure and attachment site identification. Nat. Methods 6, 809–811 [DOI] [PubMed] [Google Scholar]
- 32. Jensen P. H., Karlsson N. G., Kolarich D., Packer N. H. (2012) Structural analysis of N- and O-glycans released from glycoproteins. Nat. Protoc. 7, 1299–1310 [DOI] [PubMed] [Google Scholar]
- 33. Gattiker A., Bienvenut W. V., Bairoch A., Gasteiger E. (2002) FindPept, a tool to identify unmatched masses in peptide mass fingerprinting protein identification. Proteomics Clin. Appl. 2, 1435–1444 [DOI] [PubMed] [Google Scholar]
- 34. Woodin C. L., Hua D., Maxon M., Rebecchi K. R., Go E. P., Desaire H. (2012) GlycoPep grader: a web-based utility for assigning the composition of N-linked glycopeptides. Anal. Chem. 84, 4821–4829 [DOI] [PMC free article] [PubMed] [Google Scholar]
- 35. Apte A., Meitei N. S. (2010) Bioinformatics in glycomics: glycan characterization with mass spectrometric data using SimGlycan. Methods Mol. Biol. 600, 269–281 [DOI] [PubMed] [Google Scholar]
- 36. Mayampurath A. M., Wu Y., Segu Z. M., Mechref Y., Tang H. (2011) Improving confidence in detection and characterization of protein N-glycosylation sites and microheterogeneity. Rapid Commun. Mass Spectrom. 25, 2007–2019 [DOI] [PubMed] [Google Scholar]
- 37. Leduc R. D., Kelleher N. L. (2007) Using ProSight PTM and related tools for targeted protein identification and characterization with high mass accuracy tandem MS data. Curr. Protoc. Bioinformatics Chapter 13, Unit 13 16 [DOI] [PubMed] [Google Scholar]
- 38. Zamdborg L., LeDuc R. D., Glowacz K. J., Kim Y. B., Viswanathan V., Spaulding I. T., Early B. P., Bluhm E. J., Babai S., Kelleher N. L. (2007) ProSight PTM 2.0: improved protein identification and characterization for top down mass spectrometry. Nucleic Acids Res. 35, W701–W706 [DOI] [PMC free article] [PubMed] [Google Scholar]
- 39. Taichrib A., Pioch M., Neususs C. (2012) Multivariate statistics for the differentiation of erythropoietin preparations based on intact glycoforms determined by CE-MS. Anal. Bioanal. Chem. 403, 797–805 [DOI] [PubMed] [Google Scholar]
- 40. Chu K. C. (1974) Applications of artificial intelligence to chemistry. Use of pattern recognition and cluster analysis to determine the pharmacological activity of some organic compounds. Anal. Chem. 46, 1181–1187 [DOI] [PubMed] [Google Scholar]
- 41. Li Y., Tian Y., Rezai T., Prakash A., Lopez M. F., Chan D. W., Zhang H. (2011) Simultaneous analysis of glycosylated and sialylated prostate-specific antigen revealing differential distribution of glycosylated prostate-specific antigen isoforms in prostate cancer tissues. Anal. Chem. 83, 241–245 [DOI] [PMC free article] [PubMed] [Google Scholar]
- 42. Cairns D. A. (2011) Statistical issues in quality control of proteomic analyses: good experimental design and planning. Proteomics Clin. Appl. 11 [DOI] [PubMed] [Google Scholar]
- 43. Dakna M., Harris K., Kalousis A., Carpentier S., Kolch W., Schanstra J. P., Haubitz M., Vlahou A., Mischak H., Girolami M. (2010) Addressing the challenge of defining valid proteomic biomarkers and classifiers. BMC Bioinformatics 11 [DOI] [PMC free article] [PubMed] [Google Scholar]
- 44. Williams S. A., Xu Y., De Marzo A. M., Isaacs J. T., Denmeade S. R. (2010) Prostate-specific antigen (PSA) is activated by KLK2 in prostate cancer ex vivo models and in prostate-targeted PSA/KLK2 double transgenic mice. Prostate 70, 788–796 [DOI] [PMC free article] [PubMed] [Google Scholar]
- 45. Ohyama C., Hosono M., Nitta K., Oh-eda M., Yoshikawa K., Habuchi T., Arai Y., Fukuda M. (2004) Carbohydrate structure and differential binding of prostate specific antigen to Maackia amurensis lectin between prostate cancer and benign prostate hypertrophy. Glycobiology 14, 671–679 [DOI] [PubMed] [Google Scholar]
- 46. Tajiri M., Ohyama C., Wada Y. (2008) Oligosaccharide profiles of the prostate specific antigen in free and complexed forms from the prostate cancer patient serum and in seminal plasma: a glycopeptide approach. Glycobiology 18 [DOI] [PubMed] [Google Scholar]
- 47. Tabares G., Radcliffe C. M., Barrabes S., Ramirez M., Aleixandre R. N., Hoesel W., Dwek R. A., Rudd P. M., Peracaula R., De Llorens R. (2006) Different glycan structures in prostate-specific antigen from prostate cancer sera in relation to seminal plasma PSA. Glycobiology 16, 132. [DOI] [PubMed] [Google Scholar]
- 48. White K. Y., Rodemich L., Nyalwidhe J. O., Comunale M. A., Clements M. A., Lance R. S., Schellhammer P. F., Mehta A. S., Semmes O. J., Drake R. R. (2009) Glycomic characterization of prostate-specific antigen and prostatic acid phosphatase in prostate cancer and benign disease seminal plasma fluids. J. Proteome Res. 8, 620–630 [DOI] [PMC free article] [PubMed] [Google Scholar]
- 49. Weisshaar G., Hiyama J., Renwick A. G., Nimtz M. (1991) NMR investigations of the N-linked oligosaccharides at individual glycosylation sites of human lutropin. Eur. J. Biochem. 195, 257–268 [DOI] [PubMed] [Google Scholar]
- 50. Coddeville B., Strecker G., Wieruszeski J. M., Vliegenthart J. F., van Halbeek H., Peter-Katalinic J., Egge H., Spik G. (1992) Heterogeneity of bovine lactotransferrin glycans. Characterization of alpha-D-Galp-(1–>3)-beta-D-Gal- and alpha-NeuAc-(2–>6)-beta-D-GalpNAc-(1–>4)-beta-D-GlcNAc-substituted N-linked glycans. Carbohydr. Res. 236, 145–164 [DOI] [PubMed] [Google Scholar]
- 51. Yan S. B., Chao Y. B., van Halbeek H. (1993) Novel Asn-linked oligosaccharides terminating in GalNAc beta (1–>4)[Fuc alpha (1–>3)]GlcNAc beta (1–>.) are present in recombinant human protein C expressed in human kidney 293 cells. Glycobiology 3, 597–608 [DOI] [PubMed] [Google Scholar]
- 52. Stavenhagen K., Hinneburg H., Thaysen-Andersen M., Hartmann L., Silva D. V., Fuchser J., Kaspar S., Rapp E., Seebergera P. H., Kolarich D. (2013) Quantitative mapping of glycoprotein micro-heterogeneity and macro-heterogeneity: an evaluation of mass spectrometry signal strengths using synthetic peptides and glycopeptides. J. Mass Spectrom. [DOI] [PubMed] [Google Scholar]
- 53. Peracaula R., Tabares G., Royle L., Harvey D. J., Dwek R. A., Rudd P. M., de Llorens R. (2003) Altered glycosylation pattern allows the distinction between prostate-specific antigen (PSA) from normal and tumor origins. Glycobiology 13, 457–470 [DOI] [PubMed] [Google Scholar]
- 54. Okada T., Sato Y., Kobayashi N., Sumida K., Satomura S., Matsuura S., Takasaki M., Endo T. (2001) Structural characteristics of the N-glycans of two isoforms of prostate-specific antigens purified from human seminal fluid. Biochim. Biophys. Acta 1525, 149–160 [DOI] [PubMed] [Google Scholar]
Associated Data
This section collects any data citations, data availability statements, or supplementary materials included in this article.