

Abstract
As one of the most important and universal posttranslational modifications (PTMs) of proteins, S-nitrosylation (SNO) plays crucial roles in a variety of biological processes, including the regulation of cellular dynamics and many signaling events. Knowledge of SNO sites in proteins is very useful for drug development and basic research as well. Unfortunately, it is both time-consuming and costly to determine the SNO sites purely based on biological experiments. Facing the explosive protein sequence data generated in the post-genomic era, we are challenged to develop automated vehicles for timely and effectively determining the SNO sites for uncharacterized proteins. To address the challenge, a new predictor called iSNO-AAPair was developed by taking into account the coupling effects for all the pairs formed by the nearest residues and the pairs by the next nearest residues along protein chains. The cross-validation results on a state-of-the-art benchmark have shown that the new predictor outperformed the existing predictors. The same was true when tested by the independent proteins whose experimental SNO sites were known. A user-friendly web-server for iSNO-AAPair was established at http://app.aporc.org/iSNO-AAPair/, by which users can easily obtain their desired results without the need to follow the mathematical equations involved during its development.
Keywords: Pseudo amino acid composition, Position-specific amino acid propensity, Post-translational modification, Nearest neighbor pair, S-nitrosylation, Next nearest neighbor pair
Introduction
Regulating the stability and the functions of proteins (Mann & Jensen, 2003; Walsh & Jefferis, 2006), the post-translational modifications (PTMs) play important roles in a variety of biological processes, including transcriptional regulation (Li et al., 2007), cell signaling (Whalen et al., 2007) and apoptosis (Lugovskoy et al., 1999; Tsang et al., 2009). The aberrances of the PTMs are closely associated with devastating diseases such as cancers (Lahiry et al., 2010), Parkinson’s (Uehara et al., 2006; Yao et al., 2004), and Alzheimer’s (Carter & Chou, 1998; Cho et al., 2009). One of the most important and universal PTMs is S-nitrosylation (SNO). Therefore, identifying the SNO sites in proteins (Fig. 1) is crucially important for both biomedical research and drug development.
Figure 1. A schematic drawing to show the S-nitrosylation (SNO) site of a protein.

Actually, many efforts have been made to identify the SNO sites with experimental approaches, such as BST (biotin switch assay) (Jaffrey et al., 2001), SNOSID (Derakhshan, Wille & Gross, 2007; Greco et al., 2006), and SNO-RAC (Forrester et al., 2009). Although considerable knowledge about the SNO sites could be obtained by these methods, it is both time-consuming and laborious by means of the experimental approaches alone. Facing the explosion of protein sequences generated in the post genomic era, we are challenged to develop computational method for fast and reliably identifying the SNO sites in proteins.
Recently, several computational methods have been proposed in this regard (Li et al., 2011; Li et al., 2012; Xue et al., 2010; Xu et al., 2013). Each of these methods has merit and did play a role in stimulating the development of this area. However, they also each have their own limits. For example, by incorporating the position specific amino acid propensity into the general form of pseudo amino acid composition (Chou, 2001a) or Chou’s PseAAC (Lin & Lapointe, 2013), the authors in a recent article (Xu et al., 2013) presented a predictor called iSNO-PseAAC, which can yield higher success rates than the other existing methods for predicting SNO sites. However, in the iSNO-PseAAC predictor, only the position propensity of each of the constituent amino acids was considered without taking into account any of their correlation. In other words, all the amino acids in the proteins were treated independently. However, in the real world, they are not independent of each other but bear some sort of correlation. And incorporating the correlation effects could really improve the prediction quality accordingly, such as in identifying the peptide cleavage sites by signal peptidase (Chou, 2001d), investigating the specificity of GalNAc-transferase (Chou, 1995), predicting the protein cleavage sites by HIV-protease (Chou, 1993), as well as using the information thus obtained to develop peptide-drugs against HIV/AIDS and SARS (Du, Sun & Chou, 2007; Du et al., 2005; Gan et al., 2006; Shen & Chou, 2008) based on Chou’s distorted key theory (Chou, 1996). Motivated and encouraged by these studies, here we are to develop a new method for identifying the protein SNO sites by incorporating some sequence correlation effects.
As shown by a series of recent publications (Chen et al., 2013; Chen et al., 2012b; Xiao et al., 2013) and summarized in a comprehensive review (Chou, 2011), to establish a really useful statistical predictor for a sequence-based system, one needs to engage the following procedures: (i) construct or select a valid benchmark dataset to train and test the predictor; (ii) formulate the sequence samples with an effective mathematical expression that can truly reflect their intrinsic correlation with the target to be predicted; (iii) introduce or develop a powerful algorithm (or engine) to operate the prediction; (iv) properly perform cross-validation tests to objectively evaluate the anticipated accuracy of the predictor; (v) establish a user-friendly web-server for the predictor that is accessible to the public. Below, let us describe how to engage these procedures one by one.
Materials and Methods
Benchmark dataset
In this study the benchmark dataset was derived from the S-nitrosylated database (version 1.0) (Chen et al., 2010) at http://dbsno.mbc.nctu.edu.tw/, from which 1,530 proteins in human and mouse species and their SNO sites were downloaded. The corresponding peptide fragments for these SNO sites were derived from UniProt database (release 2012_08). To facilitate description later, let us adopt Chou’s formulation for peptides here that was used for studying signal peptide cleavage sites (Chou, 2001c; Chou, 2001d). According to the formulation, a peptide with cysteine located at its center (Fig. 1) can be written as
| (1) |
where the subscript ξ is an integer, R−ξ represents the ξ-th downstream amino acid residue from cysteine (C), Rξ the ξ-th upstream amino acid residue, and so forth (Fig. 2). Peptides with the profile of Eq. (1) can be further classified into the following two categories: (1) SNO peptide if its center is a SNO site; (2) non-SNO peptide if its center is a non-SNO site, as can be formulated by
| (2) |
where ∈ represents “a member of” in the set theory. After some preliminary trials and also considering the practice of previous investigators (Li et al., 2011; Li et al., 2012; Xue et al., 2010; Xu et al., 2013), we choose ξ = 10 to construct the benchmark dataset for P of Eq. (1). If the upstream or downstream in a protein was less than 10, the lacking residues were filled with the dummy code Z. The peptides thus obtained are subject to a screening procedure to winnow those that have ≥40% sequence identity to any other. Finally, we obtained 2,381 SNO peptides and 11,755 non-SNO peptides. Now let us construct the training or learning dataset 𝕊L as defined by
| (3) |
where ∪ represents the “union” in the set theory, contains 2,300 samples randomly picked from the aforementioned 2,381 SNO peptides, while 2,300 samples randomly picked from the 11,755 non-SNO peptides. For readers’ convenience, the 2,300 peptide sequences in the positive learning dataset and 2,300 peptide sequences in the negative learning dataset , along with their sequence positions (sites) in the parent proteins coded in “UniProt IDs”, are given in Supplemental Information S1.
Figure 2. A schematic illustration to show a peptide generated from a protein sequence by the sliding window (Chou, 2001d) with cysteine (C) located at its center.
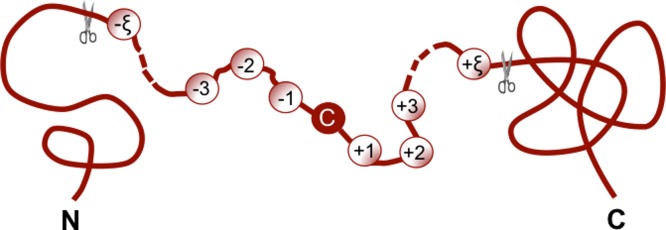
Adapted from Chou (Chou, 2001b) with permission.
Moreover, for the purpose of demonstration later, let us also construct an independent dataset 𝕊T given by
| (4) |
where contains the remaining 81 samples in the aforementioned 2,381 SNO peptides, while contains 100 samples randomly picked from the 11,755 non-SNO peptides but none of them occurs in . Likewise, the 81 peptide sequences in the positive testing dataset and 100 peptide sequences in the negative testing dataset are given in Supplemental Information S2.
Feature vector construction
In developing a statistical method for predicting the cleavage sites (Chou, 1993) in proteins or their attributes (Chou, 1995), one of the important procedures was to formulate the protein or peptide samples with an effective mathematical expression that could truly reflect the intrinsic correlation with the desired target. To realize this, various different vectors were proposed (see, Cao, Xu & Liang, 2013; Chen & Li, 2013; Du et al., 2012; Esmaeili, Mohabatkar & Mohsenzadeh, 2010; Fan & Li, 2012; Khosravian et al., 2013; Liu et al., 2012; Mohabatkar et al., 2013; Mohabatkar, Mohammad Beigi & Esmaeili, 2011; Nanni et al., 2010; Wan, Mak & Kung, 2013; Yu et al., 2010; Zhang et al., 2008a; Zhou et al., 2007) to formulate proteins or peptides by extracting their different features into the pseudo amino acid composition (Chou, 2001a) or Chou’s PseAAC (Lin & Lapointe, 2013).
According to a recent review (Chou, 2011), the general form of Chou’s PseAAC for a protein or peptide P can be formulated by
| (5) |
where T is the transpose operator, while Ω is an integer to reflect the vector’s dimension. The value of Ω as well as the components ψu (u = 1, 2, …, Ω) in Eq. (5) will depend on how to extract the desired information from the protein or peptide sequence. Below, let us describe how to extract the useful information from the learning dataset 𝕊L to define the peptide samples via Eq. (5) for the current study.
Since the length of each peptide in the training dataset 𝕊L is 21 (cf. Supplemental Information S1), Eq. (1) for P can be simplified to a more convenient form given by
| (6) |
where R11 = C and Ri (i = 1, 2, …, 21; i ≠ 11) can be any of the 20 native amino acids or the dummy code Z as defined above. Hereafter, let us use the numerical codes 1, 2, 3, …, 20 to represent the 20 native amino acids according to the alphabetic order of their single letter codes, and use 21 to represent the dummy amino acid Z. Accordingly, the number of possible different dipeptides will be 21 × 21 = 441, and the number of dipeptide subsite positions on the sequence of Eq. (6) will be (21−2 + 1) = 20.
Now, let us introduce the following 441 × 20 matrix ℤ0, the so-called PSDP (position-specific dipeptide propensity) matrix to define the component of Eq. (5)
| (7) |
where the element
| (8) |
and
| (9) |
In Eq. (8), is the occurrence frequency of the i-th dipeptide (i = 1, 2, …, 441) at the j-th subsite on the sequence of Eq. (6) (or the j-th column in the positive learning dataset that can be easily derived using the method described in (Chou, 2001d) from the sequences in Supplemental Information S1; while is the corresponding occurrence frequency but derived from the negative learning dataset .
In order to extract more information, let us expand the propensity matrix from the dipeptide (or the residue pair formed by the nearest residues) to the pair formed by the next nearest amino acid residues (Fig. 3). Since the number of possible such amino acid pairs is still 21 × 21 = 441, but the number of their subsite positions on the sequence of Eq. (6) is reduced to (21−3 + 1) = 19, the corresponding position-specific propensity matrix should be given by
| (10) |
where the element
| (11) |
where has the same meaning as in Eq. (9) but instead of dipeptide it represents the pairs of amino acids separated by one residue between them along a protein sequence. Likewise, and also have the similar meaning as and in Eq. (8), and can be easily derived from the sequences in Supplemental Information S1 as well.
Figure 3. A schematic drawing to show the pairwise coupling between nearest residues (blue solid line) and that between the next nearest residues (red dashed line).

Now, let us define a new matrix ℤ by merging ℤ0 and ℤ1; i.e.,
| (12) |
where the symbol ⊕ represents the orthogonal sum (Chou & Shen, 2007). Thus, the peptide P of Eq. (6) can be uniquely defined via the general form of PseAAC (cf. Eq. (5)) with its dimension Ω = 20 + 19 = 39 and its u-th component given by
| (13) |
where Ru is any residue in the u-th position of the peptide P (cf. Eq. (6)).
Prediction Algorithm
Suppose ℙ+ and ℙ− are the standard vectors or norms for the peptide sequences in and , respectively. And they are defined by
| (14) |
where
| (15) |
where N+ is the total number of SNO peptides in the learning dataset, and the u-th component for the k-th SNO peptide in the PseAAC space (cf. Eqs. (5) and (13)); whereas N− and have the same meanings but are for the non-SNO peptides.
For a query peptide P as formulated by Eq. (5), suppose 𝔻 (P, ℙ+) is its similarity to the norm of SNO peptides, and 𝔻 (P, ℙ−) its similarity to the norm of non-SNO peptides, as formulated by
| (16) |
Thus, the prediction rule for the query peptide P can be formulated as
| (17) |
If there was a tie between 𝔻 (P, ℙ+) and 𝔻 (P, ℙ−), the query peptide would be randomly assigned between the SNO peptide and non-SNO peptide categories. However, this kind of tie case rarely happened and actually never happened in our study.
The predictor established via the above procedures is called iSNO-AAPair, where “i” stands for the 1st character of “identify”, while “AAPair” means that the amino acid coupling effects were taken into account within the pairs formed by the nearest residues as well as the pairs formed by the next nearest residues along the peptide sequence.
A flowchart of the predictor is given in Fig. 4 to illustrate how iSNO-AAPair was working during the process of prediction.
Figure 4. A flowchart showing the prediction process of iSNO-AAPair.

Results and Discussion
How to objectively evaluate the performance of a predictor and how to make it easy to access by public (Chou & Shen, 2009) are two important factors that are directly associated with its application value. Below, let us address these problems.
Four different metrics for measuring the prediction quality
In literature the following metrics are often used for examining the performance quality of a predictor
| (18) |
where TP represents the number of the true positive; TN, the number of the true negative; FP, the number of the false positive; FN, the number of the false negative; Sn, the sensitivity; Sp, the specificity; Acc, the accuracy; MCC, the Mathew’s correlation coefficient. To most biologists, however, the four metrics as formulated in Eq. (18) are not quite intuitive and easier-to-understand, particularly for the Mathew’s correlation coefficient. Here let us adopt the formulation proposed recently (Chen et al., 2013; Xu et al., 2013) in terms of the Chou’s symbol (Chou, 2001d); i.e.,
| (19) |
where N+ is the total number of the SNO peptides investigated while the number of the SNO peptides incorrectly predicted as the non-SNO peptides; N− the total number of the non-SNO peptides investigated while the number of the non-SNO peptides incorrectly predicted as the SNO peptides (Chou, 2001b).
It can be clearly seen from Eq. (19) that when meaning none of the SNO peptides were incorrectly predicted to be a non-SNO peptide, we have sensitivity Sn = 1. When meaning that all the SNO peptides were incorrectly predicted to be the non-SNO peptides, we have sensitivity Sn = 0. Likewise, when meaning none of the non-SNO peptides was incorrectly predicted to be the SNO peptide, we have specificity Sp = 1; whereas meaning all the non-SNO peptides were incorrectly predicted as the SNO peptides, we have specificity Sp = 0. When meaning that none of SNO peptides in the positive dataset and none of the non-SNO peptides in the negative dataset was incorrectly predicted, we have overall accuracy Acc = 1 and MCC = 1; when and meaning that all the SNO peptides in the positive dataset and all the non-SNO peptides in the negative dataset were incorrectly predicted, we have overall accuracy Acc = 0 and MCC = −1; whereas when and we have Acc = 0.5 and MCC = 0 meaning no better than random prediction. As we can see from the above discussion based on Eq. (19), the meanings of sensitivity, specificity, overall accuracy, and Mathew’s correlation coefficient have become much more intuitive and easier-to-understand.
It is instructive to point out that the set of metrics as given in Eq. (18) or Eq. (19) is valid only for the single-label systems as in the current case. For the multi-label systems whose emergence has become increasingly frequent in system biology (Chou, Wu & Xiao, 2011; Chou, Wu & Xiao, 2012) and system medicine (Chen et al., 2012a; Xiao et al., 2013), a different set of metrics as defined in Chou (2013) is needed.
Cross-validation to evaluate the anticipated success rates
In statistical prediction, the following three cross-validation methods are often used to evaluate the anticipated accuracy of a predictor: independent dataset test, subsampling (K-fold cross-validation) test, and jackknife test (Chou & Zhang, 1995). However, as elucidated by a review article (Chou, 2011), among the three cross-validation methods, the jackknife test is deemed the least arbitrary and most objective because it can always yield a unique result for a given benchmark dataset, and hence has been increasingly used and widely recognized by investigators to examine the accuracy of various predictor (see, Chen & Li, 2013; Khosravian et al., 2013; Mei, 2012; Mohabatkar et al., 2013; Mohabatkar, Mohammad Beigi & Esmaeili, 2011; Wan, Mak & Kung, 2013; Zhang et al., 2008b). However, to reduce computational time, here let us adopt the 10-fold cross-validation to examine the prediction accuracy as done by many investigators for PTM sites prediction with SVM (Chang et al., 2009; Kim et al., 2004; Wong et al., 2007; Xu et al., 2013). The cross-validations were performed 50 times for different subsampling combinations, followed by averaging their outcomes. The outcomes thus obtained on the benchmark dataset 𝕊L (cf. Supplemental Information S1) for the four metrics as defined in Eq. (19) are given below
| (20) |
indicating that the accuracy is quite high for all the four metrics.
Independent dataset test
As a demonstration to show how the current predictor is used for practical application, let us use the iSNO-AAPair predictor trained by the data in 𝕊L (Eq. (3)) to predict the peptides in 𝕊T (cf. Eq. (4)). As mentioned in the Materials and Methods section, the independent dataset 𝕊T contain 81 SNO and 100 non-SNO peptides (cf. Supplemental Information S2). To avoid the memory bias, none of the peptide in 𝕊T occurs in 𝕊L; i.e., 𝕊L∩𝕊T = 0̸, where the symbols ∩ and 0̸ represent “intersection” and “empty set” in the set theory, respectively. The results thus obtained are given below
| (21) |
indicating that the results obtained by the independent dataset test are quite consistent with those by the 10-fold cross-validation, particularly for the overall accuracy Acc and the Mathew’s correlation coefficient MCC.
Comparison with the other methods
Among the existing methods for identifying the SNO sites in proteins, the web server for the method proposed in Li et al. (2011) did not work, and the method in Li et al. (2012) had no web-server at all. Therefore, the comparison was made among the following three methods: GPS-SNO (Xue et al., 2010), iSNO-PseAAC (Xu et al., 2013), and the current iSNAO-PseAAPair.
Listed in Table 1 are the corresponding results obtained by the aforementioned three methods on the independent dataset test 𝕊T (cf. Supplemental Information S2), respectively. As we can see from Table 1, the overall accuracy (Acc) achieved by iSNO-AAPair was remarkably (about 30%–35%) higher than those by its counterparts GPS-SNO (Xue et al., 2010) and iSNO-PseAAC (Xu et al., 2013). Furthermore, iSNO-AAPair was also superior to its counterparts in the other three metrics (Sn, Sp, and MCC). Particularly for MCC, the rate achieved by iSNO-AAPair was significantly (about 30%–55%) higher than those by its counterparts, indicating that the high accuracy achieved by iSNO-AAPair was not an artifact but a true result, and hence it would be much more stable, consistent, and reliable in practical applications.
Table 1. A comparison of iSNO-AAPair with the existing prediction methodsa via the independent dataset test for the four different metrics (cf. Eq. (19)).
| Predictor | Sn (%) | Sp (%) | Acc (%) | MCC |
|---|---|---|---|---|
| GPS-SNOb | 44.5 | 81.0 | 64.7 | 0.28 |
| iSNO-PseAACc | 50.2 | 75.2 | 62.8 | 0.30 |
| iSNO-AAPair | 79.6 | 84.1 | 81.7 | 0.63 |
Notes.
The results for the method proposed in Li et al. (2012) and that in Li et al. (2011) were not listed because the former had no web-server and latter’s web-server did not work.
The method proposed in Xue et al. (2010) where the threshold parameter was set at “medium” to get its highest overall accuracy.
The method proposed in Xu et al. (2013).
Also, in practical applications, the input should be entire protein sequences. To avoid memory bias, let us randomly pick 14 protein sequences whose experimental SNO sites are known but none of them occurs in the training dataset 𝕊L. The sequences of such 14 proteins as well as SNO site (red) and non-SNO site (blue) are given in Supplemental Information S3. The detailed results by the three methods in identifying the SNO sites for the 14 independent proteins are given in Supplemental Information S4. For clarity, these results are summarized in Table 2 from which we can see that iSNO-AAPair outperformed iSNO-PseAAC and GPS-SNO not only in the overall accuracy Acc, but also in MCC, indicating iSNO-AAPair not only performed better but also more stable than its counterparts.
Table 2. A comparison of iSNO-AAPair with the existing prediction methodsa on the 14 independent proteins (cf. Supplemental Information S3).
| Predictor | Sn (%) | Sp (%) | Acc (%) | MCC |
|---|---|---|---|---|
| GPS-SNOb | 37.50 | 62.79 | 55.93 | 0.10 |
| iSNO-PseAACc | 75.00 | 55.81 | 61.02 | 0.27 |
| iSNO-AAPair | 75.00 | 60.47 | 64.41 | 0.31 |
Notes.
See footnote a of Table 1.
The method proposed in Xue et al. (2010) where the threshold parameter was set at “medium” to get its highest overall accuracy.
See footnote c of Table 1.
It is anticipated that iSNO-AAPair may become a useful vehicle for identifying the SNO sites in proteins, or at the very least play an important complementary role to the existing predictors in this area.
Web server
For the convenience of the vast majority of biological scientists, a web-server for iSNO-AAPair was established. Here, let us give a step-by-step guide on how to use the web-server to get the desired results without the need to follow the mathematic equations that were presented just for the integrity in developing the predictor.
Step 1. Open the web server at http://app.aporc.org/iSNO-AAPair/ and you will see the top page of the predictor on your computer screen, as shown in Fig. 5. Click on the Read Me button to see a brief introduction about iSNO-AAPair predictor and the caveat when using it.
Figure 5. A semi-screenshot to show the top page of the iSNO-AAPair web-server.

Available at http://app.aporc.org/iSNO-AAPair/.
Step 2. Either type or copy/paste the query protein sequences into the input box shown at the center of Fig. 5. The input sequence should be in the FASTA format. Example sequences in FASTA format can be seen by clicking on the Example button right above the input box. For more information about FASTA format, visit http://en.wikipedia.org/wiki/Fasta_format.
Step 3. Click on the Submit button to see the predicted result. For example, if you use the query protein sequences in the Example window as the input, after clicking the Submit button, you will see on your screen the predicted SNO site positions and the corresponding sequences segments with the form as formulated by Eq. (1). All these results are fully consistent with the experimentally verified results. It takes about a few seconds for the above computation before the predicted results appear on the computer screen; the greater number of query proteins and the longer each sequence, the more time is usually needed.
Step 4. As shown on the lower panel of Fig. 5, you may also choose the prediction by entering your desired input file via the “Browse” button. The input file should also be in FASTA format but can contain as many protein sequences as you want.
Step 5. Click on the Citation button to find the relevant papers that document the detailed development and algorithm of iSNO-AAPair.
Step 6. Click on the Data button to download the benchmark datasets used to train and test the iSNO-AAPair predictor.
Caveats. To obtain the predicted result with the anticipated success rate, the entire sequence of the query protein rather than its fragment should be used as an input. A sequence with less than 50 amino acid residues is generally deemed as a fragment.
Supplemental Information
They each contain 2300 SNO and 2300 non-SNO sites and peptide fragments derived from the 1,530 proteins. See the text of the paper for further explanation.
The former contains 81 SNO sites and the latter 100 non-SNO sites. None of the sites and peptide fragments included here occurs in the learning dataset 𝕊L. See the text of the paper for further explanation.
The SNO site is marked with red, while non-SNO site with blue.
Acknowledgments
The authors wish to thank the editor and two anonymous reviewers for their constructive comments, which were very helpful for strengthening the presentation of this article.
Funding Statement
This work is supported by the National Natural Science Foundation of China (No. 11301024, No. 11371365, No. 11101029, No. 31201002, No. 11071013, No. NCET-11-0574) and the Fundamental Research Funds for the Central Universities. The funders had no role in study design, data collection and analysis, decision to publish, or preparation of the manuscript.
Contributor Information
Yan Xu, Email: yxu@gordonlifescience.org, xuyan@ustb.edu.cn.
Kuo-Chen Chou, Email: kcchou@gordonlifescience.org.
Additional Information and Declarations
Competing Interests
Yan Xu is an employee of the Gordon Life Science Institute. Kuo-Chen Chou is the President and Founder of the Gordon Life Science Institute.
Author Contributions
Yan Xu performed the experiments, analyzed the data, wrote the paper.
Xiao-Jian Shao and Ling-Yun Wu performed the experiments.
Nai-Yang Deng conceived and designed the experiments, contributed reagents/materials/analysis tools.
Kuo-Chen Chou analyzed the data, suggested submitting the paper to PeerJ, and improved the presentation and English.
References
- Cao, Xu & Liang (2013).Cao D-S, Xu Q-S, Liang Y-Z. propy: a tool to generate various modes of Chou’s PseAAC. Bioinformatics. 2013;29:960–962. doi: 10.1093/bioinformatics/btt072. [DOI] [PubMed] [Google Scholar]
- Carter & Chou (1998).Carter DB, Chou KC. A model for structure dependent binding of Congo red to Alzheimer β-amyloid fibrils. Neurobiology of Aging. 1998;19:37–40. doi: 10.1016/S0197-4580(97)00164-4. [DOI] [PubMed] [Google Scholar]
- Chang et al. (2009).Chang W-C, Lee T-Y, Shien D-M, Hsu JB-K, Horng J-T, Hsu P-C, Wang T-Y, Huang H-D, Pan R-L. Incorporating support vector machine for identifying protein tyrosine sulfation sites. Journal of Computational Chemistry. 2009;30:2526–2537. doi: 10.1002/jcc.21258. [DOI] [PubMed] [Google Scholar]
- Chen et al. (2012a).Chen L, Zeng W-M, Cai Y-D, Feng K-Y, Chou K-C. Predicting anatomical therapeutic chemical (ATC) classification of drugs by integrating chemical-chemical interactions and similarities. PLoS ONE. 2012a;7:e35254. doi: 10.1371/journal.pone.0035254. [DOI] [PMC free article] [PubMed] [Google Scholar]
- Chen et al. (2012b).Chen W, Lin H, Feng P-M, Ding C, Zuo Y-C, Chou K-C. iNuc-PhysChem: a sequence-based predictor for identifying nucleosomes via physicochemical properties. PLoS ONE. 2012b;7:e47843. doi: 10.1371/journal.pone.0047843. [DOI] [PMC free article] [PubMed] [Google Scholar]
- Chen et al. (2013).Chen W, Feng P-M, Lin H, Chou K-C. iRSpot-PseDNC: identify recombination spots with pseudo dinucleotide composition. Nucleic Acids Research. 2013;41:e68. doi: 10.1093/nar/gks1450. [DOI] [PMC free article] [PubMed] [Google Scholar]
- Chen et al. (2010).Chen Y-J, Ku W-C, Lin P-Y, Chou H-C, Khoo K-H, Chen Y-J. S-alkylating labeling strategy for site-specific identification of the S-nitrosoproteome. Journal of Proteome Research. 2010;9:6417–6439. doi: 10.1021/pr100680a. [DOI] [PubMed] [Google Scholar]
- Chen & Li (2013).Chen Y-K, Li K-B. Predicting membrane protein types by incorporating protein topology, domains, signal peptides, and physicochemical properties into the general form of Chou’s pseudo amino acid composition. Journal of Theoretical Biology. 2013;318:1–12. doi: 10.1016/j.jtbi.2012.10.033. [DOI] [PubMed] [Google Scholar]
- Cho et al. (2009).Cho D-H, Nakamura T, Fang J, Cieplak P, Godzik A, Gu Z, Lipton SA. S-nitrosylation of Drp1 mediates β-amyloid-related mitochondrial fission and neuronal injury. Science. 2009;324:102–105. doi: 10.1126/science.1171091. [DOI] [PMC free article] [PubMed] [Google Scholar]
- Chou (1993).Chou K-C. A vectorized sequence-coupling model for predicting HIV protease cleavage sites in proteins. Journal of Biological Chemistry. 1993;268:16938–16948. [PubMed] [Google Scholar]
- Chou (1995).Chou K-C. A sequence-coupled vector-projection model for predicting the specificity of GalNAc-transferase. Protein Science. 1995;4:1365–1383. doi: 10.1002/pro.5560040712. [DOI] [PMC free article] [PubMed] [Google Scholar]
- Chou (1996).Chou K-C. Review: prediction of human immunodeficiency virus protease cleavage sites in proteins. Analytical Biochemistry. 1996;233:1–14. doi: 10.1006/abio.1996.0001. [DOI] [PubMed] [Google Scholar]
- Chou (2001a).Chou K-C. Prediction of protein cellular attributes using pseudo-amino acid composition. Proteins: Structure, Function, and Bioinformatics. 2001a;43:246–255. doi: 10.1002/prot.1035. 44: 60 (Erratum) [DOI] [PubMed] [Google Scholar]
- Chou (2001b).Chou K-C. Prediction of protein signal sequences and their cleavage sites. Proteins: Structure, Function, and Bioinformatics. 2001b;42:136–139. doi: 10.1002/1097-0134(20010101)42:1<136::AID-PROT130>3.0.CO;2-F. [DOI] [PubMed] [Google Scholar]
- Chou (2001c).Chou K-C. Prediction of signal peptides using scaled window. Peptides. 2001c;22:1973–1979. doi: 10.1016/S0196-9781(01)00540-X. [DOI] [PubMed] [Google Scholar]
- Chou (2001d).Chou K-C. Using subsite coupling to predict signal peptides. Protein Engineering. 2001d;14:75–79. doi: 10.1093/protein/14.2.75. [DOI] [PubMed] [Google Scholar]
- Chou (2011).Chou K-C. Some remarks on protein attribute prediction and pseudo amino acid composition. Journal of Theoretical Biology. 2011;273:236–247. doi: 10.1016/j.jtbi.2010.12.024. [DOI] [PMC free article] [PubMed] [Google Scholar]
- Chou (2013).Chou K-C. Some remarks on predicting multi-label attributes in molecular biosystems. Molecular BioSystems. 2013;9:1092–1100. doi: 10.1039/c3mb25555g. [DOI] [PubMed] [Google Scholar]
- Chou & Shen (2007).Chou K-C, Shen H-B. Review: recent progresses in protein subcellular location prediction. Analytical Biochemistry. 2007;370:1–16. doi: 10.1016/j.ab.2007.07.006. [DOI] [PubMed] [Google Scholar]
- Chou & Shen (2009).Chou K-C, Shen H-B. Review: recent advances in developing web-servers for predicting protein attributes. Natural Science. 2009;2:63–92. doi: 10.4236/ns.2009.12011. [DOI] [Google Scholar]
- Chou, Wu & Xiao (2011).Chou K-C, Wu Z-C, Xiao X. iLoc-Euk: a multi-label classifier for predicting the subcellular localization of singleplex and multiplex eukaryotic proteins. PLoS ONE. 2011;6:e18258. doi: 10.1371/journal.pone.0018258. [DOI] [PMC free article] [PubMed] [Google Scholar]
- Chou, Wu & Xiao (2012).Chou K-C, Wu Z-C, Xiao X. iLoc-Hum: using accumulation-label scale to predict subcellular locations of human proteins with both single and multiple sites. Molecular BioSystems. 2012;8:629–641. doi: 10.1039/c1mb05420a. [DOI] [PubMed] [Google Scholar]
- Chou & Zhang (1995).Chou K-C, Zhang C-T. Review: prediction of protein structural classes. Critical Reviews in Biochemistry and Molecular Biology. 1995;30:275–349. doi: 10.3109/10409239509083488. [DOI] [PubMed] [Google Scholar]
- Derakhshan, Wille & Gross (2007).Derakhshan B, Wille PC, Gross SS. Unbiased identification of cysteine S-nitrosylation sites on proteins. Nature Protocols. 2007;2:1685–1691. doi: 10.1038/nprot.2007.210. [DOI] [PubMed] [Google Scholar]
- Du et al. (2012).Du P, Wang X, Xu C, Gao Y. PseAAC-Builder: A cross-platform stand-alone program for generating various special Chou’s pseudo-amino acid compositions. Analytical Biochemistry. 2012;425:117–119. doi: 10.1016/j.ab.2012.03.015. [DOI] [PubMed] [Google Scholar]
- Du, Sun & Chou (2007).Du Q-S, Sun H, Chou K-C. Inhibitor design for SARS coronavirus main protease based on “distorted key theory”. Medicinal Chemistry. 2007;3:1–6. doi: 10.2174/157340607779317616. [DOI] [PubMed] [Google Scholar]
- Du et al. (2005).Du Q-S, Wang S, Wei DQ, Sirois S, Chou K-C. Molecular modelling and chemical modification for finding peptide inhibitor against severe acute respiratory syndrome coronavirus main proteinase. Analytical Biochemistry. 2005;337:262–270. doi: 10.1016/j.ab.2004.10.003. [DOI] [PMC free article] [PubMed] [Google Scholar]
- Esmaeili, Mohabatkar & Mohsenzadeh (2010).Esmaeili M, Mohabatkar H, Mohsenzadeh S. Using the concept of Chou’s pseudo amino acid composition for risk type prediction of human papillomaviruses. Journal of Theoretical Biology. 2010;263:203–209. doi: 10.1016/j.jtbi.2009.11.016. [DOI] [PubMed] [Google Scholar]
- Fan & Li (2012).Fan G-L, Li Q-Z. Predict mycobacterial proteins subcellular locations by incorporating pseudo-average chemical shift into the general form of Chou’s pseudo amino acid composition. Journal of Theoretical Biology. 2012;304:88–95. doi: 10.1016/j.jtbi.2012.03.017. [DOI] [PubMed] [Google Scholar]
- Forrester et al. (2009).Forrester MT, Thompson JW, Foster MW, Nogueira L, Moseley MA, Stamler JS. Proteomic analysis of S-nitrosylation and denitrosylation by resin-assisted capture. Nature Biotechnology. 2009;27:557–559. doi: 10.1038/nbt.1545. [DOI] [PMC free article] [PubMed] [Google Scholar]
- Gan et al. (2006).Gan Y-R, Huang H, Huang Y-D, Rao C-M, Zhao Y, Liu J-S, Wu L, Wei D-Q. Synthesis and activity of an octapeptide inhibitor designed for SARS coronavirus main proteinase. Peptides. 2006;27:622–625. doi: 10.1016/j.peptides.2005.09.006. [DOI] [PMC free article] [PubMed] [Google Scholar]
- Greco et al. (2006).Greco TM, Hodara R, Parastatidis I, Heijnen H-F, Dennehy MK, Liebler DC, Ischiropoulos H. Identification of S-nitrosylation motifs by site-specific mapping of the S-nitrosocysteine proteome in human vascular smooth muscle cells. Proceedings of the National Academy of Sciences of the United States of America. 2006;103:7420–7425. doi: 10.1073/pnas.0600729103. [DOI] [PMC free article] [PubMed] [Google Scholar]
- Jaffrey et al. (2001).Jaffrey SR, Erdjument-Bromage H, Ferris CD, Tempst P, Snyder SH. Protein S-nitrosylation: a physiological signal for neuronal nitric oxide. Nature Cell Biology. 2001;3:193–197. doi: 10.1038/35055104. [DOI] [PubMed] [Google Scholar]
- Khosravian et al. (2013).Khosravian M, Faramarzi FK, Beigi MM, Behbahani M, Mohabatkar H. Predicting antibacterial peptides by the concept of Chou’s Pseudo-amino acid composition and machine learning methods. Protein & Peptide Letters. 2013;20:180–186. doi: 10.2174/092986613804725307. [DOI] [PubMed] [Google Scholar]
- Kim et al. (2004).Kim JH, Lee J, Oh B, Kimm K, Koh I. Prediction of phosphorylation sites using SVMs. Bioinformatics. 2004;20:3179–3184. doi: 10.1093/bioinformatics/bth382. [DOI] [PubMed] [Google Scholar]
- Lahiry et al. (2010).Lahiry P, Torkamani A, Schork NJ, Hegele RA. Kinase mutations in human disease: interpreting genotype-phenotype relationships. Nature Reviews Genetics. 2010;11:60–74. doi: 10.1038/nrg2707. [DOI] [PubMed] [Google Scholar]
- Li et al. (2012).Li B-Q, Hu L-L, Niu S, Cai Y-D, Chou K-C. Predict and analyze S-nitrosylation modification sites with the mRMR and IFS approaches. Journal of Proteomics. 2012;75:1654–1665. doi: 10.1016/j.jprot.2011.12.003. [DOI] [PubMed] [Google Scholar]
- Li et al. (2007).Li F, Sonveaux P, Rabbani ZN, Liu S, Yan B, Huang Q, Vujaskovic Z, Dewhirst MW, Li C-Y. Regulation of HIF-1α stability through S-nitrosylation. Molecular Cell. 2007;26:63–74. doi: 10.1016/j.molcel.2007.02.024. [DOI] [PMC free article] [PubMed] [Google Scholar]
- Li et al. (2011).Li Y-X, Shao Y-H, Jing L, Deng N-Y. An efficient support vector machine approach for identifying protein S-nitrosylation sites. Protein & Peptide Letters. 2011;18:573–587. doi: 10.2174/092986611795222731. [DOI] [PubMed] [Google Scholar]
- Lin & Lapointe (2013).Lin S-X, Lapointe J. Theoretical and experimental biology in one—A symposium in honour of Professor Kuo-Chen Chou’s 50th anniversary and Professor Richard Giegé’s 40th anniversary of their scientific careers. Journal of Biomedical Science and Engineering. 2013;6:435–442. doi: 10.4236/jbise.2013.64054. [DOI] [Google Scholar]
- Liu et al. (2012).Liu L, Hu X-Z, Liu X-X, Wang Y, Li S-B. Predicting protein fold types by the general form of Chou’s pseudo amino acid composition: approached from optimal feature extractions. Protein & Peptide Letters. 2012;19:439–449. doi: 10.2174/092986612799789378. [DOI] [PubMed] [Google Scholar]
- Lugovskoy et al. (1999).Lugovskoy AA, Zhou P, Chou JJ, McCarty JS, Li P, Wagner G. Solution structure of the CIDE-N domain of CIDE-B and a model for CIDE-N/CIDE-N interactions in the DNA fragmentation pathway of apoptosis. Cell. 1999;99:747–755. doi: 10.1016/S0092-8674(00)81672-4. [DOI] [PubMed] [Google Scholar]
- Mann & Jensen (2003).Mann M, Jensen ON. Proteomic analysis of post-translational modifications. Nature Biotechnology. 2003;21:255–261. doi: 10.1038/nbt0303-255. [DOI] [PubMed] [Google Scholar]
- Mei (2012).Mei S. Predicting plant protein subcellular multi-localization by Chou’s PseAAC formulation based multi-label homolog knowledge transfer learning. Journal of Theoretical Biology. 2012;310:80–87. doi: 10.1016/j.jtbi.2012.06.028. [DOI] [PubMed] [Google Scholar]
- Mohabatkar et al. (2013).Mohabatkar H, Mohammad Beigi M, Abdolahi K, Mohsenzadeh S. Prediction of allergenic proteins by means of the concept of Chou’s pseudo amino acid composition and a machine learning approach. Medicinal Chemistry. 2013;9:133–137. doi: 10.2174/157340613804488341. [DOI] [PubMed] [Google Scholar]
- Mohabatkar, Mohammad Beigi & Esmaeili (2011).Mohabatkar H, Mohammad Beigi M, Esmaeili A. Prediction of GABA(A) receptor proteins using the concept of Chou’s pseudo-amino acid composition and support vector machine. Journal of Theoretical Biology. 2011;281:18–23. doi: 10.1016/j.jtbi.2011.04.017. [DOI] [PubMed] [Google Scholar]
- Nanni et al. (2010).Nanni L, Shi J-Y, Brahnam S, Lumini A. Protein classification using texture descriptors extracted from the protein backbone image. Journal of Theoretical Biology. 2010;264:1024–1032. doi: 10.1016/j.jtbi.2010.03.020. [DOI] [PubMed] [Google Scholar]
- Shen & Chou (2008).Shen H-B, Chou K-C. HIVcleave: a web-server for predicting human immunodeficiency virus protease cleavage sites in proteins. Analytical Biochemistry. 2008;375:388–390. doi: 10.1016/j.ab.2008.01.012. [DOI] [PubMed] [Google Scholar]
- Tsang et al. (2009).Tsang AHK, Lee Y-I, Ko HS, Savitt JM, Pletnikova O, Troncoso JC, Dawson VL, Dawson TM, Chung KKK. S-nitrosylation of XIAP compromises neuronal survival in Parkinson’s disease. Proceedings of the National Academy of Sciences of the United States of America. 2009;106:4900–4905. doi: 10.1073/pnas.0810595106. [DOI] [PMC free article] [PubMed] [Google Scholar]
- Uehara et al. (2006).Uehara T, Nakamura T, Yao D, Shi Z-Q, Gu Z, Ma Y, Masliah E, Nomura Y, Lipton SA. S-nitrosylated protein-disulphide isomerase links protein misfolding to neurodegeneration. Nature. 2006;441:513–517. doi: 10.1038/nature04782. [DOI] [PubMed] [Google Scholar]
- Walsh & Jefferis (2006).Walsh G, Jefferis R. Post-translational modifications in the context of therapeutic proteins. Nature Biotechnology. 2006;24:1241–1252. doi: 10.1038/nbt1252. [DOI] [PubMed] [Google Scholar]
- Wan, Mak & Kung (2013).Wan S, Mak M-W, Kung S-Y. GOASVM: A subcellular location predictor by incorporating term-frequency gene ontology into the general form of Chou’s pseudo-amino acid composition. Journal of Theoretical Biology. 2013;323:40–48. doi: 10.1016/j.jtbi.2013.01.012. [DOI] [PubMed] [Google Scholar]
- Whalen et al. (2007).Whalen EJ, Foster MW, Matsumoto A, Ozawa K, Violin JD, Que LG, Nelson CD, Benhar M, Keys JR, Rockman HA, Koch WJ, Daaka Y, Lefkowitz RJ, Stamler JS. Regulation of beta-adrenergic receptor signaling by S-nitrosylation of G-protein-coupled receptor kinase 2. Cell. 2007;129:511–522. doi: 10.1016/j.cell.2007.02.046. [DOI] [PubMed] [Google Scholar]
- Wong et al. (2007).Wong Y-H, Lee T-Y, Liang H-K, Huang C-M, Wang T-Y, Yang Y-H, Chu C-H, Huang H-D, Ko M-T, Hwang J-K. KinasePhos 2.0: a web server for identifying protein kinase-specific phosphorylation sites based on sequences and coupling patterns. Nucleic Acids Research. 2007;35:W588–W594. doi: 10.1093/nar/gkm322. [DOI] [PMC free article] [PubMed] [Google Scholar]
- Xiao et al. (2013).Xiao X, Wang P, Lin W-Z, Jia J-H, Chou K-C. iAMP-2L: A two-level multi-label classifier for identifying antimicrobial peptides and their functional types. Analytical Biochemistry. 2013;436:168–177. doi: 10.1016/j.ab.2013.01.019. [DOI] [PubMed] [Google Scholar]
- Xu et al. (2013).Xu Y, Ding J, Wu L-Y, Chou K-C. iSNO-PseAAC: predict cysteine S-nitrosylation sites in proteins by incorporating position specific amino acid propensity into pseudo amino acid composition. PLoS ONE. 2013;8:e55844. doi: 10.1371/journal.pone.0055844. [DOI] [PMC free article] [PubMed] [Google Scholar]
- Xue et al. (2010).Xue Y, Liu Z, Gao X, Jin C, Wen L, Yao X, Ren J. GPS-SNO: computational prediction of protein S-nitrosylation sites with a modified GPS algorithm. PLoS ONE. 2010;5:e11290. doi: 10.1371/journal.pone.0011290. [DOI] [PMC free article] [PubMed] [Google Scholar]
- Yao et al. (2004).Yao D, Gu Z, Nakamura T, Shi ZQ, Ma Y, Gaston B, Palmer LA, Rockenstein EM, Zhang Z, Masliah E, Uehara T, Lipton SA. Nitrosative stress linked to sporadic Parkinson’s disease: S-nitrosylation of parkin regulates its E3 ubiquitin ligase activity. Proceedings of the National Academy of Sciences of the United States of America. 2004;101:10810–10814. doi: 10.1073/pnas.0404161101. [DOI] [PMC free article] [PubMed] [Google Scholar]
- Yu et al. (2010).Yu L, Guo Y, Li Y, Li G, Li M, Luo J, Xiong W, Qin W. SecretP: identifying bacterial secreted proteins by fusing new features into Chou’s pseudo-amino acid composition. Journal of Theoretical Biology. 2010;267:1–6. doi: 10.1016/j.jtbi.2010.08.001. [DOI] [PubMed] [Google Scholar]
- Zhang et al. (2008a).Zhang SW, Chen W, Yang F, Pan Q. Using Chou’s pseudo amino acid composition to predict protein quaternary structure: a sequence-segmented PseAAC approach. Amino Acids. 2008a;35:591–598. doi: 10.1007/s00726-008-0086-x. [DOI] [PubMed] [Google Scholar]
- Zhang et al. (2008b).Zhang S-W, Zhang Y-L, Yang H-F, Zhao C-H, Pan Q. Using the concept of Chou’s pseudo amino acid composition to predict protein subcellular localization: an approach by incorporating evolutionary information and von Neumann entropies. Amino Acids. 2008b;34:565–572. doi: 10.1007/s00726-007-0010-9. [DOI] [PubMed] [Google Scholar]
- Zhou et al. (2007).Zhou X-B, Chen C, Li Z-C, Zou X-Y. Using Chou’s amphiphilic pseudo-amino acid composition and support vector machine for prediction of enzyme subfamily classes. Journal of Theoretical Biology. 2007;248:546–551. doi: 10.1016/j.jtbi.2007.06.001. [DOI] [PubMed] [Google Scholar]
Associated Data
This section collects any data citations, data availability statements, or supplementary materials included in this article.
Supplementary Materials
They each contain 2300 SNO and 2300 non-SNO sites and peptide fragments derived from the 1,530 proteins. See the text of the paper for further explanation.
The former contains 81 SNO sites and the latter 100 non-SNO sites. None of the sites and peptide fragments included here occurs in the learning dataset 𝕊L. See the text of the paper for further explanation.
The SNO site is marked with red, while non-SNO site with blue.