

Abstract
Recent evidence suggests that endocytosis, not exocytosis, can be rate limiting for neurotransmitter release at excitatory CNS synapses during sustained activity and therefore may be a principal determinant of synaptic fatigue. At low stimulation frequencies, the probability of synaptic release is linked to the probability of synaptic retrieval such that evoked release results in proportional retrieval even for release of single synaptic vesicles. The exact mechanism by which the retrieval rates are coupled to release rates, known as compensatory endocytosis, remains unknown. Here we show that inactivation of presynaptic myosin II (MII) decreases the probability of synaptic retrieval. To be able to differentiate between the presynaptic and postsynaptic functions of MII, we developed a live cell substrate patterning technique to create defined neural circuits composed of small numbers of embryonic mouse hippocampal neurons and physically isolated from the surrounding culture. Acute application of blebbistatin to inactivate MII in circuits strongly inhibited evoked release but not spontaneous release. In circuits incorporating both control and MIIB knock-out cells, loss of presynaptic MIIB function correlated with a large decrease in the amplitude of evoked release. Using activity-dependent markers FM1–43 and horseradish peroxidase, we found that MII inactivation greatly slowed vesicular replenishment of the recycling pool but did not impede synaptic release. These results indicate that MII-driven tension or actin dynamics regulate the major pathway for synaptic vesicle retrieval. Changes in retrieval rates determine the size of the recycling pool. The resulting effect on release rates, in turn, brings about changes in synaptic strength.
Introduction
The strength of the postsynaptic response to an action potential is determined by the number of synaptic vesicles available for fusion (i.e., the size of the readily releasable pool (RRP)), the probability that each vesicle has of fusing with the presynaptic membrane in response to an action potential, and the size of the postsynaptic response to neurotransmitter release from a single fusion event (Ariel and Ryan, 2012). Changes in synaptic strength are induced primarily by repeated activation of presynaptic inputs (Bliss and Collingridge, 1993). Thus maintenance of synaptic efficacy during sustained transmission plays an important role in shaping long-term changes in synaptic strength. Compensatory endocytosis (CE) is a major mechanism by which this maintenance is achieved. Its functions include the following: (1) replenishing the recycling pool of synaptic vesicles (Schweizer and Ryan, 2006) and (2) removing excess membrane from the synapse to keep the presynaptic and postsynaptic membranes congruent. Evoked release is said to be tightly coupled to CE in that the depletion of the recycling pool quickly leads to its replenishment. There is debate as to the nature of the relationship between synaptic release and synaptic retrieval. Are these processes actually coupled? Our view is that the coupling can best be understood as coordinated changes in the probabilities of release and retrieval. Each process is likely independent, and the recycling pool represents the physical link between them. How these probabilities change in a coordinated manner remains an open question.
Previous studies have shown that clathrin-mediated endocytosis (CME) is the primary pathway of CE at central synapses (Granseth et al., 2006). The core molecular components and adaptor/accessory proteins of CME have been identified (Dannhauser and Ungewickell, 2012; Saheki and De Camilli, 2012), but its regulation is not well understood. Recent work has demonstrated a regulatory role for synaptotagmin (Lee et al., 2013). In addition, dynamin binds to filamentous actin suggesting possible interdependencies between dynamin and actin during CME (Mooren et al., 2009), although the requirement for actin during CME is a point of controversy (Shupliakov et al., 2002; Sankaranarayanan et al., 2003; Bourne et al., 2006; Smythe and Ayscough, 2006; Taylor et al., 2012). Increased membrane tension partially inhibits CE, and actin appears to regulate endocytosis during changes in membrane tension (Boulant et al., 2011) suggesting that the requirement for actin during endocytosis may vary with activity (Heidelberger et al., 2002) and may be transient (Merrifield et al., 2002).
To further clarify the role of the actin cytoskeleton and local tension, we tested whether or not CE is myosin II (MII) dependent. Inducing loss of MII function through genetic manipulation or pharmacologic inhibition, we found that MII regulates the rate of synaptic retrieval in response to evoked release and, thus, determines the number of newly formed synaptic vesicles available for fusion. In the absence of MII activity, synaptic strength is greatly diminished consistent with a major mechanism of CE regulation being MII-driven actin dynamics or tension.
Materials and Methods
Cell culture.
Embryonic mouse hippocampal cultures were prepared by dissociating cells using papain ((Worthington) from hippocampi dissected from E13.5-E14.5 mouse brains of either sex (Goslin et al., 1998). Myosin IIB heavy chain knock-out (MIIB KO) embryos were identified as described previously (Bridgman et al., 2001). Heterozygous mice were identified by PCR amplification of the PGK-Neo cassette insertion and appeared phenotypically normal. (They develop into adults, breed normally, and show no consistent behavioral abnormalities.) We could not detect any significant differences between results obtained from heterozygous and Wt neurons, and gene dosage experiments have shown that abnormalities are not detected until MIIB heavy chain expression falls below 65% (Uren et al., 2000). Therefore data from these embryos were pooled as controls. MIIB KO cultures were always matched with control cultures from heterozygous and Wt embryos of the same litter. Cells were plated on etched coverslips (Belco) coated with poly-l-lysine (10 μg/ml; Sigma) and laminin (20 μg/ml; BD) in medium containing 10% fetal calf serum for 2–3 h to allow cell attachment, and then switched to Neurobasal (NB) medium containing the B27 supplement (Invitrogen). In some experiments embryonic mice (matched in developmental stage) expressing YFP under the Thy-1 promoter (Feng et al., 2000) were used for mixed cell cultures. Experiments were performed on hippocampal cell circuits consisting of 4–10 cells physically isolated (but not chemically isolated) from the larger culture and grown for 10–14 days in vitro (DIV; unless noted). A circuit was created by irradiating the growth substrate around a group of selected cells (∼16 h after plating) using high-intensity ultrafast pulsed 800 nm laser light (multiphoton excitation). The substrate patterning was performed using region of interest (ROI) scanning on a Zeiss LSM 510 NLO equipped with a 40× (1.2 NA) water-immersion objective. Laminin was removed from the irradiated regions making them growth impermissive. Any cells present in the irradiated regions were also removed at the same time. Cells on the nonirradiated island interacted and formed connections normally. Glial cells were selectively eliminated from circuits by ROI scanning with the high-intensity laser light. The procedure for substrate patterning after plating will be described in further detail later. One circuit was created for each culture dish. For blebbistatin (EMD Millipore) treatment the active (−) form of the drug was either added directly to warm NB or to Tyrode's solution at a final concentration of 50 μm. The inactive (+) form was used as a control. All procedures for use of animals have been approved by the Washington University Animal Studies Committee.
Electrophysiology.
Spontaneous and evoked EPSCs were recorded from pairs of knock-out and/or control neurons held at −80 mV under simultaneous dual whole-cell voltage-clamp (Axopatch 200 series amplifiers). The extracellular solution delivered from a local perfusion pipette contained the following (in mm): 120 NaCl, 3 KCl, 3 CaCl2, 1 MgCl2, 10 glucose, 1 NaH2PO4, 4 NaHCO3, and 5 HEPES, pH adjusted to 7.4 with NaOH. In addition, the culture dish was bath perfused with room temperature Tyrode's solution (Finley et al., 1996). Electrodes had an open tip resistance of 2–5 MΩ when filled with either of the following internal solutions containing (in mm): 140 K-glucuronate, 10 NaCl, 5 MgCl2, 0.2 EGTA, 5 Na-ATP, 1 Na-GTP, and 10 HEPES, pH adjusted to 7.4 with KOH, or 140 Cs-glucuronate, 5 CsCl, 5 MgCl2, 10 EGTA, 5 Na-ATP, 1 Na-GTP, and 10 HEPES, pH adjusted to 7.4 with CsOH. Presynaptic cells were stepped briefly (5–10 ms) to ∼0 mV to evoke axonal sodium currents that escaped voltage control and triggered transmitter release. EPSCs were filtered at 1 kHz, digitized at 10 kHz, and analyzed off-line with Clampfit (pClamp, version 9.2). spontaneous EPSCs (sEPSCs) are likely to represent miniature EPSCs (individual quanta) because spontaneous action potential firing is rare in islands containing small numbers of neurons (Segal and Furshpan, 1990). Results are presented with error bars as mean ± SEM. Statistical analysis was performed as described in each figure legend; p < 0.05 was considered significant. For datasets that failed an initial test for normality and equal variance, we performed pairwise and multiple comparisons using the nonparametric Mann–Whitney rank sum test and ANOVA on ranks (with individual post hoc comparisons by Dunn's method), respectively (SigmaStat; Systat Software). Power analysis was performed using the on-line application available at www.statisticalsolutions.net.
Stimulated FM1–43 uptake.
Cultures were incubated with FM1–43 (4 μm; Invitrogen) during stimulation with high K+ containing medium for 5 min (37°C; Richards et al., 2005). They were then rinsed with normal medium 4× before live imaging. K+ depolarization produces a continuous entry of Ca2+ and, thus, represents a fairly strong stimulation compared with action potential trains generated by field stimulation, but possibly not as strong as continuous field stimulation at 10 Hz for 60 s (Ryan and Smith, 1995). We used an intermediate level of KCl (45 mm) to mimic a relatively intense stimulation compared with that reported for stimulation of rat hippocampal cultures (30–90 mm; Ryan and Smith, 1995; Cheung et al., 2010) because the mouse hippocampal cultures appeared to tolerate repeated bouts of stimulation better with the intermediate concentration than with higher concentrations. The time used (5 min) was the minimum required to achieve maximal loading with the 4 μm concentration of FM1–43 (Richards et al., 2005). In some experiments the length of K+ depolarization was increased to 10 min as indicated in the text. For destaining the K+ depolarization time was reduced to 2 min. All puncta (boutons) that showed increased fluorescence intensity upon stimulation within a field were analyzed.
Fluorescent transferrin uptake.
Cultures were labeled with fluorescent transferrin using either Alexa 546 or 488 conjugates (100 μg/ml; Invitrogen) at 37°C for 10 min. They were rinsed with warm medium that was pre-equilibrated with CO2 before live imaging.
Electron microscopy.
For horseradish peroxidase (HRP) uptake experiments hippocampal cultures were incubated with 10 mg/ml HRP (Sigma type VI) dissolved in NB medium or Tyrode's solution for 5 min or 90 s at 37°C (+/−45 mm KCl; (Heuser and Reese, 1973). Before fixation, cultures were rinsed 4× with NB medium or Tyrode's solution without HRP. For the 90 s K+ depolarization, the NB medium used for rinsing (30 s) contained 45 mm KCL. The initial fixation was with 0.5% glutaraldehyde for 1 h. The HRP reaction was performed by pre-incubating with 0.5 mg/ml diaminobenzidine (Sigma) (15 min) and then adding 0.005% H2O2 for 10 min. Postfixation was performed with 2.5% glutaraldehyde (Polysciences) for 1 h followed by 0.5% OsO4 (EM Sciences) for 1 h or 0.5% OsO4+ 0.5% K+ ferricyanide for 15 min. Samples were stained en bloc using 50 mm uranyl acetate (EM Sciences) in acetate buffer, pH 5.2, for 15 min. Samples were dehydrated with ethanol and embedded in Araldite (EM Sciences). Circuits were identified using the alphanumeric pattern etched into the glass coverslip. A replica of the pattern could be seen on the surface of the polymerized resin once the glass was removed. For experiments using blebbistatin, duplicate cultures were used; one set was maintained in NB (±blebbistatin), and the other was transferred to Tyrode's solution before treatment (to mimic the conditions used for electrophysiology). The experiments were performed three times. To enhance coated pit detection some hippocampal cultures were fixed with 2.5% glutaraldehyde and then postfixed with 0.5% OsO4 + 0.5% K+ ferricyanide (Sigma) for 15 min. After reaction with either 1% or 0.2% tannic acid (15 min; Sigma) cultures were stained en bloc with 50 mm uranyl acetate in acetate buffer for 15 min. Dehydration and embedding was as above. Images were taken on a JOEL 1400 microscope equipped with 4K AMT digital camera. We defined synaptic vesicles as <65 nm. Vesicle counts were done using color overlays in Photoshop. The percentage of HRP-positive synaptic vesicles was calculated from the number of HRP-positive vesicles divided by the total number of vesicles in a synapse.
Immunolabeling.
Fixed cultures were labeled with antibodies to synapsin1, synaptobrevin (Synaptic Systems), the myosin IIB or IIA heavy chains (Covance), or endosomal antigen 1 (EEA1; Sigma) as described previously (Rochlin et al., 1996; Bridgman et al., 2001).
Light microscopy.
For monitoring FM1–43 and transferrin uptake, cultures were imaged on an inverted Zeiss LSM 510 NLO microscope system equipped with a motorized x-y stage and a stage-top incubator. For live imaging, single 2D confocal images were taken with a 40× water-immersion lens (NA 1.2) using a pinhole setting adjusted to give an optical section (2.2 μm) that was greater than the thickness of cell processes. To allow repeated imaging of the same cells over time, the stage coordinates were recorded. For fixed cultures, a 63× (NA 1.4) oil-immersion lens was used. An Olympus IX71 microscope equipped with a 60× (NA 1.4) oil-immersion lens and a Sensicam CCD camera (PCO-TECH) was used for epifluorescence microscopy of fixed cells. Fluorescence intensity was analyzed after background subtraction using ImageJ.
Results
Non-muscle MII is essential for normal synaptic transmission
Most neurons express MII both presynaptically and postsynaptically. MII serves general functions throughout the cell, including the control of cortical tension, but may also play specific roles at synapses (Salbreux et al., 2012; Kneussel and Wagner, 2013). Although previous work has shown that MII inhibition alters synaptic structure (Ryu et al., 2006; Rex et al., 2010), an open question is whether these structural changes indicate a specific regulatory function for MII that is essential for synaptic transmission. To test for a presynaptic requirement for MII in maintaining synaptic strength we performed a series of experiments that allowed us to isolate specific presynaptic and postsynaptic effects and distinguish them from global structural changes. First we used electrophysiology to compare synaptic coupling strength in defined circuits of 4–10 hippocampal neurons isolated from MIIB KO or control (Ct; Wt or heterozygous) embryos. Since the KO is embryonic lethal by E15, we used E14.5 or younger embryos for cell culture. The circuits were created using a live cell substrate patterning technique the day after plating and then grown for 10–14 DIV (Fig. 1). Pairs of MIIB KO or Ct cells were held at −80 mV under simultaneous whole-cell voltage clamp. Evoked responses were induced by alternating activation of individual cells, and EPSCs were recorded from their respective partners. The average peak amplitude of evoked EPSCs was ∼20-fold lower in MIIB KO circuits compared with Ct circuits (Fig. 1A), but there was no significant difference between Ct and MIIB KO neurons in the mean EPSC half-width, or the rise or decay time constants (Fig. 2A). A comparison of sEPSCs, which presumably represent quantal responses (i.e., miniature EPSCs; see Materials and Methods), revealed a 50% decrease in amplitude, but no change in other parameters (Figs. 1C, 2B,C). Cumulative probability plots of EPSC amplitude from different Ct and MIIB KO circuits illustrate the range of spontaneous and evoked EPSC amplitudes recorded between cells (Fig. 2C). We did not observe high-amplitude EPSCs in response to stimulation in MII KO cells, and the probability of failure was high. Synaptic density at 10–12 DIV was 55% lower in the MIIB KO circuits than in Ct circuits, based on the number of double-positive puncta (immunostaining for synapsin-I and PSD95) along neurites (Fig. 2D). The decrease in double-positive puncta was partially a result of greater mismatch between the presynaptic and postsynaptic staining.
Figure 1.

Inhibition of MII activity through genetic ablation (KO) or acute blebbistatin treatment produces a large decrease in evoked EPSC amplitude, but has only a minor effect on sEPSC amplitudes. A, Comparison of the evoked EPSC amplitude in isolated simple circuits of hippocampal neurons (10–14 DIV) from control (Ct), MIIB KO (KO), or control cells treated with blebbistatin (Bleb). A significant 20-fold decrease was observed in KO cells, while an even greater decrease was obtained with blebbistatin treatment (<30 min at 37°C). In circuits containing a mixture of Ct and KO cells (F) the decrease in EPSC amplitude was observed in both directions (by driving release by either Ct or KO cells) indicating both presynaptic and postsynaptic defects. The cell numbers are indicated on the figure. Differences among the five groups are significant (Kruskal–Wallis ANOVA on ranks, p < 0.001); KO, bleb, ct->KO, and KO->ct are significantly different from control (post hoc comparison by Dunn's method, p < 0.05). B, Rapid inhibition of EPSC amplitudes during perfusion of blebbistatin. Paired stimulations and recordings were taken at 5 s intervals (0.2 Hz) for 10 min before perfusion and for at least 10 min during perfusion (room temperature). A 60% drop in amplitude was seen within 10 min, N = 4 cells. C, sEPSC amplitudes showed an ∼50% decrease in KO cells compared with Ct cells consistent with the postsynaptic defect observed in mixed cultures. (ANOVA, p = 0.0036; Bonferroni's method, p < 0.05). However, the blebbistatin-treated cells did not show a significant decrease in sEPSC amplitude. sEPSC frequency did not show a significant change under the different conditions (ANOVA, p = 0.329). D, Examples of dual patch-clamp recordings from cell pairs in the simple circuits formed by Ct cells (for example, 1 > 2, indicates that cell 1 was stimulated to evoke release and the response was recorded from cell 2). The square in the alphanumeric etched coverslip is 525 μm wide. E, A similar comparison of the recordings from a circuit that was treated with blebbistatin. Note the scale difference (pA). F, Examples of recordings from mixed cultures (YFP-expressing control cells mixed with unlabeled MIIB KO cells). Error bars indicate SEM.
Figure 2.
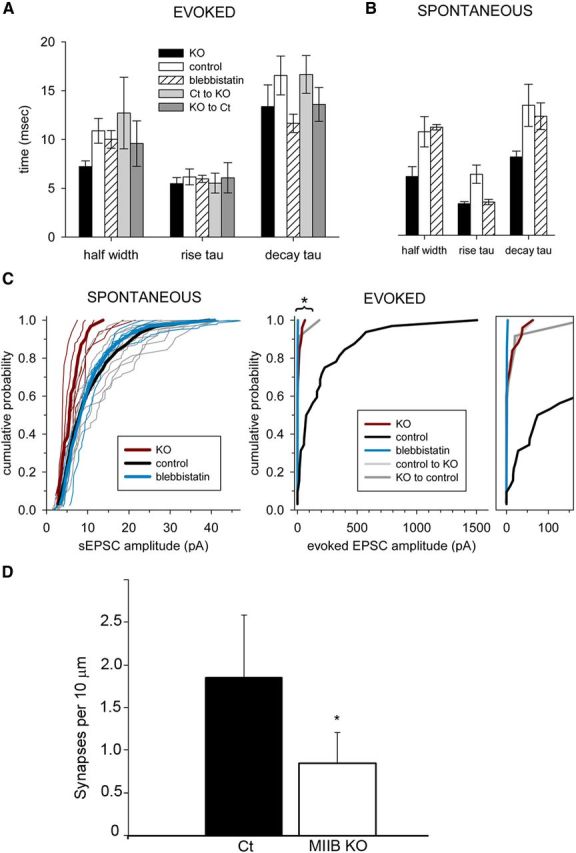
Comparison of evoked and spontaneous synaptic current properties and synaptic density between Ct and MIIB KO cells. A, Comparison of evoked EPSC parameters. Differences were not significant. (Kruskal–Wallis ANOVA on ranks, p > 0.30). B, Comparison of the sEPSC parameters. Differences were not significant (Kruskal–Wallis ANOVA on ranks, p = 0.08 and 0.17 for rise and decay tau, respectively; p = 0.045 for half-width but post hoc comparison by Dunn's method indicates that neither KO nor bleb are significantly different from Ct, p > 0.05; Power > 0.8). C, Cumulative probability plots of EPSC amplitude for spontaneous (left) and evoked (right) events. For sEPSCs, thin lines show events from individual cells and thick lines represent the average cumulative probabilities for control (black), KO (red), and blebbistatin treated (blue), at each amplitude. The KO sEPSC plot is significantly different from Ct and blebbistatin treated (p = 0.03, Kolmogorov–Smirnov test), but blebbistatin treated versus Ct was not significant. For evoked EPSCs, the control plot is different from all of the others (p < 0.001, Kolmogorov–Smirnov test). Amplitude values from 0 to 150 pA are replotted on an expanded scale for clarity. Cell numbers are the same as for Figure 1. D, Comparison of synaptic density in Ct and MIIB KO circuits after 10–12 DIV. Cells were costained with antibodies to synapsin 1 and PSD95. Double-positive spots (overlapping or side to side) were scored as synapses. Wt, N = 71; MIIB KO, N = 42 fields (from 3 circuits each). The differences were significant (*t test, p < 0.001). Error bars indicate SEM.
The greatly reduced synaptic transmission observed in circuits of MIIB KO neurons may simply be a consequence of improper synapse development that results in reduced synaptic density (decreased number of vesicles available for release) and alterations in postsynaptic structure (decreased postsynaptic response). However, it seems unlikely that a 55% decrease in synaptic density and a 50% decrease in sEPSC amplitude could account for the 20-fold decrease in the evoked synaptic currents. Thus it appears that MIIB may contribute to normal synaptic transmission through an active functional role.
To test whether developmental defects explained the functional abnormalities, we inactivated MII in Ct circuits acutely using the small molecule inhibitor blebbistatin. Neuronal pairs in defined Ct circuits were stimulated and recorded as described above before and during perfusion (at room temperature) with blebbistatin (50 μm). Repetitive stimulation (5 s intervals) produced a relatively rapid progressive decrease in EPSC amplitude during blebbistatin perfusion that reached 60% after 10 min (Fig. 1B). It was difficult to maintain recordings for >30 min, which is the amount of time required to completely inhibit MII with blebbistatin (Straight et al., 2003). Therefore we also pre-incubated with blebbistatin (50 μm) for 20 min at 37°C, before recording spontaneous and evoked EPSCs from cell pairs in the presence of blebbistatin. Under these conditions, blebbistatin treatment caused a near complete block of evoked EPSCs recorded from pairs of Ct neurons in circuits (Fig. 1A,D,E); however, spontaneous release activity persisted and sEPSC recordings did not differ from untreated Ct in frequency or amplitude (Figs. 1C, 2C). There were also no significant differences between Ct and blebbistatin-treated neurons in the half-width, rise or decay time constants of evoked or sEPSC recordings (Fig. 2A,B). Together, the data indicate that MII contributes to synaptic development, but also plays an important active role in maintaining normal synaptic transmission.
MII has important presynaptic and postsynaptic roles at central synapses
While the above experiments indicate that loss of MII function greatly affects synaptic transmission, it is unclear whether the functional defect is presynaptic, postsynaptic, or both. Previous reports indicate that MII is important for the morphogenesis and dynamics of postsynaptic dendritic spines and thus may affect synaptic efficacy (Ryu et al., 2006; Rex et al., 2010). We have observed similar defects in the morphology and dynamics of spines in MIIB KO hippocampal neurons (see Fig. 4B,C), and the decrease in sEPSC amplitudes is consistent with a postsynaptic defect. However, previous work is also mixed in its assignment of presynaptic and postsynaptic effects of blebbistatin treatments (Ryu et al., 2006; Peng et al., 2012). In our experiments blebbistatin profoundly reduced evoked release without the need for high-frequency stimulus trains used in previous studies, but caused no detectable change in sEPSC amplitude or frequency. Our results are consistent with the Peng et al. (2012) study suggesting that evoked release requires MII activity, but spontaneous release does not.
Figure 4.

MIIB KO cells show structural abnormalities at synapses. A, Comparison of immunostaining for synaptobrevin (green), synapsin-1 (red), and neurofilaments (blue) following K+ depolarization. Both Ct and MIIB KO cells show accumulations of synaptobrevin staining (arrowheads), but in the MIIB KO cells the staining frequency is increased and the accumulations are abnormally large. Scale bar, 7 μm. B, MIIB KO cells show abnormal spine development; comparison of Ct and MIIB KO cells expressing YFP. The MIIB KO cells show numerous elongated filopodia-like structures (arrowheads) and few mature spines. Phalloidin staining showed a very similar appearance. Scale bar, 2 μm. C, Comparison of synaptic development at 28 DIV. EM examples of synapses on dendritic shafts or spines. In the MIIB KO cells (bottom) the spines were abnormally long and sometimes branched. Synapses often occur on their sides. Scale bar, 350 nm.
To distinguish more clearly between the presynaptic and postsynaptic effects of genetically ablating MIIB, we took advantage of our substrate patterning technique and created defined circuits that included a mixture of Ct and MIIB KO neurons, with both types having transgenic YFP expression to allow the identification of individual cells. EPSCs were evoked as described above while recording simultaneously from a Ct neuron and MIIB KO neuron, alternating the stimulation to drive release of neurotransmitter from each cell in turn. Evoked EPSC amplitudes were decreased both from Ct to KO and from KO to Ct indicating that both presynaptic and postsynaptic defects contribute to the reduction in the strength of synaptic transmission (Fig. 1A, Mixed Islands, F, Mixed). We did not detect an obvious change in AMPA receptor dendritic staining compared with controls (Fig. 3A), and so other factors are likely to contribute to the decreased postsynaptic response. The combination of a lower synaptic density and a decreased postsynaptic response may account for up to a fourfold decrease in EPSC amplitude, but does not account for the 20-fold decrease observed in MIIB KO cells. Furthermore, acute inhibition of MII results in the same size or larger drop in the evoked EPSC amplitude but no decrease in sEPSC amplitude suggesting that inactivation of MII has a profound detrimental effect on evoked synaptic release.
Figure 3.
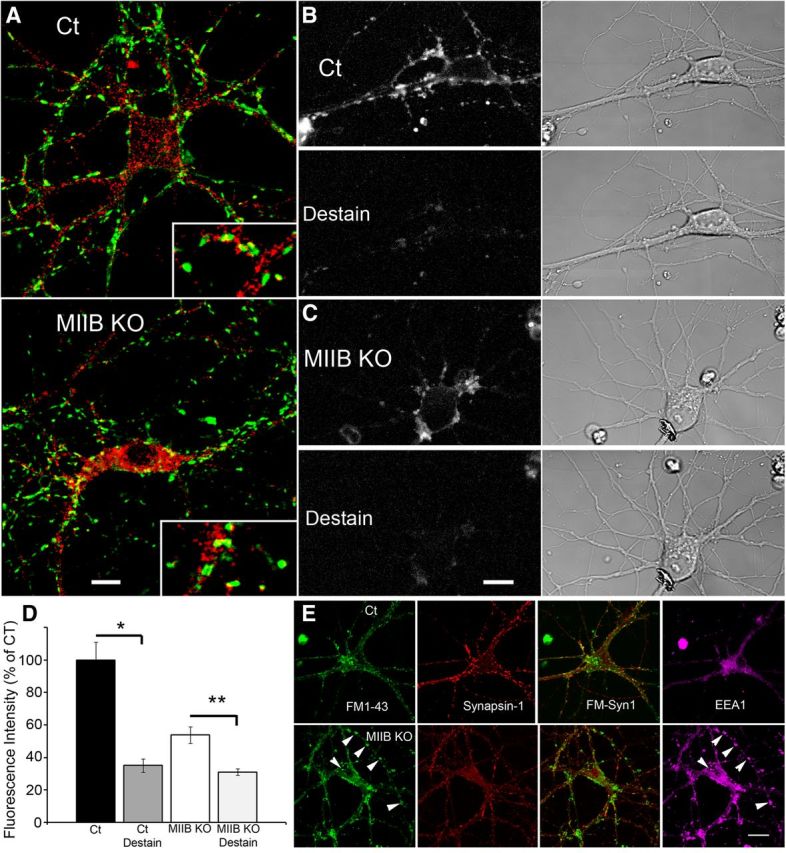
Glutamate receptor (AMPA, GluR1) distribution appears relatively normal in MIIB KO neurons, but MIIB KO neurons show decreased uptake and release of FM1–43. A, Comparison of glutamate receptor distribution in Ct and MIIB KO cells costained with an antibody to synaptobrevin (green) and the glutamate receptor (red). There are no readily apparent differences in receptor distribution or staining intensity. Scale bar, 11 μm. B, Top, (Fluorescence and DIC) show a control neuron after loading FM1–43 with a 5 min K+ depolarization. Just below, is the same cell after a second 2 min K+ depolarization to cause release (destaining) of FM1–43. C, MIIB KO neuron treated as in B. FM1–43 puncta are less bright after loading with FM1–43, but destaining appears to be equally efficient. D, Quantitative analysis of FM1–43 staining and destaining of individual puncta. (Ct, * decrease was significant; t test, p < 0.001, N = 37 puncta from 3 circuits). MIIB KO neurons have fewer and dimmer puncta, but show a significant decrease in fluorescence intensity upon destaining to the same levels as Ct cells (error bars indicate SEM; ** t test, p < 0.001, N = 26 puncta from 3 circuits). E, A Ct cell imaged while live showing FM1–43 uptake (top left) in response to K+ depolarization (10 min). Synapsin-1 immunofluorescence (second part) shows a similar distribution to the FM1–43 fluorescence. Superimposition of the two labels (third part) shows a high degree of correspondence. EEA1 immunofluorescence staining (right) shows a low degree of overlap with FM1–43 and synapsin-1 staining. A MIIB KO cell imaged after fixation (bottom left) showing the FM1–43 uptake in response to K+ depolarization (10 min; the live image was very similar). Multiple bright accumulations are apparent (arrowheads). Synapsin-1 immunofluorescence (second part) shows partial overlap with the FM1–43 staining, but less than that seen in the Ct. The bright FM1–43 accumulations show little overlap with synapsin-1 staining. EEA1 staining (right) shows a high degree of overlap with the FM1–43 staining in extrasynaptic areas (arrowheads). Scale bar, 18 μm.
Together our electrophysiological results indicate an active functional role for MII in evoked neurotransmitter release that is independent of general developmental defects, but the mechanistic basis for this role was not revealed. One possibility is a lower probability of a vesicle fusion with the presynaptic membrane in response to an action potential. It has been suggested that high membrane tension will favor secretion (Dai and Sheetz, 1995); however, there is little published evidence yet to support this hypothesis. Furthermore, it is unclear how decreased MII activity (i.e., decreased cortical tension) would specifically affect fusion induced by action potentials. Alternatively, acute inhibition or knock out of MII could decrease the strength of evoked release by reducing the number of vesicles available for fusion at presynaptic active zones. We hypothesized that if decreased vesicle trafficking (Peng et al., 2012) was combined with a defect in retrieval of new vesicles from the plasma membrane to compensate for those that were spent, then release could be compromised because the recycling pool of vesicles available for the RRP and release would be greatly diminished in size. Although there are no data available from previous studies to support a role for MII in synaptic vesicle retrieval, recent work indicates that some components of endocytosis are regulated by actin (Taylor et al., 2012), which motivated us to test for involvement of MII.
MIIB KO cells show abnormalities in synaptic vesicle retrieval/recycling pathways
As a first step in characterizing the synaptic vesicle recycling pathway in MIIB KO neurons, we used FM1–43, a lipophilic styryl dye that is internalized during CE, in combination with relatively intense stimulation (5 min K+ depolarization) (Betz and Bewick, 1992; Ryan et al., 1993; Cheung et al., 2010). Circuits containing either Ct or MIIB KO neurons (10–14 DIV) were subjected to K+ depolarization in the presence of FM1–43. We performed live imaging during the recovery phase. Circuits containing Ct neurons showed numerous bright puncta along interconnected neurites consistent with normal synaptic staining (Fig. 3B). In contrast, circuits containing MIIB KO neurons showed fewer puncta per length of neurite, and the puncta were less bright. After stimulating FM1–43 uptake, we induced release with a subsequent stimulation (2 min K+ depolarization) causing terminals to become destained (Fig. 3C). In both Ct and MIIB KO circuits, we measured the level of fluorescence in individual puncta before and after destaining. In both Ct and MIIB KO cells, destaining caused a significant decrease in fluorescence intensity to approximately the same levels indicating normal release (Fig. 3D). However, because the puncta in Ct circuits were brighter before destaining, the magnitude of the decrease was less in the MIIB KO neurons consistent with less total neurotransmitter release (decrease: Ct = 65%, MIIB KO = 23%). The difference in destaining underestimates the total differences in the amount of release because the MIIB KO circuits also had half the number of puncta per length of neurite (Ct = 1.4 ± 0.09 per 10 μm, MIIB KO = 0.7 ± 0.09 per 10 μm, N = 16, 8 fields from 3 circuits). Because the size of the RRP in glutamatergic hippocampal neurons may be approximated better by the release induced with intense stimulation such as K+ depolarization than by the release induced with action potential trains (Moulder and Mennerick, 2005), these results suggest that the size of the RRP may be smaller in the MIIB KO cells.
In the circuits containing MIIB KO neurons that were stained with FM1–43 by K+ depolarization for 5 min or longer (up to 10 min) some cells showed large bright spots that did not completely destain. (The magnitude of destaining was difficult to measure because most of the larger bright spots were saturated at settings required to detect the fainter synaptic puncta.) A subset of cultures containing circuits were fixed and stained for specific presynaptic proteins. FM1–43 live staining in Ct neurons frequently (87 ± 2%, N = 9 cells, 3 circuits) colocalized with antibody staining for synapsin-1, but only rarely with staining for the early EEA1 (Fig. 3E). In contrast, FM1–43 staining in MIIB KO neurons showed only partial overlap (40 ± 3%, N = 10 cells, 2 circuits) with synapsin-1 staining (Fig. 3E). Moreover, EEA1 colocalized with the large bright accumulations of FM1–43, which led us to classify them as endosomal intermediates in the vesicle recycling pathway. These enlarged FM1–43-positive structures in the MIIB KO cells also stained with antibodies to synaptobrevin, which is found to associate with both synaptic vesicles and endosomes (Haberman et al., 2012). Following K+ depolarization, the overlap of synaptobrevin with synapsin-1 staining in the MIIB KO circuits was reduced compared with Ct circuits (Ct = 84 ± 1.5%, MIIB KO = 54 ± 3%, N = 12 fields from 3 circuits each; Fig. 4A), similar to the overlap between FM1–43 and synapsin-1. Synaptobrevin staining in the MIIB KO cells showed a small but significant increase in the average size of puncta due to the enlarged extrasynaptic accumulations (Ct = 0.81 ± 0.08 μm, N = 60, MIIB KO = 1.0 ± 0.08 μm, N = 69, t test, p = 0.04). In addition we noticed that the majority of synapses at 10–14 DIV appeared to be on dendritic shafts and not on spines. This may be because spines become unstable and abnormal in shape when MII activity is decreased (Ryu et al., 2006; Rex et al., 2010). MIIB KO neurons with transgenic YFP expression (or stained for actin using rhodamine phalloidin) showed elongated filopodia-like structures instead of normal spines at 12–14 DIV (Fig. 4B). At 28 DIV, elongated spines were present, and presynaptic contacts were made along the spine shaft or at branch points (Fig. 4C). These results suggest that MIIB KO synapses have postsynaptic structural abnormalities that may lead to partial mismatch between presynaptic and postsynaptic specializations. Relatively strong depolarization also results in extrasynaptic accumulations of FM1–43 and synaptobrevin/EEA1-positive vacuoles, both of which are abnormally large and persistent, suggesting a defect in the extrasynaptic recycling pathways. This also contributes to the mismatch between presynaptic and postsynaptic specializations. Similar stimulation protocols have been shown to induce retrieval by both activity-dependent bulk endocytosis and CME (Cheung et al., 2010). Thus the extrasynaptic FM1–43 staining and a portion of the synaptic FM1–43 staining are likely to result from bulk endocytosis, which is thought to resupply the resting pool of synaptic vesicles.
Blebbistatin has a broad excitation spectrum and is highly phototoxic (Kolega, 2004) making it difficult to image uptake of FM1–43 and block MII activity simultaneously. In addition it is difficult to distinguish dye sequestered in synaptic vesicles from dye within endosomes. Therefore to be able to assess the relationship between MII, CE, and the recently recycled pool of synaptic vesicles during stimulation, we chose to monitor uptake using HRP in combination with thin section electron microscopy (EM). Circuits of Ct or MIIB KO neurons and circuits of Ct neurons treated with blebbistatin (30 min) were depolarized with high K+ for 5 min in the presence of HRP. These cultures were then fixed and processed for the HRP reaction and for imaging with EM.
To determine whether synaptic vesicle retrieval was defective, thin sections of synaptic terminals containing postsynaptic densities, active zones, and synaptic vesicles were used as an index to analyze the distribution and frequency of HRP-positive synaptic vesicles per synapse (Fig. 5A–D). There was no significant difference in the number of synaptic vesicles per synapse in Ct cells compared with MIIB KO cells (Ct = 91 ± 12.5 vs MIIB KO = 83 ± 11, SEM, N = 14, t test, p = 0.62). The percentage of HRP-positive vesicles in the Ct cells was similar to that observed after photoconversion of FM1–43 taken up during field stimulation or K+ depolarization (Harata et al., 2001; Fig. 5A). Only 6% of the total synapses lacked HRP-positive vesicles. However, the relative frequency of HRP-positive vesicles was dramatically lower in the MIIB KO synapses (Fig. 5B,D), and 14% were devoid of HRP-positive vesicles. Similarly, blebbistatin-treated Ct neurons showed no difference in total vesicles per synapse but had a dramatic decrease in the frequency of HRP-positive synaptic vesicles (Fig. 5C,D). The percentage of synapses devoid of HRP-positive vesicles was increased to 30%. The decreases in the percentage of HRP-positive vesicles were substantial for both the MIIB KO cells and the blebbistatin-treated cells, but the percentages were still greater than that observed without stimulation (no K+ depolarization; 0.6–0.8 HRP-positive vesicles/synapse) or when external calcium was buffered with EGTA to low levels (200 nm) before K+ depolarization (0.4–0.6 HRP-positive vesicles/synapse). This suggests that CE required to resupply the recently recycled pool of vesicles was greatly compromised but was not blocked when MIIB was absent or MII was inhibited, consistent with the observations using FM1–43.
Figure 5.

MIIB KO and blebbistatin-treated neurons show decreased percentages of HRP-positive vesicles after loading by K+ depolarization (5 min). A, EM of a thin section through a synapse from a Ct cell that was induced to take up HRP by K+ depolarization. HRP-positive vesicles (arrowheads) are numerous. B, EM of a thin section through a synapse from a MIIB KO cell that was induced to take up HRP by K+ depolarization. HRP-positive vesicles (arrowheads) are scarce. C, EM of a thin section through a synapse from a blebbistatin-treated (50 μm 30 min) Ct cell. HRP-positive vesicles (arrowheads) are rare. Scale bar, 120 nm. D, Comparison of the frequency of HRP-positive vesicles relative to the total vesicle population at each synapse. Both MIIB KO cells and blebbistatin-treated Ct cells show greatly reduced percentages of HRP-positive vesicles. The difference was significant. (ANOVA, p < 0.001; Ct, N = 14; MIIB KO, N = 14; Ct + blebbistatin, N = 12). Error bars indicate SEM.
In thin sections cut parallel to the glass substrate, we also observed HRP-positive endosomal-like structures in presynaptic terminals of Ct, MIIB KO, or blebbistatin-treated cells. The synaptic endosome-like structures did not differ significantly in size (longest dimension, Ct = 135 ± 12 nm, MIIB KO = 145 ± 9 nm, blebbistatin treated = 153 ± 22 nm, ANOVA, p = 0.7; N = 38, 59, and 34 endosomes in 50, 60, and 50 synapses, respectively) suggesting that activity-dependent bulk endocytosis at synapses was not affected and likely contributed to the synaptic FM1–43 staining observed in Ct and MIIB KO neurons (Cheung et al., 2010). Consistent with this possibility, without depolarization or if calcium was buffered to low levels before K+ depolarization, these HRP-positive structures were absent, indicating that they accumulated in response to stimulation. In addition to the synaptic endosomal-like HRP-positive structures, larger endosomal-like structures (253 ± 69 nm, N = 16) were occasionally observed in extrasynaptic regions of axons (Fig. 6A,B) in MIIB KO and blebbistatin-treated cells. These HRP-positive structures were also absent in Ct cells and in MIIB KO or blebbistatin-treated cells that did not receive K+ depolarization. Thus, consistent with the observations using FM1–43, stimulation also induced abnormal extrasynaptic accumulations of HRP in an endosomal-like compartment when MII was inhibited (possibly through an activity-dependent bulk endocytosis pathway).
Figure 6.

MIIB KO and blebbistatin-treated cells show abnormal extrasynaptic accumulations of HRP in endosome-like vacuoles. A, Examples from MIIB KO cells of HRP-positive vacuoles (top, arrows). Scale bar, 100 nm. B, The same comparison as in A for Ct cells treated with blebbistatin. Scale bar, 130 nm.
In MII-KO or blebbistatin-treated Ct cells, the total number of vesicles is unchanged compared with untreated Ct cells indicating that vesicle depletion is not responsible for the decrease in release. The close coupling of release and retrieval makes it difficult to determine whether the primary defect lies with one process or the other. For example, one possibility is that release occurs less frequently and results in a corresponding lower level of compensatory retrieval. Alternatively, the decrease in number of released vesicles could be a consequence of fewer fusion-competent vesicles available from much smaller recycling/reserve pools. To distinguish between these possibilities, we performed additional experiments to monitor recycling after acute inactivation of MII using blebbistatin. The control received an initial K+ depolarization in the presence of HRP to induce uptake (loading). The cultures were rinsed free of HRP and then incubated for 30 min in media containing tetrodotoxin (TTX) to prevent firing of spontaneous action potentials. The cells were fixed for EM without a second depolarization (Fig. 7A). The second set was treated the same as the first, but also received a second K+ depolarization (2 min) after 30 min to induce release (unloading) of the recently retrieved pool of HRP-positive vesicles before fixation (Fig. 7B). Finally, after inducing HRP uptake using K+ depolarization, a third set of cultures was coincubated with TTX and blebbistatin for 30 min. A second K+ depolarization in the presence of blebbistatin was then performed to determine whether inhibition of MII activity prevented release from the recently retrieved vesicle pool (Fig. 7C). Inhibition of MII with blebbistatin had no significant effect on the degree of stimulation-induced release (unloading) of HRP-positive vesicles (Fig. 7D) suggesting that inhibition of MII does not directly alter stimulation-induced neurotransmitter release. Although this seems at odds with a previous report that acute MII inhibition using blebbistatin affects directed movements of synaptic vesicles (Peng et al., 2012), and also with our observation that recently recycled (HRP-positive) vesicles are more dispersed (see below), K+ depolarization is a relatively strong stimulation and so may overcome any deficits associated with movement and position. A subset of the HRP unloaded terminals in both TTX and TTX + blebbistatin neurons (TTX = 61%, TTX + blebbistatin = 56%) showed residual HRP-positive endosome-like structures (reduced in size compared with cultures receiving a single depolarization; TTX = 80 ± 2 nm, TTX + blebbistatin = 99 ± 7 nm). In addition, these terminals almost always also had HRP-positive synaptic vesicles (96% in TTX and 97% in TTX + blebbistatin) suggesting that at least some of these vesicles may bud from HRP-positive endosomes and are retained as part of the reserve pool of vesicles (Cheung et al., 2010).
Figure 7.

Blebbistatin treatment does not inhibit release of HRP-positive vesicles. A, An example of a synapse from a Ct culture loaded with HRP using a 5 min K+ depolarization and then incubated with TTX for 30 min before fixation (no second depolarization). Ninety-six percent of synapses had HRP-positive synaptic vesicles. B, An example of a synapse from a Ct culture loaded with HRP using a 5 min K+ depolarization and then incubated with TTX for 30 min before a second K+ depolarization (2 min) and fixation. Seventy-nine percent of synapses had HRP-positive vesicles. C, An example of a synapse from a Ct culture loaded with HRP using a 5 min K+ depolarization then incubated with TTX + blebbistatin (50 μm) for 30 min before a second depolarization (2 min) in the presence of blebbistatin and then fixation. Sixty-six percent of synapses had HRP-positive synaptic vesicles. Scale bar, 130 nm. D, Quantitative analysis of synaptic terminals treated as indicated in A–C. Blebbistatin does not prevent unloading of HRP-positive vesicles. Difference between groups was significant, ANOVA, p < 0.0001; Ct (HRP load), N = 26 synapses from two circuits; 30 min TTX then unload, N = 44 synapses from three circuits; Blebbistatin treated (30 min TTX + Bleb and then unload) N = 46 synapses from 3 circuits. * Differences were significant (ANOVA, p < 0.0001). Difference between TTX and TTX + Bleb unload was not significant, t test, p = 0.8. Error bars indicate SEM.
There is some evidence suggesting that a recycling pool of vesicles recently retrieved by CME is preferentially recruited for exocytosis and that directed trafficking spatially segregates recycling vesicles from the resting (reluctant) pool (Cheung et al., 2010; Alabi and Tsien, 2012; Marra et al., 2012; Peng et al., 2012). Therefore we measured the distance of HRP-positive vesicles from the active zone in the different samples. Although the HRP-positive vesicles in the Ct were generally closer to the active zone compared with the population of non-HRP-positive vesicles, this difference was not significant (Fig. 8A). However, when comparing the distributions of HRP-positive vesicles in untreated Ct, MIIB KO, and blebbistatin-treated Ct cells, there were significant differences in the distances to active zones. This result indicates that loss of MII function is associated with a greater dispersal of recently retrieved (HRP-positive) vesicles within presynaptic terminals.
Figure 8.
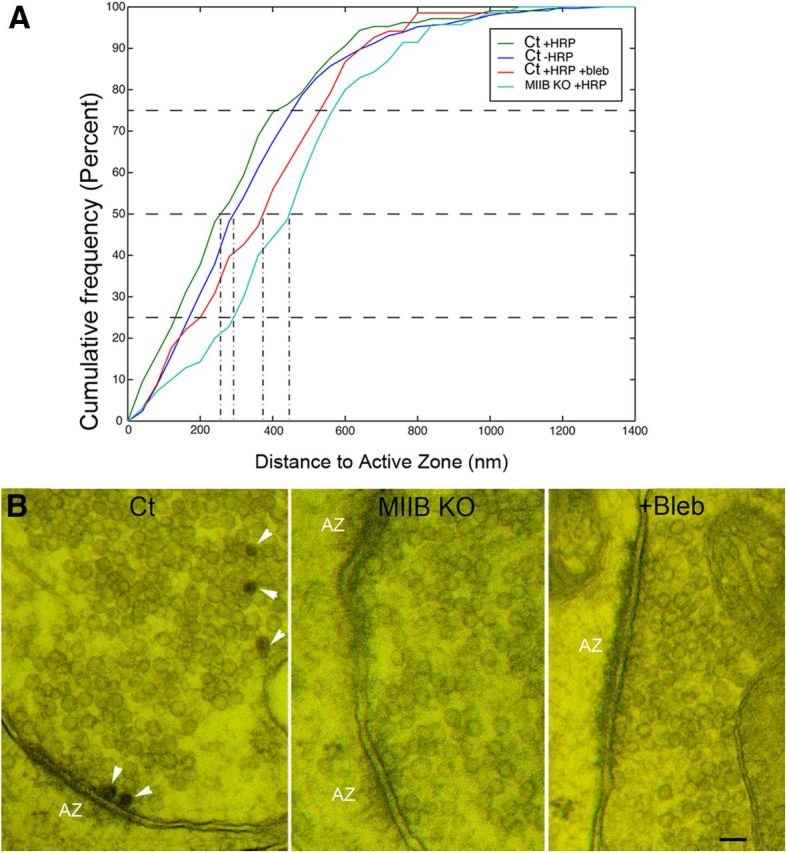
Comparison of synaptic vesicle distances to the active zone (AZ) and physical docking. A, In Ct cells the HRP-positive vesicles appear to distribute slightly closer to the AZ compared with unlabeled vesicles, but the difference was not significant (N = 14 synapses). In contrast, HRP-positive vesicles of MIIB KO and blebbistatin-treated cells appear to distribute farther from the active zone (N = 14, 12). The differences (compared with HRP-positive Ct vesicles) were significant (Kolmogorov–Smirnov test, p < 0.0001 and p = 0.02, respectively). B, Anaglyphs showing physically docked AZs. Ct cells contain HRP-positive vesicles (arrowheads). The degree of 3D depth visible in the anaglyphs varies with section thickness. Scale bar, 80 nm.
Release probability scales with the size of the active zone and the number of docked vesicles (Schikorski and Stevens, 1997; Holderith et al., 2012). To determine whether the decrease in synaptic transmission could result from defects in the active zone structure or the ability of vesicles to dock before depolarization, we measured the length of active zones and the number of physically docked vesicles. The average active zone length was ∼30% greater in MIIB KO cells than in untreated Ct cells (or in blebbistatin-treated Ct cells) (Ct = 286 ± 26 nm vs MIIB KO = 383 ± 36 nm, N-40, t test, p = 0.02), but the number of physically “docked” synaptic vesicles per unit length of active zone was the same in all cases. We defined docked vesicles as vesicles that either showed no detectable separation from the plasma membrane or were attached to the plasma membrane via short filament-like structures (Schikorski and Stevens, 1997; Holderith et al., 2012). In a subset of specimens we took images at different tilt angles to create anaglyphs. By viewing the 3D images we confirmed that the vesicles that appeared to be in contact with the plasma membrane in a single 2D image were actually physically contacting (directly or via filaments) the plasma membrane (Fig. 8B). The total number of docked synaptic vesicles per synapse was the same in Ct and Ct + blebbistatin cells, but the MIIB KO cells showed a larger number of docked vesicles per synapse because of the increased length of active zones. This difference may partially compensate for the decreased synaptic density in MIIB KO cultures. In any case, a defect in physical vesicle docking does not appear to be the cause of the decrease in release.
Since HRP-positive vesicles in cultures fixed immediately after the initial depolarization represent the recently recycled population and may have a higher probability of fusing with the plasma membrane in response to subsequent stimulation (Marra et al., 2012), an important parameter for predicting release probability may be the percentage of HRP-positive vesicles that are physically docked. Therefore we calculated the percentage of HRP-positive docked vesicles per synapse. This value scaled with the frequency of HRP-positive vesicles per synapse [Ct = 13 ± 2% (N = 40), MIIB KO = 2.7 ± 1% (N = 50), blebbistatin treated = 2.6 ± 1% (N = 40)] indicating that when MII is inhibited, the number of recently recycled vesicles that appear to be physically docked drops by a factor of 5.
It may be that the number of docked vesicles present at active zones in MIIB KO or blebbistatin-treated cells is nearly normal (regardless of being recently recycled) because synaptic vesicles or their proteins are not efficiently removed (or undocked) after an initial release of neurotransmitter by either a full fusion or a kiss-and-run mechanism. In this “traffic jam” scenario the lack of vacant sites prevents new vesicles from docking, which in turn reduces subsequent release (Neher, 2010). Because of these ambiguities we pursued additional experiments to clarify the role of MII in CE. We focused on CME because it represents the primary pathway for vesicle retrieval that supplies the RRP in hippocampal synapses (Granseth et al., 2006; Cheung et al., 2010).
MII regulates CME in neurons
The EM data indicate that loss of MII function compromises synaptic vesicle retrieval leading to a large decrease in the number of vesicles in the recently recycled pool and suggest a possible defect in CME. As a first step toward characterizing the dependence of CME on MII function we used EM to look for potential abnormalities (Fig. 9A,B). Clathrin-coated pits (CCPs) are rare in EM sections of presynaptic terminals in central synapses (Fig. 10C). Even at vertebrate neuromuscular junctions, prolonged stimulations (15 min), 4-AP treatment, or cooling are required to “catch” invaginating CCPs during stimulation (Heuser and Reese, 1973, 1981; Teng and Wilkinson, 2000). A survey of 114 synaptic terminals fixed following K+ depolarization (in the presence of HRP) showed only two examples (1.8%). We found a significant general increase in presynaptic-coated pit frequency with myosin II inhibition, but in all cases stimulation for 5 min with high K+ had no significant effect on the frequency (Fig. 10C). We also observed greater numbers of CCPs in all parts of neurons (i.e., cell body, dendrites, axons, and postsynaptic terminals). For instance, in both MIIB KO and Ct cells treated with blebbistatin we observed multiple clusters of CCPs in sections taken close to the substrate (Fig. 9A,B). The density reached 12 coated pits per 5 μm length of neurite. The maximum density observed in Ct neurons was two coated pits per 5 μm. We defined the clathrin structures as coated pits (as opposed to coated vesicles) based on three criteria: (1) their diameter was relatively large in sections taken close to the substrate (larger than is typical for coated vesicles), (2) in favorable views we found examples of connections with the plasma membrane, and (3) the lumen was devoid of HRP reaction products. This finding suggests that constitutive CME may be abnormal due to slowed CCP progression and budding.
Figure 9.

MIIB KO and blebbistatin-treated neurons show defects in CME. A, MIIB KO cells show numerous coated pits (arrowheads) following depolarization. Scale bars: 65, 65, and 130 nm, top to bottom, respectively. B, Blebbistatin treatment also causes increased numbers of coated pits. Tannic acid treatment was used to enhance coated pit staining. Scale bars: 90, 200, and 110 nm, top to bottom, respectively. C, Transferrin uptake is defective when MII activity is inhibited or decreased. Comparison of fluorescent transferrin uptake in Ct and MIIB KO hippocampal neurons. The Ct cells (left) show numerous fluorescent (Alexa 546) transferrin spots throughout the cell body and dendrites. The MIIB KO cells show sparsely distributed bright spots in the cell body. Few spots are seen in dendrites. Scale bar, 12 μm. D, Quantitation of the transferrin uptake shows the density of fluorescent transferrin spots is reduced in MIIB KO dendrites. The difference was significant (t test, N = 5 cells each from 3 cultures, p < 0.001). Error bars indicate SEM.
Figure 10.

The effect of stimulation on the frequency of presynaptic coated pits per synapse. A, An example of synapse for a culture that was treated with blebbistatin (50 μm) for a total of 10 min. Incubation with HRP was for 90 s without K+ stimulation. After a 30 s rinse with medium containing blebbistatin (to remove HRP) cells were fixed. B, Examples of synapses (two examples on right shown as anaglyphs) from cultures that were treated with blebbistatin for 10 min. Incubation with HRP was for 90 s during K+ depolarization. The 30 s rinse before fixation also contained blebbistatin and high K+. Coated pits (arrowheads) were frequently found in the presynaptic terminals. C, Comparison of the frequency of CCPs in presynaptic terminals of Ct (±blebbistatin) and MIIB KO cells unstimulated or following stimulation (K+ depolarization for 5 min). The number of synapses surveyed for each condition is indicated on the graph bars. The differences between the eight different categories are not significant (χ2 analysis, p = 0.13). The differences within groups are also not significant (Z-test). However, at t test comparing all three control values to all three MIIB KO values is significant (p = 0.007). In addition, a t test comparing controls to Ct + Bleb (no stimulation and 5 min stimulation) is also significant (p = 0.008). For low Ca2+, EGTA was used to buffer calcium to 200 nm. D, Comparison of CCPs in presynaptic terminals following a relatively short blebbistatin treatment (10 min) and a shorter K+ depolarization (2 min). Stimulation produced a significant (Z-test, *p = 0.028) increase in the frequency of CCPs. Scale bar, 100 nm.
To test directly for abnormal constitutive CME in the cultured hippocampal MIIB KO neurons we used receptor-mediated uptake of Alexa 546 transferrin. Neurons were starved for 30 min in the absence of B27 supplement and then incubated with complete media containing Alexa 546 transferrin for different time periods. Ct neurons had numerous fluorescent puncta in the cell body and along the neurites within 30 min (Fig. 9C). In contrast, MIIB KO neurons had some large fluorescent puncta in the cell body but few puncta along neurites. Counts of internalized fluorescent transferrin puncta per 10 μm neurite length (Fig. 9D) showed an ∼7-fold decrease in the transferrin uptake in the MIIB KO neurites indicating a defect in receptor-dependent CME.
CE is understood to occur primarily through the CME pathway, but to differ from constitutive CME in time course and calcium sensitivity (McMahon and Boucrot, 2011). We also observed a relatively rapid decrease in EPSC amplitude in response to acute MII inhibition (time constant = 3.5 min; Fig. 1B), whereas inhibition of receptor-mediated transferrin uptake by blebbistatin required 15 min to reach 50% of the maximum decrease in fibroblasts (data not shown). To determine whether we could use the slowing of CME progression to detect changes in the numbers of CCPs attributable to compensatory CME, we performed an experiment using acute inhibition with blebbistatin for a relatively short time (10 min) combined with a shorter K+ depolarization (2 min). In addition the cells were fixed while depolarized (Fig. 10A,B). Under these conditions, we observed a significant increase in the frequency of presynaptic CCPs (Fig. 10D). The short blebbistatin treatment also caused a small increase in the frequency of CCPs suggesting that constitutive CME is sensitive to MII inhibition. The large increase in frequency of CCPs following stimulation is consistent with the idea that inhibition of MII has a significant effect on compensatory CME. Additional experiments are required to determine the relative magnitude of the effects on compensatory and constitutive CME.
Discussion
These results show that the strength of synaptic transmission in cultured hippocampal neurons strongly depends on MII activity. If MII is inactivated using blebbistatin or MIIB is genetically ablated, then evoked postsynaptic responses are greatly weakened. In contrast, spontaneous release is largely unaffected. Knock out of MIIB does decrease the amplitude of spontaneous postsynaptic events by ∼50%, but the decrease is relatively small compared with the overall reduction observed for evoked release. The decrease in amplitude of spontaneous release events may result from developmental defects in the postsynaptic membrane. This possibility is supported by our recordings of evoked release from circuits containing a mixture of MIIB KO and Ct cells. Previous studies have described a postsynaptic role for MII in regulating synaptic strength (Ryu et al., 2006; Rex et al., 2010) and our results support this interpretation. We attribute most of the decrease in evoked synaptic strength, however, to a presynaptic defect that reduces the release of neurotransmitter in response to an action potential without affecting spontaneous release. This finding is surprising given the uncertainty about whether or not there is a presynaptic requirement for actin (Sankaranarayanan et al., 2003; Bourne et al., 2006; Marra et al., 2012). Thus, our results provide new evidence indicating that actin and MII work together presynaptically to support synaptic vesicle recycling.
Synaptic vesicle retrieval and its relationship to the RRP size
The main focus of this study was to understand how presynaptic MII may contribute to the regulation of synaptic strength through its effect on the following: (1) the probability of vesicle retrieval by CME, (2) the sizes of the recycling and RRPs, and (3) the probability of a vesicle fusing with the presynaptic membrane in response to an action potential (Ariel and Ryan, 2012). The reductions in evoked EPSC amplitude and increased frequency of evoked release failures that accompanied the loss of MII function were initially difficult to reconcile with our morphological results showing no detectable decrease in the total number of synaptic vesicles per synapse, number of physically docked vesicles, or the size of the active zone. While we cannot rule out the possibility of undetected defects in physical docking or active zone proteins, the proportional destaining of FM1–43 in MIIB KO cells, and the ability of HRP-positive synaptic vesicles to be unloaded even after MII inhibition using blebbistatin, both argue against a large defect in release.
Together, these results suggest that MII is not directly required for release but affects evoked release indirectly by a requirement for MII in synaptic vesicle retrieval pathways. In the absence of normal retrieval, the recycling pool is smaller and the efficiency of resupplying the RRP with fusion-competent vesicles after evoked release may be decreased. This could explain why the number of morphologically docked vesicles observed by EM does not appear to change with MII inhibition. If spontaneous release does not involve the recycling pool, then it will be unaffected. The degree to which the recently recycled pool can efficiently resupply the RRP may depend on both vesicle trafficking and frequency of transitions between the resting pool and the recycling pool (Kim and Ryan, 2010; Peng et al., 2012). Abnormal trafficking or defects in the conversion from the resting pool to the recycling pool could further reduce the probability that fusion-competent vesicles resupply the RRP. The greater dispersal of HRP-positive vesicles observed in MIIB KO cells or following inhibition of MII with blebbistatin is consistent with a defect in trafficking. This possibility is supported by recent work showing that trafficking is MII dependent (Peng et al., 2012). While there are no data to support a role for MII in transition of vesicles between the resting pool and recently recycled pool, it is interesting to note that the key component controlling this transition, CDK5, is known to phosphorylate multiple presynaptic proteins including both dynamin-1 and the MIIB heavy chain (Tan et al., 2003; Jämsä et al., 2009). Defects in retrieval of docked vesicles that release neurotransmitter via a kiss-and-run mechanism may also prevent replenishment of neurotransmitter-loaded fusion-competent vesicles in the RRP if full collapse of vesicles does not occur. Despite these many possibilities, the simplest interpretation of the data is that inhibition of MII reduces the probability of vesicle retrieval following stimulation, and the corresponding decrease in size of the recycling pool results in a substantially lower probability of release.
MII regulates multiple modes of synaptic vesicle retrieval
Loss of MII function causes defects in synaptic vesicle retrieval in response to stimulation. Although abnormal accumulation of FM1–43 or HRP in extrasynaptic large vacuole-like structures following high-intensity stimulation is detectable in MIIB KO cells, activity-dependent bulk endocytosis involving an endosomal intermediates at synaptic sites (Cheung et al., 2010), appears to be normal or only minimally affected in the MIIB KO cells or by acute inhibition of MII using blebbistatin. The large deficit in HRP-positive vesicles in the MIIB KO or blebbistatin-treated cells following stimulation is consistent with a defect in CME, the main retrieval pathway at hippocampal synapses (Granseth et al., 2006). A defect in CME is also supported by the decreased transferrin uptake and the increased frequency of coated pits. While we cannot rule out indirect defects in calcium signaling affecting endocytosis or recycling, the observation that activity-dependent bulk endocytosis at synapses appears to be normal argues against a large change in calcium signaling. Activity-dependent bulk endocytosis is calcium dependent, similar to other CE pathways (Cheung and Cousin, 2013).
In addition to CME, the kiss-and-run retrieval mechanism has also been shown to operate at these synapses (Alabi and Tsien, 2013). We do not have data that directly indicates a defect in this pathway; however, this possibility cannot be excluded. For example, if clearance of vesicle release sites requires MII, then loss of MII function may lead to vesicle “traffic jams” that hinder docking of new vesicles required for release (Hosoi et al., 2009). In another example, recent studies indicate that the double knock out of dynamin (1 and 3), a core molecular component in CME, also affects synaptic release (Raimondi et al., 2011; Lou et al., 2012), but the decrease in release is less severe than that observed in the MIIB KO. In both examples, if endocytosis is compromised then a decrease in the efficacy of release would have the secondary effect of preventing or reducing the depletion of synaptic vesicles, consistent with results from both studies.
Based on our results we propose a model suggesting that MII participates in vesicle retrieval and trafficking. It seems likely that the main pathway affected by the loss of MII is CME (Fig. 11, #2). During CME, MII-dependent tension may aid the curvature progression of coated pits leading to rapid internalization. During bulk endocytosis, membrane is internalized to form large vacuolar structures. MII activity may be required to prevent abnormally large vacuolar structures from forming during bulk endocytosis and could contribute to normal rates of budding of vesicles from synaptic endosomal intermediates (Fig. 11,#1). Recently it has been shown that MII binds to Rab 6 to aid in budding from the Golgi network (Miserey-Lenkei et al., 2010) (#2) MII may interact directly with the Rab 6-positive synaptic vesicles and aid in direct retrieval of those vesicles from the plasma membrane through a kiss-and-run pathway (Fig. 11, #3). If MII activity regulates the rate of vesicle retrieval by affecting CME but also has effects on additional pathways, then inhibiting MII activity would have a profound effect on the strength of synaptic transmission, consistent with our results.
Figure 11.

Proposed model for the presynaptic function of MII and its potential mechanistic role in various modes of synaptic vesicle retrieval and recycling (modified from Kavalali, 2006). 1, Normal rates of budding of vesicles from the endosomal intermediate/cisternae may be MII dependent. 2, MII activity is essential for clathrin-mediated CE at the synapses. 3, MII may also be involved in clathrin-independent vesicle retrieval by kiss-and-run pathway through its interaction partners like Rab 6. In addition, the directional movement of reserve/recycling pool vesicles to the active zone may also be MII dependent (Peng et al., 2012). Illustration by Marcy Hartstein.
The requirement for MII activity in retrieval may explain certain findings in recent studies of CME. While the core molecular components of CME have been identified and, when reconstituted, are sufficient to generate coated vesicles (Dannhauser and Ungewickell, 2012), neurons from knock-out mice lacking dynamin (dynamin 1 or 1 and 3) still had sustained synaptic transmission and synaptic vesicle formation (Ferguson et al., 2007; Raimondi et al., 2011). This unexpected finding led us to suspect that dynamin-independent mechanisms may play a role in the synaptic vesicle recycling pathway. Emerging evidence points to possible mechanisms involving BAR proteins (Ferguson et al., 2009) in curvature generation and the epsin family of proteins in membrane deformation or fission (Boucrot et al., 2012). Thus dynamin-mediated coated vesicle budding may not be a one-step process as has been assumed from reconstitution studies. It may be that in cells, cortical and membrane tension opposes normal progression of CME and scission. In this case, additional molecules would work cooperatively with dynamin and other curvature-generating proteins to bring about coated vesicle budding. MII may be a key component of this regulatory complex in the respect that it could modify tension at individual sites of coated pit formation. MII may be especially important for CE at synapses because of the requirement for relatively rapid and variable responses during changing levels of synaptic activity. Thus through this ability to regulate the rate of vesicle membrane retrieval MII may also couple endocytosis to exocytosis contributing to the regulation of synaptic strength (Wilkinson and Lin, 2004; Granseth and Lagnado, 2008).
Footnotes
This work was supported by grants to P.C.B. from the National Institutes of Health (NIH; R21 MH081260, R21EB9776) and in part by the Bakewell Neuroimaging Core supported by the Bakewell Family Foundation and the NIH Neuroscience Blueprint Interdisciplinary Center Core Grant P30 (NS057105) to Washington University. Support was also provided by grants to J. E.H. (NS30888) from NIH. We thank Robyn Roth and Dr. John E. Heuser for their help with the electron microscopy and Dr. Robert Wilkinson and Dr. Mike Nonet for comments on this manuscript.
The authors declare no competing financial interests.
References
- Alabi AA, Tsien RW. Synaptic vesicle pools and dynamics. Cold Spring Harb Perspect Biol. 2012;4:a013680. doi: 10.1101/cshperspect.a013680. [DOI] [PMC free article] [PubMed] [Google Scholar]
- Alabi AA, Tsien RW. Perspectives on kiss-and-run: role in exocytosis, endocytosis, and neurotransmission. Annu Rev Physiol. 2013;75:393–422. doi: 10.1146/annurev-physiol-020911-153305. [DOI] [PubMed] [Google Scholar]
- Ariel P, Ryan TA. New insights into molecular players involved in neurotransmitter release. Physiology. 2012;27:15–24. doi: 10.1152/physiol.00035.2011. [DOI] [PMC free article] [PubMed] [Google Scholar]
- Betz WJ, Bewick GS. Optical analysis of synaptic vesicle recycling at the frog neuromuscular junction. Science. 1992;255:200–203. doi: 10.1126/science.1553547. [DOI] [PubMed] [Google Scholar]
- Bliss TV, Collingridge GL. A synaptic model of memory: long-term potentiation in the hippocampus. Nature. 1993;361:31–39. doi: 10.1038/361031a0. [DOI] [PubMed] [Google Scholar]
- Boucrot E, Pick A, Çamdere G, Liska N, Evergren E, McMahon HT, Kozlov MM. Membrane fission is promoted by insertion of amphipathic helices and is restricted by crescent BAR domains. Cell. 2012;149:124–136. doi: 10.1016/j.cell.2012.01.047. [DOI] [PMC free article] [PubMed] [Google Scholar]
- Boulant S, Kural C, Zeeh JC, Ubelmann F, Kirchhausen T. Actin dynamics counteract membrane tension during clathrin-mediated endocytosis. Nat Cell Biol. 2011;13:1124–1131. doi: 10.1038/ncb2307. [DOI] [PMC free article] [PubMed] [Google Scholar]
- Bourne J, Morgan JR, Pieribone VA. Actin polymerization regulates clathrin coat maturation during early stages of synaptic vesicle recycling at lamprey synapses. J Comp Neurol. 2006;497:600–609. doi: 10.1002/cne.21006. [DOI] [PubMed] [Google Scholar]
- Bridgman PC, Dave S, Asnes CF, Tullio AN, Adelstein RS. Myosin IIB is required for growth cone motility. J Neurosci. 2001;21:6159–6169. doi: 10.1523/JNEUROSCI.21-16-06159.2001. [DOI] [PMC free article] [PubMed] [Google Scholar]
- Cheung G, Cousin MA. Synaptic vesicle generation from activity-dependent bulk endosomes requires calcium and calcineurin. J Neurosci. 2013;33:3370–3379. doi: 10.1523/JNEUROSCI.4697-12.2013. [DOI] [PMC free article] [PubMed] [Google Scholar]
- Cheung G, Jupp OJ, Cousin MA. Activity-dependent bulk endocytosis and clathrin-dependent endocytosis replenish specific synaptic vesicle pools in central nerve terminals. J Neurosci. 2010;30:8151–8161. doi: 10.1523/JNEUROSCI.0293-10.2010. [DOI] [PMC free article] [PubMed] [Google Scholar]
- Dai J, Sheetz MP. Regulation of endocytosis, exocytosis, and shape by membrane tension. Cold Spring Harb Symp Quant Biol. 1995;60:567–571. doi: 10.1101/SQB.1995.060.01.060. [DOI] [PubMed] [Google Scholar]
- Dannhauser PN, Ungewickell EJ. Reconstitution of clathrin-coated bud and vesicle formation with minimal components. Nat Cell Biol. 2012;14:634–639. doi: 10.1038/ncb2478. [DOI] [PubMed] [Google Scholar]
- Feng G, Mellor RH, Bernstein M, Keller-Peck C, Nguyen QT, Wallace M, Nerbonne JM, Lichtman JW, Sanes JR. Imaging neuronal subsets in transgenic mice expressing multiple spectral variants of GFP. Neuron. 2000;28:41–51. doi: 10.1016/S0896-6273(00)00084-2. [DOI] [PubMed] [Google Scholar]
- Ferguson SM, Brasnjo G, Hayashi M, Wölfel M, Collesi C, Giovedi S, Raimondi A, Gong LW, Ariel P, Paradise S, O'toole E, Flavell R, Cremona O, Miesenböck G, Ryan TA, De Camilli P. A selective activity-dependent requirement for dynamin 1 in synaptic vesicle endocytosis. Science. 2007;316:570–574. doi: 10.1126/science.1140621. [DOI] [PubMed] [Google Scholar]
- Ferguson SM, Raimondi A, Paradise S, Shen H, Mesaki K, Ferguson A, Destaing O, Ko G, Takasaki J, Cremona O, O'Toole E, De Camilli P. Coordinated actions of actin and BAR proteins upstream of dynamin at endocytic clathrin-coated pits. Dev Cell. 2009;17:811–822. doi: 10.1016/j.devcel.2009.11.005. [DOI] [PMC free article] [PubMed] [Google Scholar]
- Finley MF, Kulkarni N, Huettner JE. Synapse formation and establishment of neuronal polarity by P19 embryonic carcinoma cells and embryonic stem cells. J Neurosci. 1996;16:1056–1065. doi: 10.1523/JNEUROSCI.16-03-01056.1996. [DOI] [PMC free article] [PubMed] [Google Scholar]
- Goslin K, Asmussen H, Banker G. Rat hippocampal neurons in low-density culture. In: Banker G, Goslin K., editors. Culturing nerve cells. Cambridge, MA: MIT; 1998. pp. 339–370. [Google Scholar]
- Granseth B, Lagnado L. The role of endocytosis in regulating the strength of hippocampal synapses. J Physiol. 2008;586:5969–5982. doi: 10.1113/jphysiol.2008.159715. [DOI] [PMC free article] [PubMed] [Google Scholar]
- Granseth B, Odermatt B, Royle SJ, Lagnado L. Clathrin-mediated endocytosis is the dominant mechanism of vesicle retrieval at hippocampal synapses. Neuron. 2006;51:773–786. doi: 10.1016/j.neuron.2006.08.029. [DOI] [PubMed] [Google Scholar]
- Haberman A, Williamson WR, Epstein D, Wang D, Rina S, Meinertzhagen IA, Hiesinger PR. The synaptic vesicle SNARE neuronal Synaptobrevin promotes endolysosomal degradation and prevents neurodegeneration. J Cell Biol. 2012;196:261–276. doi: 10.1083/jcb.201108088. [DOI] [PMC free article] [PubMed] [Google Scholar]
- Harata N, Ryan TA, Smith SJ, Buchanan J, Tsien RW. Visualizing recycling synaptic vesicles in hippocampal neurons by FM 1–43 photoconversion. Proc Natl Acad Sci U S A. 2001;98:12748–12753. doi: 10.1073/pnas.171442798. [DOI] [PMC free article] [PubMed] [Google Scholar]
- Heidelberger R, Zhou ZY, Matthews G. Multiple components of membrane retrieval in synaptic terminals revealed by changes in hydrostatic pressure. J Neurophysiol. 2002;88:2509–2517. doi: 10.1152/jn.00267.2002. [DOI] [PubMed] [Google Scholar]
- Heuser JE, Reese TS. Evidence for recycling of synaptic vesicle membrane during transmitter release at the frog neuromuscular junction. J Cell Biol. 1973;57:315–344. doi: 10.1083/jcb.57.2.315. [DOI] [PMC free article] [PubMed] [Google Scholar]
- Heuser JE, Reese TS. Structural changes after transmitter release at the frog neuromuscular junction. J Cell Biol. 1981;88:564–580. doi: 10.1083/jcb.88.3.564. [DOI] [PMC free article] [PubMed] [Google Scholar]
- Holderith N, Lorincz A, Katona G, Rózsa B, Kulik A, Watanabe M, Nusser Z. Release probability of hippocampal glutamatergic terminals scales with the size of the active zone. Nat Neurosci. 2012;15:988–997. doi: 10.1038/nn.3137. [DOI] [PMC free article] [PubMed] [Google Scholar]
- Hosoi N, Holt M, Sakaba T. Calcium dependence of exo- and endocytotic coupling at a glutamatergic synapse. Neuron. 2009;63:216–229. doi: 10.1016/j.neuron.2009.06.010. [DOI] [PubMed] [Google Scholar]
- Jämsä A, Agerman K, Radesäter AC, Ottervald J, Malmström J, Hiller G, Liu G, Vasänge M. Identification of non-muscle myosin heavy chain as a substrate for Cdk5 and tool for drug screening. J Biomed Sci. 2009;16:55. doi: 10.1186/1423-0127-16-55. [DOI] [PMC free article] [PubMed] [Google Scholar]
- Kavalali ET. Synaptic vesicle reuse and its implications. Neuroscientist. 2006;12:57–66. doi: 10.1177/1073858405281852. [DOI] [PubMed] [Google Scholar]
- Kim SH, Ryan TA. CDK5 serves as a major control point in neurotransmitter release. Neuron. 2010;67:797–809. doi: 10.1016/j.neuron.2010.08.003. [DOI] [PMC free article] [PubMed] [Google Scholar]
- Kneussel M, Wagner W. Myosin motors at neuronal synapses: drivers of membrane transport and actin dynamics. Nat Rev Neurosci. 2013;14:233–247. doi: 10.1038/nrn3445. [DOI] [PubMed] [Google Scholar]
- Kolega J. Phototoxicity and photoinactivation of blebbistatin in UV and visible light. Biochem Biophys Res Commun. 2004;320:1020–1025. doi: 10.1016/j.bbrc.2004.06.045. [DOI] [PubMed] [Google Scholar]
- Lee J, Guan Z, Akbergenova Y, Littleton JT. Genetic analysis of synaptotagmin C2 domain specificity in regulating spontaneous and evoked neurotransmitter release. J Neurosci. 2013;33:187–200. doi: 10.1523/JNEUROSCI.3214-12.2013. [DOI] [PMC free article] [PubMed] [Google Scholar]
- Lou X, Fan F, Messa M, Raimondi A, Wu Y, Looger LL, Ferguson SM, De Camilli P. Reduced release probability prevents vesicle depletion and transmission failure at dynamin mutant synapses. Proc Natl Acad Sci U S A. 2012;109:E515–E523. doi: 10.1073/pnas.1121626109. [DOI] [PMC free article] [PubMed] [Google Scholar]
- Marra V, Burden JJ, Thorpe JR, Smith IT, Smith SL, Häusser M, Branco T, Staras K. A preferentially segregated recycling vesicle pool of limited size supports neurotransmission in native central synapses. Neuron. 2012;76:579–589. doi: 10.1016/j.neuron.2012.08.042. [DOI] [PMC free article] [PubMed] [Google Scholar]
- McMahon HT, Boucrot E. Molecular mechanism and physiological functions of clathrin-mediated endocytosis. Nat Rev Mol Cell Biol. 2011;12:517–533. doi: 10.1038/nrm3151. [DOI] [PubMed] [Google Scholar]
- Merrifield CJ, Feldman ME, Wan L, Almers W. Imaging actin and dynamin recruitment during invagination of single clathrin-coated pits. Nat Cell Biol. 2002;4:691–698. doi: 10.1038/ncb837. [DOI] [PubMed] [Google Scholar]
- Miserey-Lenkei S, Chalancon G, Bardin S, Formstecher E, Goud B, Echard A. Rab and actomyosin-dependent fission of transport vesicles at the Golgi complex. Nat Cell Biol. 2010;12:645–654. doi: 10.1038/ncb2067. [DOI] [PubMed] [Google Scholar]
- Mooren OL, Kotova TI, Moore AJ, Schafer DA. Dynamin2 GTPase and cortactin remodel actin filaments. J Biol Chem. 2009;284:23995–24005. doi: 10.1074/jbc.M109.024398. [DOI] [PMC free article] [PubMed] [Google Scholar]
- Moulder KL, Mennerick S. Reluctant vesicles contribute to the total readily releasable pool in glutamatergic hippocampal neurons. J Neurosci. 2005;25:3842–3850. doi: 10.1523/JNEUROSCI.5231-04.2005. [DOI] [PMC free article] [PubMed] [Google Scholar]
- Neher E. What is rate-limiting during sustained synaptic activity: vesicle supply or the availability of release sites. Front Synaptic Neurosci. 2010;2:144. doi: 10.3389/fnsyn.2010.00144. [DOI] [PMC free article] [PubMed] [Google Scholar]
- Peng A, Rotman Z, Deng PY, Klyachko VA. Differential motion dynamics of synaptic vesicles undergoing spontaneous and activity-evoked endocytosis. Neuron. 2012;73:1108–1115. doi: 10.1016/j.neuron.2012.01.023. [DOI] [PubMed] [Google Scholar]
- Raimondi A, Ferguson SM, Lou X, Armbruster M, Paradise S, Giovedi S, Messa M, Kono N, Takasaki J, Cappello V, O'Toole E, Ryan TA, De Camilli P. Overlapping role of dynamin isoforms in synaptic vesicle endocytosis. Neuron. 2011;70:1100–1114. doi: 10.1016/j.neuron.2011.04.031. [DOI] [PMC free article] [PubMed] [Google Scholar]
- Rex CS, Gavin CF, Rubio MD, Kramar EA, Chen LY, Jia Y, Huganir RL, Muzyczka N, Gall CM, Miller CA, Lynch G, Rumbaugh G. Myosin IIb regulates actin dynamics during synaptic plasticity and memory formation. Neuron. 2010;67:603–617. doi: 10.1016/j.neuron.2010.07.016. [DOI] [PMC free article] [PubMed] [Google Scholar]
- Richards DA, Bai J, Chapman ER. Two modes of exocytosis at hippocampal synapses revealed by rate of FM1–43 efflux from individual vesicles. J Cell Biol. 2005;168:929–939. doi: 10.1083/jcb.200407148. [DOI] [PMC free article] [PubMed] [Google Scholar]
- Rochlin MW, Wickline KM, Bridgman PC. Microtubule stability decreases axon elongation but not axoplasm production. J Neurosci. 1996;16:3236–3246. doi: 10.1523/JNEUROSCI.16-10-03236.1996. [DOI] [PMC free article] [PubMed] [Google Scholar]
- Ryan TA, Smith SJ. Vesicle pool mobilization during action potential firing at hippocampal synapses. Neuron. 1995;14:983–989. doi: 10.1016/0896-6273(95)90336-4. [DOI] [PubMed] [Google Scholar]
- Ryan TA, Reuter H, Wendland B, Schweizer FE, Tsien RW, Smith SJ. The kinetics of synaptic vesicle recycling measured at single presynaptic boutons. Neuron. 1993;11:713–724. doi: 10.1016/0896-6273(93)90081-2. [DOI] [PubMed] [Google Scholar]
- Ryu J, Liu L, Wong TP, Wu DC, Burette A, Weinberg R, Wang YT, Sheng M. A critical role for myosin IIb in dendritic spine morphology and synaptic function. Neuron. 2006;49:175–182. doi: 10.1016/j.neuron.2005.12.017. [DOI] [PubMed] [Google Scholar]
- Saheki Y, De Camilli P. Synaptic vesicle endocytosis. Cold Spring Harb Perspect Biol. 2012;4:a005645. doi: 10.1101/cshperspect.a005645. [DOI] [PMC free article] [PubMed] [Google Scholar]
- Salbreux G, Charras G, Paluch E. Actin cortex mechanics and cellular morphogenesis. Trends Cell Biol. 2012;22:536–545. doi: 10.1016/j.tcb.2012.07.001. [DOI] [PubMed] [Google Scholar]
- Sankaranarayanan S, Atluri PP, Ryan TA. Actin has a molecular scaffolding, not propulsive, role in presynaptic function. Nat Neurosci. 2003;6:127–135. doi: 10.1038/nn1002. [DOI] [PubMed] [Google Scholar]
- Schikorski T, Stevens CF. Quantitative ultrastructural analysis of hippocampal excitatory synapses. J Neurosci. 1997;17:5858–5867. doi: 10.1523/JNEUROSCI.17-15-05858.1997. [DOI] [PMC free article] [PubMed] [Google Scholar]
- Schweizer FE, Ryan TA. The synaptic vesicle: cycle of exocytosis and endocytosis. Curr Opin Neurobiol. 2006;16:298–304. doi: 10.1016/j.conb.2006.05.006. [DOI] [PubMed] [Google Scholar]
- Segal MM, Furshpan EJ. Epileptiform activity in microcultures containing small numbers of hippocampal neurons. J Neurophysiol. 1990;64:1390–1399. doi: 10.1152/jn.1990.64.5.1390. [DOI] [PubMed] [Google Scholar]
- Shupliakov O, Bloom O, Gustafsson JS, Kjaerulff O, Low P, Tomilin N, Pieribone VA, Greengard P, Brodin L. Impaired recycling of synaptic vesicles after acute perturbation of the presynaptic actin cytoskeleton. Proc Natl Acad Sci U S A. 2002;99:14476–14481. doi: 10.1073/pnas.212381799. [DOI] [PMC free article] [PubMed] [Google Scholar]
- Smythe E, Ayscough KR. Actin regulation in endocytosis. J Cell Sci. 2006;119:4589–4598. doi: 10.1242/jcs.03247. [DOI] [PubMed] [Google Scholar]
- Straight AF, Cheung A, Limouze J, Chen I, Westwood NJ, Sellers JR, Mitchison TJ. Dissecting temporal and spatial control of cytokinesis with a myosin II inhibitor. Science. 2003;299:1743–1747. doi: 10.1126/science.1081412. [DOI] [PubMed] [Google Scholar]
- Tan TC, Valova VA, Malladi CS, Graham ME, Berven LA, Jupp OJ, Hansra G, McClure SJ, Sarcevic B, Boadle RA, Larsen MR, Cousin MA, Robinson PJ. Cdk5 is essential for synaptic vesicle endocytosis. Nat Cell Biol. 2003;5:701–710. doi: 10.1038/ncb1020. [DOI] [PubMed] [Google Scholar]
- Taylor MJ, Lampe M, Merrifield CJ. A feedback loop between dynamin and actin recruitment during clathrin-mediated endocytosis. PLoS Biol. 2012;10:e1001302. doi: 10.1371/journal.pbio.1001302. [DOI] [PMC free article] [PubMed] [Google Scholar]
- Teng H, Wilkinson RS. Clathrin-mediated endocytosis near active zones in snake motor boutons. J Neurosci. 2000;20:7986–7993. doi: 10.1523/JNEUROSCI.20-21-07986.2000. [DOI] [PMC free article] [PubMed] [Google Scholar]
- Uren D, Hwang HK, Hara Y, Takeda K, Kawamoto S, Tullio AN, Yu ZX, Ferrans VJ, Tresser N, Grinberg A, Preston YA, Adelstein RS. Gene dosage affects the cardiac and brain phenotype in nonmuscle myosin II-B-depleted mice. J Clin Invest. 2000;105:663–671. doi: 10.1172/JCI8199. [DOI] [PMC free article] [PubMed] [Google Scholar]
- Wilkinson RS, Lin MY. Endocytosis and synaptic plasticity: might the tail wag the dog? Trends Neurosci. 2004;27:171–174. doi: 10.1016/j.tins.2004.01.011. [DOI] [PubMed] [Google Scholar]