Abstract
Hypertension is the most prevalent risk factor for cardiovascular diseases, present in almost 30% of adults. A key element in the control of vascular tone is the large-conductance, Ca2+-dependent K+ (BK) channel. The BK channel in vascular smooth muscle is formed by an ion-conducting α subunit and a regulatory β1 subunit, which couples local increases in intracellular Ca2+ to augmented channel activity and vascular relaxation. Our large population-based genetic epidemiological study has identified a new single-nucleotide substitution (G352A) in the β1 gene (KCNMB1), corresponding to an E65K mutation in the protein. This mutation results in a gain of function of the channel and is associated with low prevalence of moderate and severe diastolic hypertension. BK-β1E65K channels showed increased Ca2+ sensitivity, compared with wild-type channels, without changes in channel kinetics. In conclusion, the BK-β1E65K channel might offer a more efficient negative-feedback effect on vascular smooth muscle contractility, consistent with a protective effect of the K allele against the severity of diastolic hypertension.
Introduction
High blood pressure, or hypertension, is not only a disease but a risk factor for cardiac, brain, and kidney pathology as well (1, 2). Considering that between 25–40% of the adult population is hypertensive, and more than 90% of cases are of unknown origin, i.e., essential hypertension, the identification of molecular mechanisms involved in its pathophysiology and predictors of hypertension is of paramount relevance for the management of public health and the development of antihypertensive treatments. Despite efforts exploring genetic susceptibility to essential hypertension, the search for candidate genes with major repercussion at the population level has proven difficult and disappointing (3–5), reflecting the multifactorial nature of the hypertensive phenotype (6, 7).
The blood pressure within arteries depends on the resistance of the vessels, i.e., the diameter of the blood vessels, which in turn is controlled by the contraction of the smooth muscle cells in their walls (the arterial tone). The control of arterial tone depends on a calcium signal in the vascular smooth muscle, mainly provided by the influx of Ca2+ via voltage-gated channels and its release from intracellular stores (8). A key element in the control of the vascular tone is the large-conductance, Ca2+- and voltage-dependent K+ (BK) channel, which couples local increases in intracellular Ca2+ to augmented channel activity and vascular relaxation (8, 9). At the molecular level, the BK channel in vascular smooth muscle is formed by an ion-conducting α subunit (10) and a regulatory β1 subunit (11–13). In smooth muscle, an increase in BK channel activity is induced by local releases of Ca2+ from the sarcoplasmic reticulum (“Ca2+ sparks”) that lead to hyperpolarization of the membrane and prevention of further influx of Ca2+ (8). This negative-feedback mechanism is finely tuned by the presence of the β1 subunit of the BK channel, which increases channel sensitivity to Ca2+ (11, 13–17).
Despite the well-known negative-feedback effect of BK channels on vascular smooth muscle contraction, the only molecular evidence for its implication in the control of blood pressure comes from recent studies in animal models. Disruption of the β1 gene (kcnmb1) was associated with elevated blood pressure and left ventricular hypertrophy in mouse models (16, 17), and downregulation of the β1 subunit has been reported in hypertensive rat models (18, 19). However, no studies of the relationship between genetic variants of KCNMB1 and systemic blood pressure in humans have been done, although polymorphisms of KCNMB1 have been associated with baroreflex function (20). All these observations make the KCNMB1 gene, coding for the β1 subunit, an important target for the study of its contribution to the genetic basis of hypertension. The objective of the present study was to determine whether the KCNMB1 gene might be involved in the pathogenesis of human hypertension. For that purpose we conducted a search for genetic variants in the KCNMB1 gene together with functional ion channel studies and population-based genetic epidemiological studies.
Methods
Population study.
The representative population sample was composed of 3,876 participants aged 25–74: 1,914 women (49.4%) and 1,962 men (50.6%). They were randomly selected in two cross-sectional studies carried out in the province of Girona, Spain, from 1994 to 1996 and from 1999 to 2001, to establish the prevalence of cardiovascular risk factors in this region. Full details have been previously provided (21). Five hundred participants were under antihypertensive drug therapy, and a further 606 had blood pressure measurements that met the WHO hypertension criteria but were unaware of their condition (483 of them with isolated diastolic hypertension). Owing to the epidemiological nature of diastolic blood pressure (DBP) measurements, which might not fit the clinical criteria of hypertension, only strictly normotensive subjects (DBP < 80 mmHg; n = 1,727) and definitely hypertensive subjects (DBP ≥ 90 mmHg; n = 983) were considered in this study. All participants gave written informed consent. The study was approved by the Institutional Ethics Committee of the Institut Municipal d’Investigació Mèdica, and the individual results were sent back to all participants.
Measured variables.
A precision scale was used for weight measurement. Participants wore underwear. Height was also measured. BMI was determined as weight divided by squared height (kg/m2). The mean BMI of the participants in the study was 27.2 kg/m2. Blood pressure measurements were obtained with a periodically calibrated mercury sphygmomanometer. The operator followed a certification process in the standardized measurement technique at a central laboratory, and determinations were always made by the same person. A cuff adapted to upper-arm perimeter (young, adult, obese) was selected for each participant. The first measurements were performed after a 5-minute rest, and the second measurements were taken at least 20 minutes later. The value used was the arithmetic mean of both determinations. Standardized hypertension and diabetes mellitus questionnaires were used as described previously (21).
Screening of KCNMB1 gene.
Exons encoding the modulatory β1 subunit (KCNMB1) of the BK channel (22) were amplified from genomic DNA of 11 severely hypertensive and 12 strictly normotensive participants. The PCR products were analyzed by direct sequencing. The E65K variant was identified in the third exon of the KCNMB1 gene (GenBank accession no. U25138) by dideoxynucleotide-sequencing method (ABI PRISM BigDye Terminator 3.0; Applied Biosystems, Foster City, California, USA) and was confirmed by sequencing of the second strand, using the forward and reverse primers 5′-CAGCCAGTTAGCGGCAGATTC-3′ and 5′-TGTTGCAAGAGTAGCCAAGGTTG-3′. Following the identification of the mutation E65K in the third exon of the KCNMB1 gene by direct sequencing, this mutation was analyzed in every one of the 3,876 participants of the study by a real-time quantitative PCR. The DNA samples were analyzed by TaqMan assay (ABI PRISM 7900HT; Applied Biosystems), using 5′-AGCGTGTGGACCCAGGAAT-3′ and 5′-GGCAGCTGACACGTTGA-3′ primers, and FAM-CCTTCTTGCCCTTCAGCTTCTCCTC-TAMRA probe for the K (A base) allele and VIC-CACCTTCTTGCCCTTCAGCTCCTC-TAMRA probe for the and E (G base) allele.
Generation and expression of mutant subunits.
The E65K mutation was introduced into the human β1 subunit of the BK channel cloned into pcDNA3, a gift from Ligia Toro (University of California–Los Angeles, Los Angeles, California, USA), using the QuikChange Mutagenesis Kit (Stratagene, La Jolla, California, USA), and verified by subsequent sequencing. HEK-293 cells permanently expressing the human α subunit of the BK channel (hSlo) (23) were transfected with the BK-β1E65K channel construct using a linear polyethylenimine (PEI) derivative, the polycation ExGen 500 (Fermentas Inc., Hanover, Maryland, USA) (24), following the manufacturer’s instructions (seven equivalents PEI per 3.3 μg DNA). Two hundred fifty thousand HEK-293 cells were seeded per 35-mm dish 24 hours before transfection. For each dish, 3 μg of the β1WT or β1E65K construct, together with the transfection reporter coding for enhanced GFP (pEGFPN1) at a 10:1 ratio, was used. For double transfections, 1.5 μg of β1WT plus 1.5 μg of β1E65K was used.
Electrophysiology.
Experiments were carried out on EGFP-positive cells plated on 35-mm plastic dishes mounted on the stage of an Olympus IX70 inverted microscope (Olympus America Inc., Melville, New York, USA). Ionic currents were recorded in the inside-out patch-clamp model (25). Borosilicate glass patch pipettes had 1–3 MΩ resistance and were filled with a solution containing (in mM): 140 KCl, 1.2 MgCl2, 0.2 CaCl2, 0.5 EDTA, and 10 HEPES (300 milliosmoles per liter, pH 7.3). Solutions bathing the cytoplasmic face of the patch membrane contained (in mM): 140 KCl, 0.7 MgCl2, 10 HEPES, (300 milliosmoles per liter, pH 7.25). The intracellular free Ca2+ concentration (calculated using EqCal; Biosoft, Cambridge, United Kingdom) was adjusted to the desired values by different combinations of CaCl2 and EDTA added to the bath solution. Currents were acquired at 10 kHz and low-pass-filtered at 1 kHz. For current-activation studies, membrane patches were clamped at 0 mV, pulsed for 150 milliseconds from –100 mV to +200 mV in 10-mV steps, and repolarized to –80 mV for 10–20 milliseconds. For current-deactivation studies, tail currents were evoked by a 50-millisecond step to +160 mV (for 10 μM cytosolic free Ca2+) or +200 mV (for Ca2+ ≤ 1.6 μM), and then measured by repolarizing to various voltages (from –100 mV to +10 mV in 10-mV steps) for 50–90 milliseconds. Experiments were performed at room temperature (22–26°C).
Allosteric model fitting.
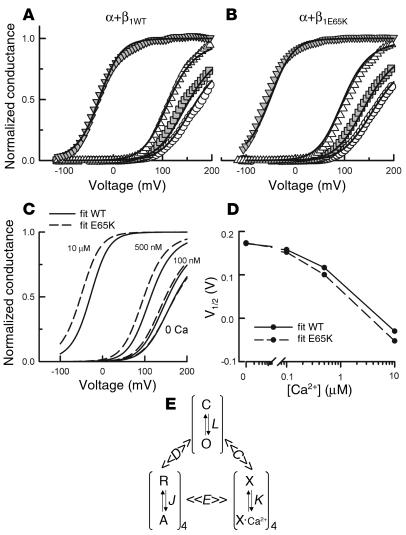
Assuming that the movement of the BK channel voltage sensors and Ca2+ binding occur separately from channel opening, the channel-gating kinetics is best explained by a 50-state two-tiered allosteric kinetic model, which is raised to 70 states if some coupling between Ca2+ binding and voltage-sensor movement in the same subunit is assumed (26). Despite the apparent complexity of these many states, the properties of the model in steady state can be described with only eight parameters. These are equilibrium constants for voltage-sensor activation (J0), channel opening (L0), and calcium binding (Kd); voltage-dependence factors for channel opening (zL) and voltage-sensor activation (zJ); and allosteric factors for the interactions of calcium binding with channel opening (C), voltage-sensor activation with channel opening (D), and calcium binding with voltage-sensor activation (E).
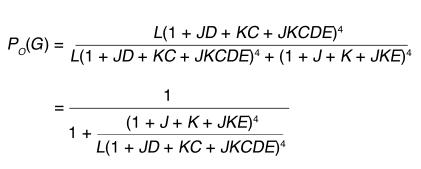
The steady-state open probability (PO) of the channel, or the normalized conductance (G) of the BK channel currents (as shown in Figure 6), at any calcium concentration and membrane potential is described by the equation
Figure 6.
Fitting of the experimental data to an allosteric model of BK channel gating. (A and B) G-V plots for α+β1WT (A) and α+β1E65K (B) currents measured at 0 (circles), 100 nM (squares), 500 nM (triangles), and 10 μM (inverted triangles) Ca2+. Solid curves represent fits to Equation 1 (see Methods) with parameters restricted as described in the text. (C) G-V plots for α+β1WT (solid line) and α+β1E65K (dashed line) channels as predicted by the model. (D) V1/2-versus-Ca2+ plots obtained from the G-V curves presented in C. (E) Allosteric kinetic scheme proposed for the BK channel by Horrigan and Aldrich (33, 34). The C-O transition corresponds to the closed-open equilibrium where L = L0 exp(zL × V / kT). The R-A transition corresponds to the resting-active equilibrium of a single voltage sensor where J = J0 exp(zJ × V / kT). The X·Ca2+ transition is calcium binding to a single calcium sensor, with equilibrium constant K = [Ca2+] / Kd. These three equilibriums are related to each other by the allosteric factors C, D, and E, as shown. When there are n voltage sensors active, the C-O equilibrium constant is LDn. Conversely, when the channel is open, the R-A equilibrium constant is JD. The same applies for the allosteric factors C and E.
Equation
 |
1 |
where L =L0 exp[(zL × V)/(kT)], J = J0 exp[(zJ × V)/(kT)] and K = [Ca2+]/Kd. V is membrane voltage, T is absolute temperature, and k = R/F (R, Gas constant; F, Faraday’s constant).
A satisfactory estimation of the model parameters requires more than just fitting the PO(G)-V relationships to the equations above. Precise measurements of gating currents and open probabilities below 10–3 were used previously (26) to independently estimate J0, zJ, L0, zL, Kd, and C. A fit of the PO(G)-V relationships for α+β1WT channels to the model has also been published (27), but in this study, only a 50-state model was used and an independent estimation of parameters is missing. Despite these limitations, the fit is reasonable, and so we attempted to fit our steady-state data to the 70-state allosteric model.
Statistical analysis.
Deviation from Hardy-Weinberg equilibrium was assessed using a χ2 test with 1 degree of freedom. A χ2 or Fisher’s exact test, as appropriate, was used to compare genotype frequencies between the diastolic normotensive and hypertensive groups. Age- and sex-adjusted odds ratios (ORs) of different degrees of hypertension and their 95% confidence intervals were estimated for K-carriers (KK + KE genotypes) versus EE genotype by unconditional logistic regression analysis. P values less than 0.05 were considered statistically significant. Population-attributable risk (PAR) was calculated by case-control approach, given the cross-sectional nature of our study, for which the estimation of OR is similar to that obtained by the approach using incidence rates in populations (28):
Equation
 |
2 |
where Pe is the proportion of K-carrier nonhypertensive participants and OR is the age- and sex-adjusted odds ratio of diastolic hypertension for K-carriers.
Electrophysiological data are presented in graphs as mean ± SEM. ANOVA analysis with repeated measurements was used to test differences in the voltage necessary to half activate the channel (V1/2) among cells expressing different combinations of α and β1 subunits.
Results
Population-based genetic epidemiological study of the human KCNMB1 gene.
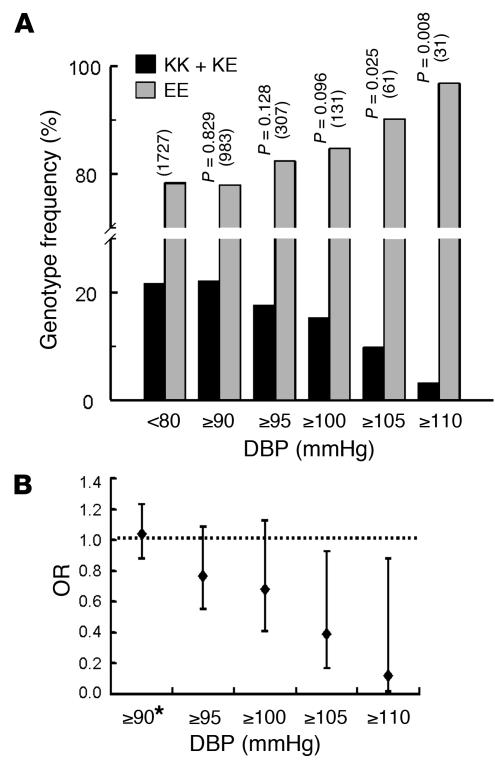
The four exons of KCNMB1 were amplified using PCR and analyzed by direct sequencing. A new single-nucleotide substitution (G352A) corresponding to a glutamic acid–to–lysine mutation at position 65 (E65K) of the protein was found in the third exon of the KCNMB1 gene. The genotype frequencies were 78.4% for EE homozygote, 20.0% for EK heterozygote, and 1.6% for KK homozygote subjects in a representative random population sample of 3,876 participants. The observed genotype frequencies fitted the Hardy-Weinberg equilibrium. KK homozygote and EK heterozygote subjects were analyzed together because of the low prevalence of the former. Statistical analyses were performed separately for diastolic and systolic blood pressure values. Subjects with DBP lower than 80 mmHg who were not receiving antihypertensive therapy constituted the diastolic normotensive group. The genotype frequency of the E65K mutation (KK + KE) decreased with increasing DBP values (Figure 1A), from 21.6% in the normotensive group to 3.2% in the severe hypertension group (DBP ≥ 110 mmHg).
Figure 1.
(A) E65K genotype distribution by DBP. P values for genotype distributions at each level of diastolic hypertension are shown (with the number of subjects in parentheses). (B) Age- and sex-adjusted ORs at each level of diastolic hypertension are presented for K-carriers versus EE genotype. The adjusted ORs for K-carriers of DBP ≥ 105 mmHg and DBP ≥ 110 mmHg were 0.39 (95% confidence interval, 0.17–0.93, P = 0.034) and 0.12 (95% confidence interval, 0.02–0.90, P = 0.039), respectively. *Subjects under hypertension treatment with DBP < 90 mmHg were also included in this group.
The age- and sex-adjusted ORs of five levels of diastolic hypertension were estimated for the K allelic variant compared with the EE genotype (Figure 1B). The magnitude and the direction of the associations (OR < 1 implies a lower risk and OR > 1 implies an increased risk of hypertension) were consistent with a protective effect of the K allele against the severity of diastolic hypertension and with a progressively deleterious effect of the EE genotype. Indeed, there was a decreasing risk for the E65K variant with diastolic hypertension severity, which suggests a gene-dosage effect (Figure 1B). Further adjustment for diabetic status and BMI had a negligible effect on the OR values (results not shown). The population-attributable risk for the K allele (i.e., the reduction in diastolic hypertension prevalence that could be expected from eliminating the effect of EE genotype in the entire population) was –10.6% for moderate hypertension (DBP ≥ 100 mmHg) and –31.8% for severe hypertension (DBP ≥ 110 mmHg). Similar logistic regression analysis applied to variations in systolic blood pressure showed no relationship between the E65K variant and systolic hypertension (results not shown).
Increased Ca2+ sensitivity of the BK-β1E65K channels.
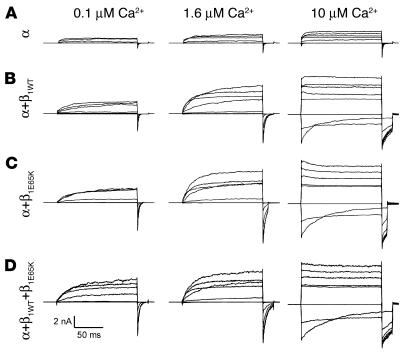
To evaluate the mechanism by which the E65K mutation might modify BK channel activity and, therefore, its potential contribution to the control of blood pressure, we expressed and functionally tested the E65K mutant in HEK-293 cells, i.e., we measured the ionic currents generated by the movement of K+ via the wild-type and mutant BK channels. As the frequency of the KK genotype was very low, we also evaluated the functional significance of the expression of β1E65K in combination with wild-type β1. HEK-293 cells permanently expressing the human pore-forming α subunit of the BK channel (also known as hSlo1; refs. 10, 29) were transiently transfected with wild-type (β1WT), mutant (β1E65K), or a combination of both β1 subunits (β1WT+β1E65K). Figure 2 shows BK channel currents obtained from inside-out macropatches excised from transfected HEK-293 cells. The representative currents shown in Figure 2 were recorded at three different intracellular (bathing) Ca2+ concentrations: 0.1 μM, 1.6 μM, and 10 μM. As described previously (11, 15, 30), BK α+β1WT channels (Figure 2B) showed higher activity than channels lacking the regulatory β1WT subunit (Figure 2A). Moreover, expression of β1E65K alone (Figure 2C) or in combination with the β1WT (Figure 2D) further enhanced the BK channel sensitivity to Ca2+, particularly with Ca2+ concentrations in the micromolar range.
Figure 2.
BK channel currents obtained from different combinations of α and β1 BK channel subunits. Currents were recorded from excised inside-out macropatches obtained from HEK-293 cells expressing the BK α subunit (A), α+β1WT (B), α+β1E65K (C), or α+β1WT+β1E65K (D). Currents were recorded at 0.1 μM (left panels), 1.6 μM (middle panels), and 10 μM cytosolic Ca2+ (right panels). The voltage protocol was as described in Methods.
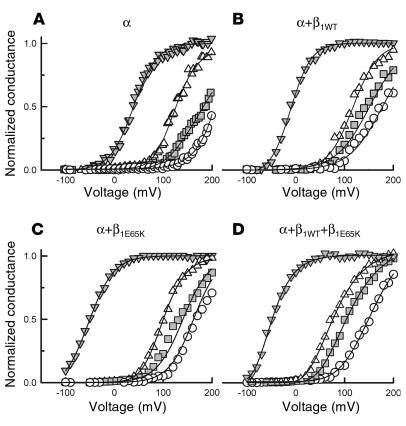
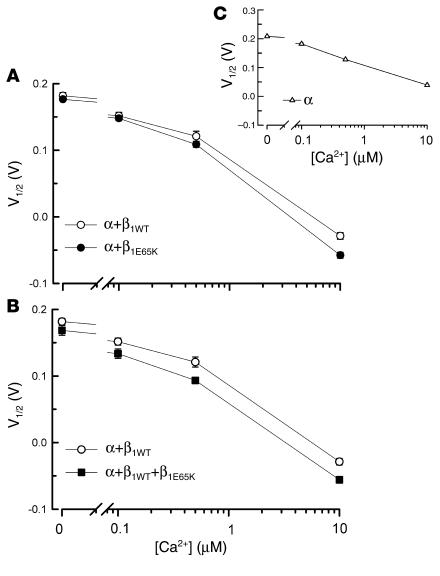
The increase in the activity of BK channels is best evaluated by analysis of the conductance-voltage (G-V) relationship obtained for the four experimental conditions at different Ca2+ concentrations (Figure 3). From these curves the voltage necessary to half activate the channel (V1/2) can be calculated. This is a convenient measure to evaluate the effect of β1 subunits on BK channel activity, since it is directly related to the energy (ΔG) necessary to open the channel, ΔG = zFV1/2, where z is the apparent number of gating charges (31). The plot of the V1/2 obtained for α, α+β1WT, α+β1E65K, and α+β1WT+β1E65K currents at different cytosolic Ca2+ concentrations is shown in Figure 4. In order to facilitate the comparison between BK-β1WT and BK-β1E65K channel currents, Figure 4A shows the V1/2-versus-Ca2+ plots for α+β1WT currents and α+β1E65K currents, and Figure 4B shows those for α+β1WT currents and α+β1WT+β1E65K currents. Interestingly, expression of the β1E65K subunit (Figure 4A) imposed a further negative shift, compared with β1WT. At the highest Ca2+ concentration tested, 10 μM, the negative shift induced by β1E65K was approximately 30 mV. Coexpression of β1WT and β1E65K (Figure 4B) resulted in a negative shift in the V1/2-versus-Ca2+ plot similar to that obtained with β1E65K alone. As expected, any combination of β1 subunits induced a dramatic negative shift in the voltage-dependent activation of the BK channels compared with α currents alone (Figure 4C).
Figure 3.
Plots of conductance versus voltage for BK channel currents at different Ca2+ concentrations. BK channel currents were recorded from patches excised from cells expressing α (A), α+β1WT (B), α+β1E65K (C), and α+β1WT+β1E65K (D) channel subunits. Normalized conductance was obtained for each test potential from the peak tail current at –80 mV measured at 0 (circles), 100 nM (squares), 500 nM (triangles), and 10 μM (inverted triangles) Ca2+. Solid curves represent fits to the Boltzmann equation. The data at 0 and 100 nM Ca2+ were normalized using the value obtained at 500 nM as maximum tail current. To obtain an average G-V curve for each case, individual curves were displaced along the voltage axis by ΔV = (<V1/2> – V1/2) (where <V1/2> denotes the average V1/2 for each transfection group). The 300–360 resulting points were then reduced to 61 with the smoothing function of SigmaPlot (SPSS Inc., Richmond, California, USA).
Figure 4.
Plot of V1/2 versus Ca2+ concentration. (A) V1/2 versus Ca2+ concentration obtained for α+β1WT (n = 13) and α+β1E65K (n = 15). (B) V1/2 versus Ca2+ concentration for α+β1WT and α+β1WT+β1E65K (n = 6). (C) V1/2 versus Ca2+ concentration for α (n = 3). Data are shown as mean ± SEM. Differences in V1/2 curves between different β1 subunits were tested by ANOVA with repeated measurements. P = 0.002 for β1WT vs. β1E65K, and P = 0.005 for β1WT vs. α+β1WT+β1E65K.
β1E65K did not alter the kinetics of BK-β1 channels.
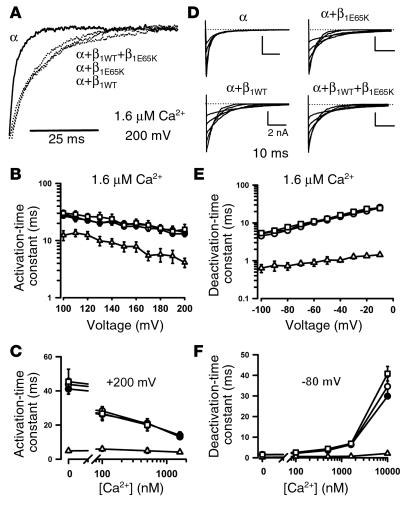
The presence of the β1WT subunit has also been shown to slow the activation and deactivation kinetics of BK channel currents (11, 15, 30). Thus, we evaluated whether the kinetics of BK channel currents in the presence of β1E65K differed from that obtained by expression of β1WT alone. Figure 5A shows representative current traces obtained from cells transfected with different combinations of α and β1 subunits and normalized to the peak current, and Figure 5D shows representative tail currents obtained from cells expressing different combinations of β1 subunits of the BK channel. Figure 5B shows the plots of average activation-time constants versus voltage at 1.6 μM Ca2+, and Figure 5C shows the activation-time constants at +200 mV versus Ca2+ concentration measured in cells expressing α, α+β1WT, α+β1E65K, and α+β1WT+β1E65K. Slower kinetics were observed in β1-expressing than in β1-nonexpressing cells, with no difference among the β1-expressing cells. Similar results were obtained when the deactivation kinetics was analyzed (Figure 5, E and F). Analysis of the time constants for the different combinations of β1 subunits at different Ca2+ concentrations or voltage commands also showed no differences in the kinetics between β1WT and β1E65K currents (results not shown).
Figure 5.
Effect of β1E65K on BK channel activation and deactivation kinetics. (A) Current traces normalized to peak current were obtained with a pulse from 0 mV to +200 mV in the presence of 1.6 μM Ca2+. (B) Activation-time constants (at 1.6 μM Ca2+) were fitted with a single exponential function and plotted versus the pulse potential for α (open triangles, n = 4), α+β1WT (open circles, n = 13), α+β1E65K (filled circles, n = 15), and α+β1WT+β1E65K currents (open squares, n = 6). (C) Plot of activation-time constants versus Ca2+ concentrations measured with a pulse to +200 mV. (D) Families of tail currents recorded at 1.6 μM Ca2+ under the four conditions. (E and F) Deactivation-time constants were obtained by fitting of the tail currents with a single exponential function and plotted versus the pulse potential (E) or versus the Ca2+ concentration at –80 mV (F).
Allosteric modeling of the β1E65K effect.
Activation of BK channels is controlled by two independent stimuli: membrane voltage and intracellular Ca2+. The most recent views on the mechanisms underlying the regulation of BK channels by voltage and Ca2+ strongly suggest that channel opening, calcium binding, and voltage-sensor activation can be viewed as separate equilibriums that allosterically interact with each other (26, 32–37) (Figure 6E). Furthermore, the presence of auxiliary subunits such as the β1 subunit also modifies the channel gating (13, 27). Therefore, searching for a mechanistic explanation to the changes in the gating associated with the presence of the mutant β1E65K subunit, we compared our experimental data with the values provided by allosteric models (26, 27). The specific aim was to evaluate whether the allosteric models predict a displacement of the G-V relationships without changing the parameters involved in macroscopic-current kinetics, as observed experimentally for BK-β1E65K channel currents when compared with BK-β1WT channel currents.
The rate-limiting step in macroscopic-current relaxation is the closed-to-open (or open-to-closed) step, since voltage-sensor movements are much faster than channel opening and closing and calcium binding is in equilibrium (26, 33–36). This implies that the kinetics of macroscopic-current relaxation is fully contained within the parameters that govern the open-closed transition. These parameters are the equilibrium constant L0 and its allosteric modifiers C (allosteric factor for the interaction of Ca2+ binding with channel opening) and D (allosteric factor for the interaction of voltage-sensor activation with channel opening; see Equation 1). In other words, the model predicts that any change in the parameters J0, Kd, zL, zJ, or E will affect the steady-state properties of the channel but not its macroscopic-current kinetics.
We first used the allosteric gating model to fit the α+β1WT channel data. Based on previous studies (26, 27), we restricted the parameters as follows: J0, Kd, and L0 were restricted to values between 0.01 and 10, between 1 μM and 80 μM, and between 10–7 and 10–3, respectively. zJ and zL were allowed to vary from 0.4 to 0.7 and from 0.2 to 0.5, respectively. Finally, the allosteric factors C and D were maintained at a value greater than 1, while E was restricted to between 1 and 3. After several runs, the best fit gave the following parameters: J0, 0.143; Kd, 21.1; L0, 1 × 10⁻⁴; zJ, 0.41; zL, 0.2; C, 9.2; D, 9.7; and E, 3. As can be seen in Figure 6A, the fit is in reasonable agreement with the experimental data. And although not equal, the parameters agree with those already published (27). A good fit of the α+β1E65K data to the model, with L0, C, and D values identical to those for the wild-type condition, was also obtained (Figure 6B), and the resulting parameters were J0, 0.161; Kd, 14.7; L0, 1 × 10⁻⁴; zJ, 0.4; zL, 0.2; C, 9.2; D, 9.7; and E, 3. Changes in Kd and J0 can account for the observed displacement of the steady-state G-V relationships. Figure 6C shows a comparison between the G-V curves for the α+β1WT and the α+β1E65K predicted by the model. A comparison between the predicted V1/2 for these two channels is shown in Figure 6D and is in good agreement with the experimental data shown in Figure 4B. In particular, the model predicts that the effect of the mutant β1E65K subunit on V1/2 becomes more pronounced as the internal Ca2+ concentration is increased, and this was indeed found experimentally.
Discussion
As with most quantitative traits, differences in blood pressure result from contributions of many genes interacting with each other and with the environment. Several mutations have been identified in genes that cause rare, monogenic, forms of heritable hypertension without major repercussion at the population level. These include genes of the renin-angiotensin-aldosterone system, genes coding for adrenergic receptors, genes coding for proteins that regulate endothelial function, and genes coding for kidney ion-transport systems, among others (3, 5). The situation is much more complex for the 90–95% of patients suffering from essential hypertension in whom, despite enormous efforts to identify predisposing genes, no single genetic variant has emerged from linkage or association analysis as consistently related to blood pressure level in every sample and in all populations (5).
The lack of consistency in previously reported findings has prompted the experts to review the criteria for high-quality association studies and to recommend the following: the use of a large sample size, biological plausibility, functional significance, and high OR (5). Our combined functional and population-based genetic epidemiological studies complied with the above-mentioned criteria and provide evidence for a direct involvement of the BK channel in the control of DBP in humans. A clear correlation between the genotype frequency of the β1E65K mutant and DBP was found. Moreover, we have shown evidence of, to our knowledge, the strongest association between a single mutation and low prevalence of moderate-to-severe diastolic hypertension. Our results are consistent with a possible protective effect of the K allele against the severity of diastolic hypertension and with a progressively deleterious effect of the EE genotype.
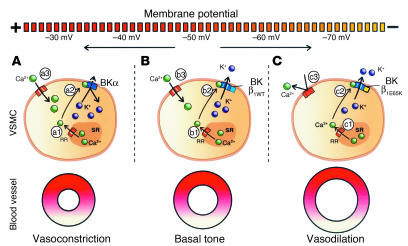
The basal vascular tone depends on calcium ions regulating the contraction of vascular smooth muscle (Figure 7B). Broad and global elevation in intracellular Ca2+ levels, mainly achieved by the activation of voltage-gated L-type calcium channels following membrane depolarization (Figure 7B, b3), induces maintained contraction (8). On the other hand, local Ca2+ transients (Figure 7B, b2), caused by the opening of a cluster of ryanodine receptor Ca2+ channels in the sarcoplasmic reticulum, only activate a group of nearby BK channels (Figure 7B, b2), without major repercussion on total intracellular Ca2+ levels. BK channel activation hyperpolarizes the cell membrane, preventing a large influx of Ca2+ via the depolarization-activated L-type calcium channels. The presence of the β1 subunit increases the Ca2+ sensitivity of the BK channel, manifested as a negative shift in the channel’s conductance-voltage relationship, making the negative-feedback mechanism more efficient and determining the basal tone (11, 13–17). Recently, the role of the β1 subunit in the maintaining of the basal tone has been elegantly shown with the use of β1 knockout animals (16, 17). These models, lacking the β1 subunit, represent a situation similar to that shown in Figure 7A; they face a reduction in the functional coupling of Ca2+ sparks to BK channel activation, and, therefore, a diminished negative-feedback mechanism.
Figure 7.
Proposed effect of BK-β1E65K channels in VSMCs. (A) Absence of the β1 subunit shifts the basal tone toward a more contracted state. Ca2+ sparks (a1) caused by the opening ryanodine receptors (RR) in the sarcoplasmic reticulum (SR) activate BK channels (a2); however, because of the absence of the β1 subunit, there is a decreased coupling of Ca2+ sparks to BK channel activation, resulting in low BK channel activity, membrane depolarization, and higher Ca2+ entry via depolarization-activated Ca2+ channels (a3). (B) Ca2+ sparks (b1) in the presence of the β1 subunit induced a larger activation of BK-β1 channels (b2), leading to an average 20-mV hyperpolarization and thus reducing the entry of Ca2+ (b3). (C) The mutant BK-β1E65K channels (c2) show increased activity (compared with BK-β1WT channels) at the Ca2+ concentrations produced within a single spark (c1), resulting in increased hyperpolarization and reduced activation of voltage-gated Ca2+ channels (c3), which further reduces Ca2+ entry (c3), offering a more efficient negative-feedback mechanism and, hence, vasodilation.
Functional analysis of BK-β1E65K channel currents revealed a further negative shift in the G-V relationships that becomes larger with progressive increases in intracellular Ca2+. At the highest Ca2+ concentration tested (10 μM), we measured an approximately 30-mV negative shift, compared with BK-β1WT channel currents. This consistent, negative shift in the activation of the BK-β1E65K channel (the G-V relationships) represents an increased activity (open probability, PO) of the channel at equivalent voltage and Ca2+ concentrations, compared with the BK-β1WT channel. Similar results, without statistical differences, were obtained when the β1E65K subunit was expressed alone or with the β1WT subunit, suggesting a dominant-positive effect of the mutant subunit. Such a dominant effect when the mutant allele is coexpressed with the wild-type allele has already been reported for other channels (38). Additional work, outside the scope of this study, will be necessary to clarify the mechanism by which the β1E65K subunit exerts its dominant-positive effect on the β1WT subunit.
In the context of vascular-tone regulation, the presence of β1E65K might imply a more efficient feedback mechanism, leading to a reduced Ca2+ entry via voltage-dependent Ca2+ channels (Figure 7C). Figure 6 shows that the displacement of the G-V relationships produced by the E65K mutation can be reproduced by the 70-state allosteric model, without significant changes in the parameters involved in macroscopic-current kinetics. The 70-state model fit also allows us to make a prediction about the physiological impact of the E65K mutation. As mentioned above, smooth muscle vasoregulation mediated by the BK channel is mainly through spontaneous transient outward K+ currents induced by ryanodine receptor–mediated Ca2+ sparks (8). Therefore, the increase in PO upon a Ca2+ spark at the physiological resting potential is essential if a fine tuning of the smooth muscle tone is required. Recent estimates, based on the PO increase of BK channels, suggest that a single Ca2+ spark raises the local calcium concentration (in microdomains just below BK channels) from 100 nM to a value between 4 μM and 30 μM (39). At the physiological membrane potential of –40 mV and 100 nM Ca2+, the fits predict PO = 0.0007 for β1WT and 0.0009 for β1E65K. This means that in the resting state, α+β1E65K channels are slightly more active than α+β1WT channels. When the cytoplasmic Ca2+ concentration is raised to 4 μM calcium (the lower limit of the estimate), the model predicts PO = 0.07 for α+β1WT (a 100-fold increment) and 0.181 for α+β1E65K (a 200-fold increment). This doubling of the BK channel open probability induced by the mutant β1E65K subunit could be the element responsible for the protective effect found in the population carrying the β1E65K mutation. Nevertheless, because BK channel activity in intact arteries is controlled by multiple factors, including expression levels of α+β1 subunits, phosphorylation balance, Ca2+ spark amplitude, and others (18, 19, 40), definite proof of this hypothesis would only be possible with the analysis of vascular smooth muscle samples from K-carriers or animal models. Our observation that the E65K variant is associated with lower prevalence of diastolic but not of systolic hypertension might be related to the fact that systolic blood pressure mainly depends on systolic volume, whereas DBP reflects the arterial compliance and hence the vascular tone, the modulation of which is a key characteristic of the BK channel.
The E65K mutation resides on the extracellular loop of β1, a domain involved in the binding of inhibitory toxins (41) and probably of activators of BK channels (42, 43). Although the molecular mechanism by which this mutation determines the gain of function of the BK channel remains unknown, two points regarding the interaction between α and β1 subunits might be drawn from our study. First, the extracellular loop of β1 plays a role in the increased Ca2+ sensitivity of the BK channel complex. Second, the increased Ca2+ sensitivity and the slow channel-gating properties conferred by the presence of the β1 subunit can be molecularly dissected. That is, the β1E65K subunit augmented the Ca2+ sensitivity, compared with the β1WT subunit, without altering the channel kinetics. This behavior of the β1E65K subunit can be explained in terms of the allosteric model for the interaction between α and β1 (26, 27). The fit of our data to this model shows that changes in the V1/2-[Ca2+] curve can be obtained without a change in the open-to-closed equilibrium constant, which determines the intrinsic energetics of the opening and closing of channels, and, therefore, the K+ current kinetics.
In summary, our combined functional and population-based genetic epidemiological studies provide what is, to our knowledge, the first evidence for a direct involvement of the BK channel in the control of DBP in humans. Moreover, we found a very strong association between the β1E65K mutant and low prevalence of moderate-to-severe diastolic hypertension, consistent with a gain of function of the BK-β1E65K channel and a protective effect of the K allele.
Acknowledgments
This work was supported by the Human Frontiers Science Organization, the Ministerio de Ciencia y Tecnología (Spain), Red HERACLES (Fondo de Investigaciones Sanitarias, Spain), Comissió Interdepartamental de Recerca i Innovació Tecnològica, Distinció de la Generalitat de Catalunya per a la Promoció de la Recerca Universitaria, and Fondo Nacional de Investigaciones Científicas y Tecnológicas (Chile). We thank L. Toro at the University of California–Los Angeles for the gift of the KCNMB1-expressing plasmid and A. Currid for proofreading the manuscript.
Footnotes
See the related Commentary beginning on page 955.
Nonstandard abbreviations used: large conductance, Ca2+-dependent K+ (BK); conductance (G); diastolic blood pressure (DBP); odds ratio (OR); open probability (PO).
Conflict of interest: The authors have declared that no conflict of interest exists.
References
- 1.Mosterd A, et al. Trends in the prevalence of hypertension, antihypertensive therapy, and left ventricular hypertrophy from 1950 to 1989. N. Engl. J. Med. 1999;340:1221–1227. doi: 10.1056/NEJM199904223401601. [DOI] [PubMed] [Google Scholar]
- 2.Warlow CP. Epidemiology of stroke. Lancet. 1998;352(Suppl. 3):SIII1–SIII4. doi: 10.1016/s0140-6736(98)90086-1. [DOI] [PubMed] [Google Scholar]
- 3.Lifton RP, Gharavi AG, Geller DS. Molecular mechanisms of human hypertension. Cell. 2001;104:545–556. doi: 10.1016/s0092-8674(01)00241-0. [DOI] [PubMed] [Google Scholar]
- 4.Doris PA. Hypertension genetics, single nucleotide polymorphisms, and the common disease: common variant hypothesis. Hypertension. 2002;39:323–331. doi: 10.1161/hy0202.104087. [DOI] [PubMed] [Google Scholar]
- 5.Luft FC. Hypertension as a complex genetic trait. Semin. Nephrol. 2002;22:115–126. doi: 10.1053/snep.2002.30211. [DOI] [PubMed] [Google Scholar]
- 6.Touyz RM. Molecular and cellular mechanisms regulating vascular function and structure: implications in the pathogenesis of hypertension. Can. J. Cardiol. 2000;16:1137–1146. [PubMed] [Google Scholar]
- 7.Cain AE, Khalil RA. Pathophysiology of essential hypertension: role of the pump, the vessel, and the kidney. Semin. Nephrol. 2002;22:3–16. [PubMed] [Google Scholar]
- 8.Jaggar JH, Porter VA, Lederer WJ, Nelson MT. Calcium sparks in smooth muscle. Am. J. Physiol. Cell Physiol. 2000;278:C235–C256. doi: 10.1152/ajpcell.2000.278.2.C235. [DOI] [PubMed] [Google Scholar]
- 9.Toro L, Wallner M, Meera P, Tanaka Y. Maxi-K(Ca), a unique member of the voltage-gated K channel superfamily. News Physiol. Sci. 1998;13:112–117. doi: 10.1152/physiologyonline.1998.13.3.112. [DOI] [PubMed] [Google Scholar]
- 10.Meera P, Wallner M, Song M, Toro L. Large conductance voltage- and calcium-dependent K+ channel, a distinct member of voltage-dependent ion channels with seven N-terminal transmembrane segments (S0-S6), an extracellular N terminus, and an intracellular (S9-S10) C terminus. Proc. Natl. Acad. Sci. U. S. A. 1997;94:14066–14071. doi: 10.1073/pnas.94.25.14066. [DOI] [PMC free article] [PubMed] [Google Scholar]
- 11.McManus OB, et al. Functional role of the beta subunit of high conductance calcium-activated potassium channels. Neuron. 1995;14:645–650. doi: 10.1016/0896-6273(95)90321-6. [DOI] [PubMed] [Google Scholar]
- 12.Tanaka Y, Meera P, Song M, Knaus HG, Toro L. Molecular constituents of maxi KCa channels in human coronary smooth muscle: predominant alpha + beta subunit complexes. J. Physiol. 1997;502:545–557. doi: 10.1111/j.1469-7793.1997.545bj.x. [DOI] [PMC free article] [PubMed] [Google Scholar]
- 13.Orio P, Rojas P, Ferreira G, Latorre R. New disguises for an old channel: MaxiK channel beta-subunits. News Physiol. Sci. 2002;17:156–161. doi: 10.1152/nips.01387.2002. [DOI] [PubMed] [Google Scholar]
- 14.Knaus HG, et al. Primary sequence and immunological characterization of beta-subunit of high conductance Ca2+-activated K+ channel from smooth muscle. J. Biol. Chem. 1994;269:17274–17278. [PubMed] [Google Scholar]
- 15.Meera P, Wallner M, Jiang Z, Toro L. A calcium switch for the functional coupling between alpha (hSlo) and beta subunits of maxi K channels. FEBS Lett. 1996;385:127–128. doi: 10.1016/0014-5793(96)83884-1. [DOI] [PubMed] [Google Scholar]
- 16.Brenner R, et al. Vasoregulation by the beta1 subunit of the calcium-activated potassium channel. Nature. 2000;407:870–876. doi: 10.1038/35038011. [DOI] [PubMed] [Google Scholar]
- 17.Pluger S, et al. Mice with disrupted BK channel beta1 subunit gene feature abnormal Ca2+ spark/STOC coupling and elevated blood pressure. Circ. Res. 2000;87:E53–E60. doi: 10.1161/01.res.87.11.e53. [DOI] [PubMed] [Google Scholar]
- 18.Amberg GC, Bonev AD, Rossow CF, Nelson MT, Santana LF. Modulation of the molecular composition of large conductance, Ca2+ activated K+ channels in vascular smooth muscle during hypertension. J. Clin. Invest. 2003;112:717–724. doi: 10.1172/JCI18684. [DOI] [PMC free article] [PubMed] [Google Scholar]
- 19.Amberg GC, Santana LF. Downregulation of the BK channel β1 subunit in genetic hypertension. Circ. Res. 2003;93:965–971. doi: 10.1161/01.RES.0000100068.43006.36. [DOI] [PubMed] [Google Scholar]
- 20.Gollasch M, et al. The BK channel beta1 subunit gene is associated with human baroreflex and blood pressure regulation. J. Hypertens. 2002;20:927–933. doi: 10.1097/00004872-200205000-00028. [DOI] [PubMed] [Google Scholar]
- 21.Masia R, et al. High prevalence of cardiovascular risk factors in Gerona, Spain, a province with low myocardial infarction incidence. REGICOR Investigators. J. Epidemiol. Community Health. 1998;52:707–715. doi: 10.1136/jech.52.11.707. [DOI] [PMC free article] [PubMed] [Google Scholar]
- 22.Jiang Z, Wallner M, Meera P, Toro L. Human and rodent MaxiK channel beta-subunit genes: cloning and characterization. Genomics. 1999;55:57–67. doi: 10.1006/geno.1998.5627. [DOI] [PubMed] [Google Scholar]
- 23.Ahring PK, Strobaek D, Christophersen P, Olesen SP, Johansen TE. Stable expression of the human large-conductance Ca2+-activated K+ channel alpha- and beta-subunits in HEK293 cells. FEBS Lett. 1997;415:67–70. doi: 10.1016/s0014-5793(97)01096-x. [DOI] [PubMed] [Google Scholar]
- 24.Boussif O, et al. A versatile vector for gene and oligonucleotide transfer into cells in culture and in vivo: polyethylenimine. Proc. Natl. Acad. Sci. U. S. A. 1995;92:7297–7301. doi: 10.1073/pnas.92.16.7297. [DOI] [PMC free article] [PubMed] [Google Scholar]
- 25.Hamill OP, Marty A, Neher E, Sakmann B, Sigworth J. Improved patch-clamp techniques for high resolution current recording from cells and cell-free membrane patches. Pflugers Arch. 1981;391:85–100. doi: 10.1007/BF00656997. [DOI] [PubMed] [Google Scholar]
- 26.Horrigan FT, Aldrich RW. Coupling between voltage sensor activation, Ca2+ binding and channel opening in large conductance (BK) potassium channels. J. Gen. Physiol. 2002;120:267–305. doi: 10.1085/jgp.20028605. [DOI] [PMC free article] [PubMed] [Google Scholar]
- 27.Cox DH, Aldrich RW. Role of the beta1 subunit in large-conductance Ca2+-activated K+ channel gating energetics. Mechanisms of enhanced Ca2+ sensitivity. J. Gen. Physiol. 2000;116:411–432. doi: 10.1085/jgp.116.3.411. [DOI] [PMC free article] [PubMed] [Google Scholar]
- 28.Cole P, McMahon B. Attributable risk percent in case-control studies. Br. J. Prev. Soc. Med. 1971;25:242–244. doi: 10.1136/jech.25.4.242. [DOI] [PMC free article] [PubMed] [Google Scholar]
- 29.Tseng-Crank J, et al. Cloning, expression, and distribution of a Ca2+-activated K+ channel beta-subunit from human brain. Proc. Natl. Acad. Sci. U. S. A. 1996;93:9200–9205. doi: 10.1073/pnas.93.17.9200. [DOI] [PMC free article] [PubMed] [Google Scholar]
- 30.Brenner R, Jegla TJ, Wickenden A, Liu Y, Aldrich RW. Cloning and functional characterization of novel large conductance calcium-activated potassium channel beta subunits, hKCNMB3 and hKCNMB4. J. Biol. Chem. 2000;275:6453–6461. doi: 10.1074/jbc.275.9.6453. [DOI] [PubMed] [Google Scholar]
- 31.Monks SA, Needleman DJ, Miller C. Helical structure and packing orientation of the S2 segment in the Shaker K+ channel. J. Gen. Physiol. 1999;113:415–423. doi: 10.1085/jgp.113.3.415. [DOI] [PMC free article] [PubMed] [Google Scholar]
- 32.Cui J, Cox DH, Aldrich RW. Intrinsic voltage dependence and Ca2+ regulation of mslo large conductance Ca-activated K+ channels. J. Gen. Physiol. 1997;109:647–673. doi: 10.1085/jgp.109.5.647. [DOI] [PMC free article] [PubMed] [Google Scholar]
- 33.Horrigan FT, Cui J, Aldrich RW. Allosteric voltage gating of potassium channels. I. Mslo ionic currents in the absence of Ca2+ J. Gen. Physiol. 1999;114:277–304. doi: 10.1085/jgp.114.2.277. [DOI] [PMC free article] [PubMed] [Google Scholar]
- 34.Horrigan FT, Aldrich RW. Allosteric voltage gating of potassium channels. II. Mslo channel gating charge movement in the absence of Ca2+ J. Gen. Physiol. 1999;114:305–336. doi: 10.1085/jgp.114.2.305. [DOI] [PMC free article] [PubMed] [Google Scholar]
- 35.Rothberg BS, Magleby KL. Gating kinetics of single large-conductance Ca2+-activated K+ channels in high Ca2+ suggest a two-tiered allosteric gating mechanism. J. Gen. Physiol. 1999;114:93–124. doi: 10.1085/jgp.114.1.93. [DOI] [PMC free article] [PubMed] [Google Scholar]
- 36.Rothberg BS, Magleby KL. Voltage and Ca2+ activation of single large-conductance Ca2+-activated K+ channels described by a two-tiered allosteric gating mechanism. J. Gen. Physiol. 2000;116:75–99. doi: 10.1085/jgp.116.1.75. [DOI] [PMC free article] [PubMed] [Google Scholar]
- 37.Magleby KL. Gating mechanism of BK (Slo1) channels: so near, yet so far. J. Gen. Physiol. 2003;121:81–96. doi: 10.1085/jgp.20028721. [DOI] [PMC free article] [PubMed] [Google Scholar]
- 38.Kullmann DL. The neuronal channelopathies. Brain. 2002;125:1177–1195. doi: 10.1093/brain/awf130. [DOI] [PubMed] [Google Scholar]
- 39.Perez GJ, Bonev AD, Nelson MT. Micromolar Ca2+ from sparks activates Ca2+-sensitive K+ channels in rat cerebral artery smooth muscle. Am. J. Physiol. Cell Physiol. 2001;281:C1769–C1775. doi: 10.1152/ajpcell.2001.281.6.C1769. [DOI] [PubMed] [Google Scholar]
- 40.Schubert R, Nelson MT. Protein kinases: tuners of the BKCa channel in smooth muscle. Trends Pharmacol. Sci. 2001;22:505–512. doi: 10.1016/s0165-6147(00)01775-2. [DOI] [PubMed] [Google Scholar]
- 41.Hanner M, et al. The beta subunit of the high conductance calcium-activated potassium channel. Identification of residues involved in charybdotoxin binding. J. Biol. Chem. 1998;273:16289–16296. doi: 10.1074/jbc.273.26.16289. [DOI] [PubMed] [Google Scholar]
- 42.Valverde MA, et al. Acute activation of Maxi-K channels (hSlo) by estradiol binding to the β subunit. Science. 1999;285:1929–1931. doi: 10.1126/science.285.5435.1929. [DOI] [PubMed] [Google Scholar]
- 43.Dick GM, Sanders KM. (Xeno)estrogen sensitivity of smooth muscle BK channels conferred by the regulatory beta1 subunit: a study of beta1 knockout mice. J. Biol. Chem. 2001;276:44835–44840. doi: 10.1074/jbc.M106851200. [DOI] [PubMed] [Google Scholar]


