

Abstract
Staphylococcus aureus grown in the presence of an alanine-racemase inhibitor was labeled with D-[1-13C]alanine and L-[15N]alanine to characterize some details of the peptidoglycan tertiary structure. Rotational-echo double-resonance NMR of intact whole cells was used to measure internuclear distances between 13C and 15N of labeled amino acids incorporated in the peptidoglycan, and from those labels to 19F of a glycopeptide drug specifically bound to the peptidoglycan. The observed 13C-15N average distance of 4.1 to 4.4 Å between D- and L-alanines in nearest-neighbor peptide stems is consistent with a local, tightly packed, parallel-stem architecture for a repeating structural motif within the peptidoglycan of S. aureus.
Keywords: alanine racemase, bacterial cell-wall tessera, glycopeptide antibiotic, REDOR, solid-state NMR
Introduction
Peptidoglycan (PG) is the major component of cell walls in bacteria. The chemical structure of PG varies from one bacterium to another, but all PG repeat units consist of a disaccharide of N-acetylglucosamine (NAG) and N-acetylmuramic acid (NAM), a peptide stem, and a crosslinking bridge connecting adjacent stems (Figure 1). In Staphylococcus aureus, the stem is a pentapeptide with the amino acid sequence, L-alanine-D-iso-glutamine-L-lysine-D-alanine-D-alanine, and the bridge is a pentaglycyl peptide (1). The PG lattice is formed in the final stage of PG biosynthesis by the cooperative action of a transglycosylase-transpeptidase (2). Although the chemical structure of PG is well known, the cross-linked three-dimensional PG lattice structure remains largely unknown because the complexity, heterogeneity, and size of the cell wall are incompatible with conventional structural methods such as x-ray diffraction and solution-state NMR.
Figure 1.

Chemical structure of S. aureus peptidoglycan (PG). The PG monomer is highlighted in gray. The monomer consists of disaccharide, stem, and bridge structures. A stem structure having the sequence, L-Ala-D-iso-Glu-L-Lys-D-Ala-D-Ala, is attached to N-acetylgluosamine (NAG) of the disaccharide unit. Cross-linking between monomers is formed between the N-terminus of the pentaglycyl bridge and the carbonyl carbon of D-Ala of the adjacent stem. Cross-linked stems terminate in a single D-Ala (stem on the left). The five-residue stem in the middle has no cross-link. A bridge-link is an amide bond between the ε nitrogen of L-Lys (3rd position of stem) to the carboxyl terminus of the bridge. The incorporation of 15N (blue dots) and 13C (red dots) isotopic labels identify stems and bridges.
Recently, cryo-electron tomography and atomic force microscopy (AFM) have been used to investigate the PG architecture of the bacterial cell-wall sacculus. These imaging techniques have provided invaluable morphological insights. Cryo-electron tomographic images of Gram-negavite Caulobacter crescentus sacculi by Jensen et al. (3) have shown that the PG strands are poorly ordered and loosely packed, but maintain an alignment running parallel to the direction of the outer membrane surface. AFM images of Escherichia coli sacculi have shown a thin layer of a disordered PG network with a surprisingly high number of pores whose diameters vary from 1 to 10 nm (4). These observations suggest that the PG in Gram-negatives does not adopt a “scaffold” arrangement (5) in which the glycan strands are aligned perpendicular to the cell-membrane surface.
The application of cryo-electron tomography and AFM in Gram-positives has had limited success because the substantially thickened cell wall complicates the analysis. Thus these imaging techniques have been limited to global assessments of morphological aspects of PG architecture and its role in the mechanisms of cell division in S. aureus and sporulation in Bacillus subtilis (6–8). Nevertheless, AFM images of B. subtilis sacculi (6) showed coiled morphology at the surface, which was attributed to PG strands forming a helical twist resembling coiled cables that are then assembled to form a complex “coiled-coil” architecture. Because neither AFM nor cryo-electron tomography can provide sub-nm resolution, fundamental structural constraints needed to solve PG tertiary structure (for example, whether two PG stems that are cross-linked run parallel or antiparallel to one another) still remain undetermined.
In the early models of PG architecture, the disaccharide was thought to adopt a chitin-like conformation with the PG forming a pleated-sheet structure (9, 10). In this model, the disaccharide has a periodicity of 20 Å, with a two-dimensional (planar) hydrogen-bond network between the glycans, as illustrated in Figure 2 (top). This chitin model was abandoned when Burge et al. (11) and Labischinski et al. (12) showed by x-ray diffraction of isolated PG and whole-cells of S. aureus that the glycan chains adopt an n-fold screw-axis helical conformation (Figure 2, middle). If n = 4 for example, the resulting 40-Å periodicity means that successive rotations of PG stems by 90° enable cross-links to form in all four directions in planes orthogonal to the glycan-chain elongation.
Figure 2.
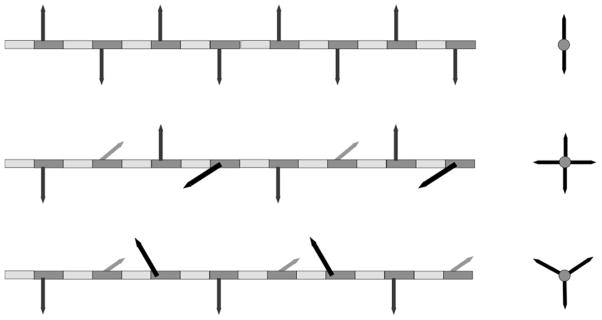
Schematic representations of disaccharide backbone arrangements proposed for the glycan chains of PG, adapted from reference (36). The repeating disaccharide is represented by the alternating dark gray (NAM) and light gray (NAG) boxes. PG stems are represented by arrows attached to NAM. The PG bridge structure is omitted for clarity. Side views of the proposed glycan conformations with periodicities of 20 Å (top), 40 Å (middle), and 30 Å (bottom) are shown on the left, and their end views on the right.
Recently a model of the PG lattice with a 3-fold screw-axis symmetry and a helical periodicity of 30 Å (Figure 2, bottom) was proposed by Mobashery et al. (13) based on the solution-state NMR analysis of a solubilized PG mimic. The mimic had two disaccharide repeats with peptide stems but no bridges. The Mobashery model features anti-parallel stems of neighboring repeat units and predicts loose packing of chains. When applied to the PG of S. aureus, this prediction is not consistent with the observed 13C spin diffusion from pentaglycyl bridging segments to nearby PG sugars, the latter identified by the 102-ppm chemical shift of their β-conformation anomeric carbons (14).
In this report, we examine some details of the PG tertiary structure in intact whole-cells of S. aureus using solid-state NMR. The PG was selectively labeled by growing bacteria in the presence of the alanine racemase inhibitor alaphosphin, in defined media containing D-[1-13C]alanine and L-[15N]alanine. Rotational-echo double-resonance (REDOR) NMR was used to determine heteronuclear dipolar coupling, hence internuclear distances, between the 13C and 15N labels in the PG stems, and from these labels to the 19F of a glycopeptide drug (eremomycin 4-p-fluorophenylpeperazide) bound specifically and rigidly to the PG lattice (15). The REDOR distance constraints are consistent with a model for local order in a repeating PG structural motif. Within this motif, the glycan chains have a 4-fold screw-axis helical conformation with a 40-Å periodicity, and have cross-linked stems that are parallel to one another and tightly packed. We show that the PG lattice of S. aureus can be assembled using the motif in such a way that membrane-bound protein complexes and other large functional units like murosomes (16) are accommodated.
Materials and Methods
Growth and labeling of whole cells
Starter culture of S. aureus (ATCC 6538P) grown overnight in 5 ml of trypticase soy broth at 37 °C with shaking at 250 rpm in an Environ-Shaker (Lab-Lines Instruments, Inc., Melrose Park, IL) was added (1% final volume) to two one-liter flasks each containing 250 mL of sterile defined media (17) where the natural abundance amino acid L-alanine was replaced by a combination of L-[15N]alanine and D-[1-13C]alanine (each, 0.1 g/L). This combination resulted in specific 13C and 15N labels in the pentapeptide stems of the PG of S. aureus (Figure 1). To prevent the scrambling of L-[15N]alanine and D-[1-13C]alanine through alanine racemase, alaphosphin (L-alanyl-L-1-aminoethylphosphonic acid), an alanine-racemase inhibitor, was added to a final concentration of 5 μg/ml prior to inoculation. A series of three samples was prepared. For the first sample no additional alaphosphin was added prior to harvest. For the second sample, after 2 hours of growth, a second “dose” of alaphosphin was added to a final concentration of 10 μg/ml. For the third sample, a third dose was added to reach a final concentration of 15 μg/ml. Even higher concentrations led to unacceptable inhibition in growth. Multiple levels of racemase inhibitor were used to test for minor scrambling. We will refer to the first sample as the “one-shot” alaphosphin sample, the second as the “two-shot” alaphosphin sample, and the third as the “three-shot” alaphosphin sample.
For all the three samples, S. aureus whole-cells were harvested after 6 hours of growth by centrifugation at 8,000 g for 10 min at 4 °C in a Sorvall GS-3 rotor. The cells were washed twice in 50 mL of ice-cold 40 mM triethanolamine buffer, pH 7.0, and then resuspended in 10 mL of 40 mM triethanolamine buffer and lyophilized. The main purpose of lyophilization was to reduce mobility which is best for distance determinations and structural characterization. We have compared lyophilized and frozen whole-cell samples before and obtained identical REDOR results (18). The lyophilized samples are easier to work with and give better quality spectra because of an improved filling factor.
Dipolar recoupling
REDOR is a solid-state NMR method that recouples heteronuclear dipolar interactions under magic-angle spinning (19) and so can be used to determine inter-nuclear distances. REDOR is a difference experiment in which two spectra are collected, one in the absence of heteronuclear dipolar coupling (full echo, S0 spectrum), and the other in the presence of the coupling (dephased echo, S spectrum). In the S0 spectrum, dipolar dephasing is refocused due to spatial averaging resulting from motion of the rotor in magic-angle spinning. In the S spectrum, the spin part of the dipolar interaction is manipulated by the application of rotor-synchronized dephasing π-pulses to prevent full refocusing. Dipolar evolution over the rotor period in the S spectrum results in a reduced peak intensity for a dipolar coupled spin pair. The difference in signal intensity (REDOR difference, ΔS = S0 – S) for the observed spin in the two parts of the REDOR experiment is directly related to the heteronuclear dipolar coupling from which the corresponding distance to the dephasing spin is determined.
Solid-state NMR spectrometer and REDOR Pulse Sequence
REDOR was performed using a 4.7-T static magnetic field produced by 89-mm bore Oxford (Cambridge, England) superconducting solenoid, and a transmission-line probe with a 17-mm long, 8.6-mm inner-diameter analytical coil and a Chemagnetics/Varian ceramic stator (Fort Collins, CO/Palo Alto, CA). The four radiofrequencies, proton (200 MHz), fluorine (188 MHz), carbon (50.3 MHz), and nitrogen (20.3 MHz) were mutually isolated by the positions of their tuning circuits along the transmission line, and simultaneously tuned to the single solonoidal analytical coil of the probe. Lyophilized whole-cell samples were contained in Chemagnetics/Varian 7.5-mm outer-diameter zirconia rotors. The rotors were spun at 5000 Hz (rotor period, Tr=200 Ts) with the speed under active control to within ±2 Hz. A Tecmag (Houston, TX) Libra pulse programmer controlled the spectrometer. The 1H radio-frequency pulses were produced by a 1-kW Kalmus Engineering Int. Ltd (Valencia, CA) power amplifier, and the 19F pulses by a 1-kW Dressler Hochfrequenztechnik Gmbh (Stolberg-Vicht, Germany) power amplifier. Radio frequency pulses for 13C and 15N were produced by 1-kW ENI (Andover, MA) LPI-10 power amplifiers. All four power amplifiers were under active control (20) to eliminate long-term drifts in the performance of the spectrometer due to component aging, minor changes in the temperature of the room, spinning gas, and the amplifiers. The S and S0 alternate-scan strategy compensated for short-term drifts. The π-pulse lengths were 10 μs for 19F, 13C, and 15N. Standard XY-8 phase cycling (21) was used for all refocusing observe-channel π pulses (inserted at the end of each rotor period during dipolar evolution) and dephasing π pulses (inserted in the middle of each rotor period) to compensate for pulse imperfections. Proton-carbon matched cross-polarization transfers were made in 2 ms at 50 kHz. The single-frequency proton dipolar decoupling was 98 kHz throughout dipolar evolution and data acquisition. The re-cycle delay period was 2 seconds.
Calculated REDOR dephasing
REDOR dephasing was calculated using the modified Bessel function expressions given by Mueller et al. (22) and de la Caillerie and Fretigny (23) for a spin-1/2 pair. A plot of ΔS/S0 with respect to time (t=NTr), yields the dipolar coupling constant and hence the internuclear distance (rIS). The distance and spin-pair concentration (asymptotic dephasing maximum) were allowed to vary to minimize the root-mean-square deviation between the experimental and calculated dephasing (24).
Results
Cell growth in the presence of alaphosphin
S. aureus growth in the presence of alaphosphin (alanine racemase inhibitor) at 5 μg/ml required the presence of both D and L-forms of alanine in the defined media (Figure S1). When the initial alaphosphin concentrations exceeded 5 μg/ml, a prolonged lag phase and retarded growth resulted. Thus, samples were prepared by initially growing S. aureus in 5 μg/ml of alaphosphin and then adding alaphosphin (in increments of 5 μg/ml) during growth (Figure S1, arrows). Optical density measurements for S. aureus grown in the presence of alaphosphin are sometimes misleading because of cell clumping, so cell mass at the time of harvest was used to measure S. aureus growth.
REDOR of whole cells
13C{15N} REDOR spectra after dipolar evolution of 12.8 ms of S. aureus grown in defined media containing D-[1-13C]alanine, L-[15N]alanine are shown in Figure 3. The natural-abundance 13C contribution to dephasing at 175 ppm from 15N-labeled L-alanyl residues can be estimated from the ΔS associated with the natural-abundance 13C peaks at 17 ppm (alanyl methyl) and 54 ppm (alanyl α-carbon). Dephasing for one- and two-bond 13C-15N coupling associated with each 15N-alanyl residue is complete after the 12.8 ms of dipolar evolution, so the expected natural-abundance carbonyl-carbon contribution to the dephasing at 175 ppm (arising from peptide bonds to 15N) approximates those from the alanyl methyl and alanyl α-carbons in the ΔS spectrum. This contribution is 20% of the 175-ppm ΔS after 12.8 ms of dipolar evolution.
Figure 3.
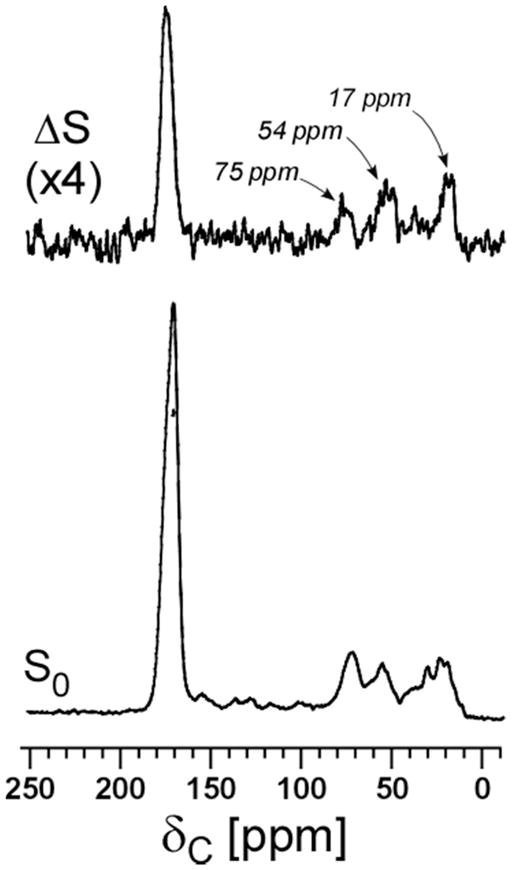
13C{15N} REDOR spectra of whole cells of S. aureus grown on media containing D-[1-13C]alanine and L-[15N]alanine with the alanine racemase inhibitor, alaphosphin (5 μg/ml), after dipolar evolution of 12.8 msec. The full-echo spectrum (S0) is at the bottom of the figure, and the REDOR difference (ΔS) is at the top. The dephasing of natural-abundance 13C peaks at 75, 54, and 17 ppm are apparent in the ΔS spectrum. Magic-angle spinning was at 5000 Hz.
Enlargements of the carbonyl-carbon region for S0 and ΔS are shown in Figure S2. With alaphosphin addition, the lineshape of the peak centered at 175 ppm in the S0 spectra skews to high field because of increased D-[1-13C]alanine incorporation in cell-wall teichoic acid at 172 ppm (25). In the ΔS spectra (Figure S2, middle), the lineshape broadens with alaphosphin addition but there is no skewing. A double-difference obtained by scaling ΔS for the maximum cancellation of S0 results in a single ester carbonyl-carbon peak near 170 ppm, which we assign to label in wall teichoic acid.
13C{15N} REDOR dephasing (ΔS/S0) of the 175-ppm peak is plotted in Figure 4 (open circles) as a function of dipolar evolution for all three samples of S. aureus. The calculated dephasings for two distances (1.3 and 4.4 Å) are shown by the dashed lines. The calculated total dephasing as a function of alaphosphin addition is shown by the solid lines. These calculations assumed a minor contribution from a 1.3-Å single-distance 13C-15N pair, and a major contribution from a narrow Gaussian distribution of 13C-15N distances with an average value between 4.2 and 4.4 Å (Table 1). The asymptotic dephasing limits for both contributions decreased with increasing alaphosphin concentration (Table 1).
Figure 4.

13C{15N} REDOR dephasing (ΔS/S0) of whole cells of S. aureus grown on media containing D-[1-13C]alanine and L-[15N]alanine, with increasing concentrations of the alanine racemase inhibitor, alaphosphin, as a function of the dipolar evolution (open circles). The calculated dephasings for two single-distance components are shown as dashed lines. The total dephasing (solid lines) is a weighted sum of calculations for a single distance, and for a narrow Gaussian distribution of distances (see Table 1 for details). The error in the integrated REDOR difference is estimated as the diameter of the open-circle symbols.
Table 1.
Single distances and distributions of distances associated with REDOR dephasing (ΔS/So) of labeled whole cells of S. aureus grown in the presence of the alanine racemase inhibitor, alaphosphin.
| labels | alaphosphin [shots] a | figure references | NMR expmt | r1 [Å] | f b | dephasing limit c | r2 [Å] | 1-f | dephasing limit d | σ2 e |
|---|---|---|---|---|---|---|---|---|---|---|
| D-[1-13C]Ala plus L-[15N]Ala | 1 | 3,4, S3 | C{N} | 1.3 | .14 f | .032 | 4.2 | .86 | .23 | .36 |
| 2 | 1.3 | .10 f | .018 | 4.3 | .90 | .18 | 1.0 | |||
| 3 | 1.3 | .10 f | .012 | 4.4 | .90 | .12 | 2.3 | |||
| 1 | S2, S4, S5 | N{C} | 1.3 | .10 f | .022 | 4.1 | .90 | .22 | 1.4 | |
| … plus LCTA-1110 | 2 | 5 | C{F} | 4.9 | .24 | .015 | 8.7 | .76 | .05 | – g |
| S6 (left), S7 | N{F} | 5.8 | 1 | .017 | – | – | – | – | ||
| L-[ε-15N]Lys plus LCTA-1110 | 2 | S6 (right), S8 | N{F} | – | – | – | 7.9 | 1 | .09 | 9 |
see Methods.
fraction of contribution to total dephasing by single-distance pair.
asymptotic dephasing limit for single-distance pair.
asymptotic dephasing limit for distribution of distances.
variance of Gaussian distribution.
estimated from initial step in dephasing (see Figure 4).
no distribution..
15N{13C} REDOR spectra of S. aureus grown in the presence of alaphosphin (5 μg/ml) after 48 Tr (9.6 ms) are shown in Figure S4. The amide-alanyl nitrogen of L-[15N]alanine at 95 ppm is dephased by 9.4%. 15N{13C} REDOR dephasing (open circles) plotted as a function of dipolar evolution is shown in Figure S5. The solid line is the calculated total dephasing for two contributions, one from a single 15N-13C distance of 1.3 Å, and the other from a narrow Gaussian distribution of distances with a 4.1-Å average value (see Table 1 for details). The 15N{13C} REDOR asymptotic dephasing limit for the 4.1-Å component (22%) is consistent with the expected limit, which is equal to the product of the fraction of L-alanine incorporated in whole cells found in PG (25%) (26), and the estimated isotopic enrichment of D-[1-13C]alanine for growth in the presence of alaphosphin (100%). The expected-limit calculation assumes that each L-alanine has on average one nearest-neighbor D-alanine. The 15N-13C distance of 4.1 Å from 15N{13C} REDOR is consistent with the 4.4-Å distance from 13C{15N} REDOR (Table 1).
REDOR of LCTA-1110 complexed to labeled whole cells
13C{19F} REDOR dephasing of LCTA-1110 complexed with whole cells S. aureus grown on media containing D-[1-13C]alanine and alaphosphin is shown in Figure 5. The calculated dephasing for a single 13C-19F distance (solid red line) does not result in a match with experiment. The rapid dephasing during short dipolar evolution times (<5 ms) and slower dephasing for longer dipolar evolution times (>20 ms) are clear indications of multiple distances. The calculated individual dephasings for two C-F distances of 4.9 Å (24% contribution) and 8.7 Å (76% contribution), with dephasing limits of 1.5 and 5%, respectively (Table 1), are shown by the dashed lines in Figure 5. The solid black line is the total dephasing for the combined single-distance pairs and is a match with experiment. (Seven of eleven experimental data points are on the calculated curve.)
Figure 5.

13C{19F} REDOR dephasing (ΔS/S0) of 19F-labeled LCTA-1110 complexed to whole cells of S. aureus grown on media containing D-[1-13C]alanine and L-[15N]alanine, with the alanine racemase inhibitor, alaphosphin (10 μg/ml), as a function of the dipolar evolution (open circles). The calculated dephasings for two single-distance components are shown as dashed lines, and the combined dephasing curve (24% shorter-distance component and 76% longer-distance component), as a solid line. The calculated dephasing for a single 13C-19F distance of 8.1 Å does not match experiment.
Distances from the 19F of LCTA-1110 to 15N labels of alanine and lysine in PG are reported in Table 1 with details of the 15N{19F} REDOR measurements given in the supporting information (Figures S6–S8).
Discussion
REDOR of whole cells
The 1.3-Å minor-component dephasing of Figure 4 is that expected for natural-abundance 13C directly bonded to a 15N label, as discussed above (see text associated with Figure 3). There are at least four possibilities for the 4.4-Å major-dephasing component. The first possibility is scrambling of labels by alanine racemase. If alanine racemase were somehow active despite the presence of alaphosphin, conversion of D-[1-13C]alanine to L-[1-13C]alanine, and L-[15N]alanine to D-[15N]alanine would occur. Then L-[15N]alanine-L-[1-13C]alanine pairs (in proteins) and D-[15N]alanine-D-[1-13C]alanine pairs (in PG), would, depending on secondary structure, have 13C-15N distances ranging from 4.6 to 5.8 Å, close to the observed 4.4-Å distance. However, equally likely would be 13C-15N distances of 1.3-Å (Figure S3, inset). That is, there would be a 50% contribution from the shorter-distance component, and 50% from the longer-distance component. The expected 13C{15N} dephasing from this situation (Figure S3, solid line) does not match experiment (open circles, alaphosphin, 5 μg/ml). In addition, D-[15N]alanine derived from racemase-scrambled L-[15N]alanine, and incorporated into teichoic acid, would result in a significant amine-nitrogen peak. This is not observed (Figure 6). We therefore conclude that there is no significant alanine scrambling when S. aureus is grown in the presence of alaphosphin, consistent with earlier observations (25, 27). Minor scrambling of a few percent by alanine racemase is possible, as well as minor scrambling of the 15N label from L-alanine to other L-amino acids by amino transferase.)
Figure 6.

15N CPMAS NMR spectra of whole cells S. aureus grown on defined media containing L-[15N]alanine in the absence (left) and presence (right) of the alanine racemase inhibitor, alaphosphin (5 μg/ml). When alaphosphin is not present, the 15N label of L-alanine is scrambled and appears in the D-alanine of teichoic acid. The 15N chemical-shift scale is referenced to solid ammonium sulfate.
The second possibility for the measured 13C-15N distance of 4.4 Å is that it arises from coupling between L-[15N]alanine and the D-[1-13C]alanine on the same stem. However, even in compact stem conformations, these intra-stem distances are estimated to exceed 10 Å (12), far greater than the observed distance.
The third possibility is that the 13C-15N contact is between D-alanine of teichoic acid and L-alanine of a nearby PG stem. However, the chemical shift of the 13C{15N} REDOR ΔS (Figure S2) matches that of a peptide carbonyl carbon (175 ppm) and not that of a teichoic-acid ester carbonyl carbon (170 ppm) (25).
The fourth possibility is the one that we support: the measured distance of 4.4 Å (Figure 4) is between two PG stems. That is, the 4.4-Å distance (with a simple Gaussian distribution, vide infra) corresponds to proximity of L-[15N]alanine of one stem and D-[1-13C]alanine of a nearest-neighbor stem. Both fourth and fifth-position 13C-labeled D-alanines are probably involved, as reflected in the broad ΔS linewidth.
With increase in alaphosphin concentration, the total asymptotic dephasing limit for the 4.4-Å contribution used in the fitting calculation decreases from 23% to 12% (Table 1). We attribute this decrease to an increased contribution to S0 from D-[1-13C]alanine in wall teichoic acid (Figure S2). The origin of this increase in D-Ala content of wall teichoic acid is unknown but may be related to the observed clumping of cells during growth in the presence of alaphosphin. For 60% cross-linking, the average number of D-alanines per stem is 1.4. If we assume twice as much labeled D-alanine in teichoic acid as in PG (25), we estimate the maximum 13C{15N} dephasing is [(1.4)/(1.4+2.8)] multiplied by the 15N isotopic enrichment of about 50% (28), or an asymptotic limit of 17%, which is in the middle of the experimental range of 12–23% (Table 1).
Peptidoglycan architecture of S. aureus
Representations of PG tertiary structures with a 4-fold screw axis and 40-Å periodicities for S. aureus are shown in Figure 7 with antiparallel peptide stems (left) and parallel stems (right). The PG segments in these models each consist of 4 glycan chains (gray) with 5 stems per glycan chain. The first and fifth stems are highlighted in red and numbered as visual aids. The PG-bridge segments (pink) provide cross-links between stems. In both models (i) all glycan chains have same the same helicity, (ii) all glycan chains are parallel, and (iii) the relative conformations of the bridges and stems are identical for all PG units. More complicated models are obviously possible. We will restrict our attention to a regular, simple model to see what general conclusions we can extract from the REDOR data.
Figure 7.

(Top) Peptidoglycan architecture for S. aureus with anti-parallel (left) and parallel (right) stems and a 4-fold glycan symmetry axis. Stems are highlighted in dark red to identify the 40-Å glycan periodicity. Bridges are in pink. Orientations of selected stems (red and green) relative to the glycan backbones (gray) are numbered for clarity. (Bottom) Tesserae and pores for the peptidoglycan architectures at the top of the figure. A tessera is a hypothetical PG cell-unit structure defined by two glycan chains connected by two pairs of cross-links. Tesserae for the architectures at the top of the figure are outlined in yellow. The tesserae at the bottom of the figure are two-dimensional projections, in which disaccharides are represented in alternating shades of gray with PG stems as arrows. The inter-bridge structures are omitted for clarity. A true tessera structure requires that the orientation of cross-linked PG stems is antiparallel. For the parallel-stem architecture, we define a pseudo-tessera (yellow box) defined by two pairs of parallel PG stems.
The maximum cross-linking for the S. aureus PG model on the left is 50%, and on the right, 100%. Complete 100% cross-linking means that each stem is both a cross-link donor (the bridge attached to L-Lys is part of a cross-link) and acceptor (D-Ala-4 is part of a cross-link). The measured cross-linking for whole-cells of S. aureus harvested in stationary phase is estimated at about 70%, but there are regions in the cell wall with significantly higher cross-linking as determined by NMR (25). In addition, LC/MS analyses of muramidase-digested PG fragments of S. aureus have shown that over 70% of the PG fragments were oligomers larger than trimers, and some even larger than 8-mers (29, 30). The only tertiary structure that is consistent with these high levels of cross-linking and high muramidase-digested molecular-weight oligomers has cross-linked stems in the same plane parallel to one another (Figure 7, right).
Distance constraints on the peptidoglycan lattice of S. aureus
A parallel-stem model for the S. aureus PG has been used by us before to interpret proximities of stems and glycans in 13C-13C spin diffusion experiments (31). We show a cross-section of nine glycan chains in a 3x3 matrix for this model in Figure 8 (top right). Propagation of the glycan backbones (represented by gray circles) is perpendicular to the plane of the paper. The stems and bridges are represented by green and red rectangles, respectively. Two of the PG-units are depicted without bridges attached consistent with the observation for isolated cell walls of S. aureus that some PG units have no bridge attached (26). Details of the highlighted region (light blue box) are shown in the inset where the 13C-15N REDOR distance measurement (Table 1) fixes the average position of 15N (dark blue ball) relative to 13C (yellow balls). The short inter-glycan 13C-15N distance of about 4 Å requires that all of the co-planar PG-stems are parallel with respect to each other and share a common orientation, resulting in a compact structure (Figure 7, top right).
Figure 8.

(Top right) A cross-section of the proposed PG-tertiary structure for S. aureus. The cross-section consists of nine glycan chains in a 3x3 matrix where the glycan backbones (represented by gray circles) are propagating perpendicular to the plane of the paper. The stems and bridges are represented by green and red rectangles, respectively. A cartoon of the glycopeptide LCTA-1110 (bottom right) is shown bound to a D-Ala-D-Ala uncross-linked peptide stem based on the lattice model of ref. 32. Details of the highlighted region of the top-right panel are shown in the light-blue insert (top left). REDOR distance measurements (blue numbers) connect labels by red arrows. (Bottom left) Chemical structure of LCTA-1110.
The glycopeptide LCTA-1110 (Figure 8, bottom left) is a sensitive probe of PG structure because of the rigidity of its D-Ala-D-Ala binding cleft, and the rigidity of the C-terminus 19F-containing arylpiperazine. The drug binds preferentially (32) to a D-Ala-D-Ala uncross-linked peptide stem (Figure 8, bottom right). This results in a near-planar geometry for the 19F of LCTA-1110, the 15N of the stem to which the glycopeptide is bound, and the 13C label(s) of the nearest-neighbor peptide stem (Figure 8, blue inset). The corresponding F-N distance is about 6 Å, and the F-C distances, 5 and 9 Å (Table 1). The glycopeptide fluorine is more likely to be coupled to a D-Ala-4 (longer distance) than a D-Ala-5 (shorter distance) because the high degree of cross-linking makes adjacent 5-residue stems unlikely, consistent with different dephasing limits for the two distances (Table 1). The distance from the glycopeptide 19F label to the bridge-link of the binding stem (Figure 8, bottom right, blue-red junction) is 8 Å (Table 1), which partially constrains the orientation of stem and attached bridge. All of the REDOR distances established by the LCTA-1110 binding are consistent with co-planar tightly packed parallel stems.
The Pseudo-Tessera
The consequence of cross-linked PG stems oriented anti-parallel with respect to one another is that a tessera can be defined (33). (A tessera is an individual tile in a mosaic.) The tessera of Figure 7 (top left) is formed by two glycan chains connected by two pairs of cross-links (yellow outline). An idealized 2D projection is also shown in Figure 7 (bottom left), where NAG and NAM are represented by rectangular blocks with alternating shades of gray, the stems are represented as dark pointed lines, and all the bridges have been omitted for clarity.
A tessera clearly forms when the cross-linked PG stems have an antiparallel orientation but not when they are parallel. For the parallel-stem architecture of S. aureus, we are led to define a “pseudo-tessera” structure, a cell unit formed by two pairs of adjacent cross-linked parallel stems (Figure 7, top right, yellow outline; bottom right, yellow rectangle). The approximate diameter of this pseudo-tessera is less than 20 Å, which is significantly smaller than hypothetical tessera diameters of 52 Å (4) and 70 Å (13) that have been proposed before for S. aureus. In the parallel-stem architecture, the PG pore size, a cell unit defined perpendicular to the glycan chain propagation (Figure 7, bottom right, green rectangles), is also reduced relative to that in the antiparallel-stem architecture. In fact, the parallel-stem model (14) of Figure 7 has been criticized (34) because the effective pore size seems too small for proper functioning of the cell wall. We address this criticism in the following section.
Building blocks for peptidoglycan
The idealized parallel-stem model of PG architecture for S. aureus in Figures 7 and 8 represents a tightly packed, highly cross-linked homogeneous lattice. However, we know that some stems are without bridges and about 30% of pentaglycyl segments are not cross-linked (32) so the lattice must contain some loosely packed glycan chains separating regions of more tightly packed chains. In addition, the average number of glycan disaccharide repeats (35) is only 6; that is, chain ends represent one-third of the glycan repeat units. The PG is a therefore a complex assembly of heterogeneous parts consisting of glycan chains of varying lengths (and possibly orientations), containing subunits of varying chemical composition.
Nevertheless, the REDOR distances specify that a frequently repeating component of the PG of S. aureus retains local order. We call this component the PG structural motif. Figures 7 and 8 illustrate this structural motif of three to five glycan chains (each about four to six disaccharides in length) with a tightly packed parallel orientation of stems.
We view the structural motif as the building block of the S. aureus PG. We envision that assembly of these blocks involves loosening of the overall lattice, which is necessary for accommodation of the numerous organelles that are built within the cell wall (16). The blocks are arranged much like the bricks of a vaulted multi-layered brick wall with spaces between and within layers and with openings reserved for windows and portals (Figure 9). Thus, the cell wall is a mix of open and closed spaces, the latter hydrophobic and the former, hydrophilic. Teichoic-acid chains (as well as some nutrients) can weave through and between the hydrophilic spaces. An occasional inter-block covalent cross-link may stabilize the lattice just as anchoring rods stabilize a brick wall. The PG lattice in S. aureus can be integrated into the cell wall by the arrangement of structural motifs around membrane-anchored protein complexes or the large extraplasmic wall organelles (murosomes) capable of cutting inner PG layers and initiating new cross walls (16).
Figure 9.

Schematic representation of the peptidoglycan of S. aureus as a multi-layered brick wall. Each brick is a structural motif (determined by REDOR NMR) of just a few glycan chains with tightly packed parallel stems (see Figure 7). One side of the structure is imagined as the cell surface and the other, the cell membrane. Proteins and teichoic acids are accommodated by portals, spacings, and gaps in the wall.
Supplementary Material
Acknowledgments
This paper is based on work supported by the National Institutes of Health under grant number EB002058. The authors thank S. S. Solov’eva for the preparation of LCTA-1110.
Abbreviations
- 13C{19F} or C{F}
carbon-channel observation with fluorine dephasing
- 13C{15N} or C{N}
carbon-channel observation with nitrogen dephasing
- NAG
N-acetylglucosamine
- NAM
N-acetylmuramic acid
- 15N{13C} or N{C}
nitrogen-channel observation with carbon dephasing
- 15N{19F} or N{F}
nitrogen-channel observation with fluorine dephasing
- LCTA-1110
N-(4-(4-chlorophenyl)benzyl)chloroeremomycin
- PG
peptidoglycan
- REDOR
rotational-echo double resonance
Footnotes
(i) Growth curves of S. aureus in the presence of alaphosphin; (ii) 13C{15N} and 15N{13C} REDOR spectra of S. aureus in the presence of alaphosphin on defined media containing 13C and 15N-labeled amino acids; (iii) 15N{13C} REDOR dephasing as a function of dipolar evolution time for the alaphosphin 1-shot sample of Figure 4; (iv) 15N{19F} REDOR spectra of 19F-labeled LCTA-1110 complexed to whole cells of S. aureus grown on media containing 15N-labeled amino acids; (v) 15N{19F} REDOR dephasing associated with these spectra. This material is available free of charge via the Internet at http://pubs.acs.org.
References
- 1.Rogers HJ, Ward JB, Perkins HR. Microbial cell walls and membranes. Chapman and Hall; London; New York: 1980. [Google Scholar]
- 2.van Heijenoort J. Formation of the glycan chains in the synthesis of bacterial peptidoglycan. Glycobiology. 2001;11:25R–36R. doi: 10.1093/glycob/11.3.25r. [DOI] [PubMed] [Google Scholar]
- 3.Gan L, Chen S, Jensen GJ. Molecular organization of Gram-negative peptidoglycan. Proc Natl Acad Sci USA. 2008;105:18953–18957. doi: 10.1073/pnas.0808035105. [DOI] [PMC free article] [PubMed] [Google Scholar]
- 4.Turner RD, Hurd AF, Cadby A, Hobbs JK, Foster SJ. Cell wall elongation mode in Gram-negative bacteria is determined by peptidoglycan architecture. Nat Commun. 2013;4:1496. doi: 10.1038/ncomms2503. [DOI] [PMC free article] [PubMed] [Google Scholar]
- 5.Dmitriev BA, Toukach FV, Schaper KJ, Holst O, Rietschel ET, Ehlers S. Tertiary structure of bacterial murein: the scaffold model. J Bacteriol. 2003;185:3458–3468. doi: 10.1128/JB.185.11.3458-3468.2003. [DOI] [PMC free article] [PubMed] [Google Scholar]
- 6.Hayhurst EJ, Kailas L, Hobbs JK, Foster SJ. Cell wall peptidoglycan architecture in Bacillus subtilis. Proc Natl Acad Sci USA. 2008;105:14603–14608. doi: 10.1073/pnas.0804138105. [DOI] [PMC free article] [PubMed] [Google Scholar]
- 7.Turner RD, Ratcliffe EC, Wheeler R, Golestanian R, Hobbs JK, Foster SJ. Peptidoglycan architecture can specify division planes in Staphylococcus aureus. Nat Commun. 2013;1:26. doi: 10.1038/ncomms1025. [DOI] [PubMed] [Google Scholar]
- 8.Tocheva EI, Lopez-Garrido J, Hughes HV, Fredlund J, Kuru E, Vannieuwenhze MS, Brun YV, Pogliano K, Jensen GJ. Peptidoglycan transformations during Bacillus subtilis sporulation. Mol Microbiol. 2013 doi: 10.1111/mmi.12201. [DOI] [PMC free article] [PubMed] [Google Scholar]
- 9.Kelemen MV, Rogers HJ. Three-dimensional molecular models of bacterial cell wall mucopeptides (peptidoglycans) Proc Natl Acad Sci U S A. 1971;68:992–996. doi: 10.1073/pnas.68.5.992. [DOI] [PMC free article] [PubMed] [Google Scholar]
- 10.Braun V, Gnirke H, Henning U, Rehn K. Model for the structure of the shape-maintaining layer of the Escherichia coli cell envelope. J Bacteriol. 1973;114:1264–1270. doi: 10.1128/jb.114.3.1264-1270.1973. [DOI] [PMC free article] [PubMed] [Google Scholar]
- 11.Burge RE, Fowler AG, Reaveley DA. Structure of the peptidogylcan of bacterial cell walls. I J Mol Biol. 1977;117:927–953. doi: 10.1016/s0022-2836(77)80006-5. [DOI] [PubMed] [Google Scholar]
- 12.Labischinski H, Barnickel G, Bradaczek H, Giesbrecht P. On the secondary and tertiary structure of murein. Low and medium-angle X-ray evidence against chitin-based conformations of bacterial peptidoglycan. Eur J Biochem. 1979;95:147–155. doi: 10.1111/j.1432-1033.1979.tb12949.x. [DOI] [PubMed] [Google Scholar]
- 13.Meroueh SO, Bencze KZ, Hesek D, Lee M, Fisher JF, Stemmler TL, Mobashery S. Three-dimensional structure of the bacterial cell wall peptidoglycan. Proc Natl Acad Sci USA. 2006;103:4404–4409. doi: 10.1073/pnas.0510182103. [DOI] [PMC free article] [PubMed] [Google Scholar]
- 14.Sharif S, Kim SJ, Schaefer J. Staphylococcus aureus peptidoglycan tertiary structure from carbon-13 spin diffusion. J Am Chem Soc. 2009;131:7023–7030. doi: 10.1021/ja808971c. [DOI] [PMC free article] [PubMed] [Google Scholar]
- 15.Kim SJ, Schaefer J. Hydrophobic side-chain length determines activity and conformational heterogeneity of a vancomycin derivative bound to the cell wall of Staphylococcus aureus. Biochemistry. 2008;47:10155–10161. doi: 10.1021/bi800838c. [DOI] [PMC free article] [PubMed] [Google Scholar]
- 16.Giesbrecht P, Kersten T, Maidhof H, Wecke J. Staphylococcal cell wall: morphogenesis and fatal variations in the presence of penicillin. Microbiol Mol Biol Rev. 1998;62:1371–1414. doi: 10.1128/mmbr.62.4.1371-1414.1998. [DOI] [PMC free article] [PubMed] [Google Scholar]
- 17.Kim SJ, Matsuoka S, Patti GJ, Schaefer J. Vancomycin derivative with damaged D-Ala-D-Ala binding cleft binds to cross-linked peptidoglycan in the cell wall of Staphylococcus aureus. Biochemistry. 2008;47:3822–3831. doi: 10.1021/bi702232a. [DOI] [PMC free article] [PubMed] [Google Scholar]
- 18.Toke O, Maloy WL, Kim SJ, Blazyk J, Schaefer J. Secondary Structure and Lipid Contact of a Peptide Antibiotic in Phospholipid Bilayers by REDOR. Biophys J. 2004;87:662–674. doi: 10.1529/biophysj.103.032706. [DOI] [PMC free article] [PubMed] [Google Scholar]
- 19.Gullion T, Schaefer J. Rotational-echo double-resonance NMR. J Magn Reson. 1989;81:196–200. doi: 10.1016/j.jmr.2011.09.003. [DOI] [PubMed] [Google Scholar]
- 20.Stueber D, Mehta AK, Chen Z, Wooley KL, Schaefer J. Local order in polycarbonate glasses by 13C{19F} Rotational-Echo Double-Resonance NMR. J Polym Sci, Part B: Polym Phys. 2006;44:2760–2775. [Google Scholar]
- 21.Gullion T, Baker DB, Conradi MS. New, compensated Carr-Purcell sequences. J Magn Reson. 1990;89:479–484. [Google Scholar]
- 22.Mueller KT, Jarvie TP, Aurentz DJ, Roberts BW. The REDOR transform: direct calculation of internuclear couplings from dipolar-dephasing NMR data. Chem Phys Lett. 1995;242:535–542. [Google Scholar]
- 23.de la Caillerie J-BdE, Fretigny C. Analysis of the REDOR signal and inversion. J Magn Reson. 1998;133:273–280. doi: 10.1006/jmre.1998.1462. [DOI] [PubMed] [Google Scholar]
- 24.O’Connor RD, Schaefer J. Relative CSA-dipolar orientation from REDOR sidebands. J Magn Reson. 2002;154:46–52. doi: 10.1006/jmre.2001.2461. [DOI] [PubMed] [Google Scholar]
- 25.Cegelski L, Steuber D, Mehta AK, Kulp DW, Axelsen PH, Schaefer J. Conformational and quantitative characterization of oritavancin-peptidoglycan complexes in whole cells of Staphylococcus aureus by in vivo 13C and 15N labeling. J Mol Biol. 2006;357:1253–1262. doi: 10.1016/j.jmb.2006.01.040. [DOI] [PubMed] [Google Scholar]
- 26.Kim SJ, Cegelski L, Studelska DR, O’Connor RD, Mehta AK, Schaefer J. Rotational-echo double resonance characterization of vancomycin binding sites in Staphylococcus aureus. Biochemistry. 2002;41:6967–6977. doi: 10.1021/bi0121407. [DOI] [PubMed] [Google Scholar]
- 27.Kim SJ, Cegelski L, Stueber D, Singh M, Dietrich E, Tanaka KS, Parr TR, Far AR, Schaefer J. Oritavancin exhibits dual mode of action to inhibit cell-wall biosynthesis in Staphylococcus aureus. J Mol Biol. 2008;377:281–293. doi: 10.1016/j.jmb.2008.01.031. [DOI] [PMC free article] [PubMed] [Google Scholar]
- 28.Sharif S, Kim SJ, Labischinski H, Schaefer J. Characterization of peptidoglycan in fem-deletion mutants of methicillin-resistant Staphylococcus aureus by solid-state NMR. Biochemistry. 2009;48:3100–3108. doi: 10.1021/bi801750u. [DOI] [PMC free article] [PubMed] [Google Scholar]
- 29.Rohrer S, Ehlert K, Tschierske M, Labischinski H, Berger-Bachi B. The essential Staphylococcus aureus gene fmhB is involved in the first step of peptidoglycan pentaglycine interpeptide formation. Proc Natl Acad Sci USA. 1999;96:9351–9356. doi: 10.1073/pnas.96.16.9351. [DOI] [PMC free article] [PubMed] [Google Scholar]
- 30.Snowden MA, Perkins HR. Peptidoglycan cross-linking in Staphylococcus aureus An apparent random polymerisation process. Eur J Biochem. 1990;191:373–377. doi: 10.1111/j.1432-1033.1990.tb19132.x. [DOI] [PubMed] [Google Scholar]
- 31.Sharif S, Singh M, Kim SJ, Schaefer J. Staphylococcus aureus peptidoglycan tertiary structure from carbon-13 spin diffusion. J Am Chem Soc. 2009;131:7023–7030. doi: 10.1021/ja808971c. [DOI] [PMC free article] [PubMed] [Google Scholar]
- 32.Kim SJ, Cegelski L, Preobrazhenskaya M, Schaefer J. Structures of Staphylococcus aureus cell-wall complexes with vancomycin, eremomycin, and chloroeremomycin derivatives by 13C{19F} and 15N{19F} rotational-echo double resonance. Biochemistry. 2006;45:5235–5250. doi: 10.1021/bi052660s. [DOI] [PMC free article] [PubMed] [Google Scholar]
- 33.Koch AL. The three-for-one model for gram-negative wall growth: a problem and a possible solution. FEMS Microbiol Lett. 1998;162:127–134. doi: 10.1111/j.1574-6968.1998.tb12989.x. [DOI] [PubMed] [Google Scholar]
- 34.Vollmer W, Seligman SJ. Architecture of peptidoglycan: more data and more models. Trends Microbiol. 2010;18:59–66. doi: 10.1016/j.tim.2009.12.004. [DOI] [PubMed] [Google Scholar]
- 35.Boneca IG, Huang ZH, Gage DA, Tomasz A. Characterization of Staphylococcus aureus cell wall glycan strands, evidence for a new beta-N-acetylglucosaminidase activity. J Biol Chem. 2000;275:9910–9918. doi: 10.1074/jbc.275.14.9910. [DOI] [PubMed] [Google Scholar]
- 36.Vollmer W, Holtje JV. The architecture of the murein (peptidoglycan) in gram-negative bacteria: vertical scaffold or horizontal layer(s)? J Bacteriol. 2004;186:5978–5987. doi: 10.1128/JB.186.18.5978-5987.2004. [DOI] [PMC free article] [PubMed] [Google Scholar]
Associated Data
This section collects any data citations, data availability statements, or supplementary materials included in this article.