

Significance
A conversion between macromolecular shapes—a conformational change—is usually the mechanism that gives function to biological macromolecules. Single-molecule force spectroscopy probes conformational changes by applying force to individual macromolecules and recording their response, or “mechanical fingerprints”, in the form of force–extension curves. The mechanical fingerprints of proteins, nucleic acids, and their assemblies often feature elaborate signatures that reflect the complexity of the underlying biomolecular interactions. This study introduces a transformation that converts—in a model-free way—the mechanical fingerprints of a complex system into a map of force-dependent transition rates. Once transformed into a rate map, the mechanical fingerprints can be interpreted in terms of the activation barriers and the intrinsic timescales of a biological process.
Keywords: complex interactions, single molecule, force spectroscopy, kinetic rate
Abstract
Biological processes are carried out through molecular conformational transitions, ranging from the structural changes within biomolecules to the formation of macromolecular complexes and the associations between the complexes themselves. These transitions cover a vast range of timescales and are governed by a tangled network of molecular interactions. The resulting hierarchy of interactions, in turn, becomes encoded in the experimentally measurable “mechanical fingerprints” of the biomolecules, their force–extension curves. However, how can we decode these fingerprints so that they reveal the kinetic barriers and the associated timescales of a biological process? Here, we show that this can be accomplished with a simple, model-free transformation that is general enough to be applicable to molecular interactions involving an arbitrarily large number of kinetic barriers. Specifically, the transformation converts the mechanical fingerprints of the system directly into a map of force-dependent rate constants. This map reveals the kinetics of the multitude of rate processes in the system beyond what is typically accessible to direct measurements. With the contributions from individual barriers to the interaction network now “untangled”, the map is straightforward to analyze in terms of the prominent barriers and timescales. Practical implementation of the transformation is illustrated with simulated biomolecular interactions that comprise different patterns of complexity—from a cascade of activation barriers to competing dissociation pathways.
Conformational transitions in biological macromolecules—such as the folding of nucleic acids and proteins or the binding of receptors and their ligands—usually serve as the mechanism that brings biomolecules into their working shape and enables their biological function (1). The conformational dynamics of a biomolecule are governed by its energy, which is described by a hypersurface—the energy landscape—in a space of the multitude of atomic coordinates. The energy landscapes of biological macromolecules are rough and hierarchical: the folded and unfolded (or bound and unbound) conformational states are often separated by a mountainous terrain of barriers (2–4). Remarkably, the prominent features of the landscape can be revealed by pulling the molecule apart: these features manifest themselves as nonmonotonic signatures—rips—in the force–extension curves of the molecule (5). Characteristics of the force–extension curves uniquely identify the biomolecule and thus serve as its “mechanical fingerprints” (6), in which the prominent barriers on the energy landscape are encoded. However, how can we decode the mechanical fingerprints to uncover the locations and heights of the barriers and the associated timescales of biomolecular motion (Fig. 1)? This is the central question addressed in the present paper.
Fig. 1.

Conformational transitions in biological macromolecules are often governed by complex energy landscapes. (Upper) A sequence of intermediates 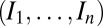 separate the native (N) and unfolded (U) states on the free-energy profile. (Lower) Conformational transitions can be resolved as rips (indicated by arrows) in the mechanical fingerprints. The challenge of decoding the fingerprints, so that they reveal the rates and rate-limiting barriers, is addressed in the present study.
The realm of biomolecular interactions can be accessed in single-molecule force experiments, which apply a stretching force to a biomolecule and monitor the molecule as it samples its conformations. The force-clamp scheme applies a constant force, while conformational transitions are signaled by abrupt changes in the molecular extension over time. This scheme, repeated at several values of force F, yields the force-dependent rate constant  for the transition between states i and j. The force-ramp scheme applies a force that is increased (stretching protocol) or decreased (relaxation protocol) with time, while the transitions are signified by abrupt changes in the force–extension curve. This scheme, repeated at several values of the force-loading rate, yields transition forces Fij and their probability distributions
  . Although the rates
  from the force clamp are, in principle, relatively straightforward to interpret in terms of the kinetic barriers, only a narrow range of forces can be probed in this scheme in practice, which limits access to the full force-dependent profiles of these rates, obstructing their analysis. The force ramp, on the other hand, probes a broader range of forces and is easier to implement, but the analysis of the measured force distributions is not straightforward.
An analytical framework for the analysis of the outputs from these two pulling schemes has been developed for the simplest case in which the transition involves a single barrier and is irreversible. Unified expressions for the force-dependent rate  of rupture and for the distribution
  of forces at rupture (7) relate these experimentally measurable quantities to the intrinsic (i.e., zero-force) parameters of the free-energy barrier: its location
  and height
  , and the associated rate k0. Furthermore, mapping that converts
  into
into  has been established (8). The analytical forms of the expression for
  (7) and of the mapping of
  onto
onto  (8) make them suitable for the analysis of force-ramp experiments when the conformational transition, or a particular step in the transition, can be viewed as diffusive crossing of a single barrier with no, or no influence from, preceding barriers (9–11). However, conformational transitions in complex biomolecules and macromolecular assemblies usually occur via multiple barriers, as is evident from multiple rips in their force–extension curves. In contrast with the sophistication of the resulting mechanical fingerprints (12–15), there is no analytical theory with which to analyze and interpret such rich behavior. The lack of a theory is evidently due to the difficulty of deriving an analytical expression for the force distribution
  in multiple-barrier systems. As a result, analytical studies of force-induced molecular transitions in such systems usually focus on the effective rate
  at constant force (16, 17). An expression for the quantity of relevance to force-ramp experiments—the most probable rupture force
  at pulling speed V—has been attempted empirically (17): the single-barrier rate
  was replaced by the multiple-barrier rate
  in the single-barrier version of the expression for
  . However, such approach is no longer justified (17) in the force range where two or more barriers have comparable effects on the kinetics.
Here, we show that force spectroscopy experiments that probe conformational transitions involving multiple barriers cannot, in general, be approached with the existing analytical tool—the theory for an irreversible single-barrier transition—even when transitions over individual barriers are unambiguously resolved in the experiment. At the same time, deriving a multiple-barrier analog of the expression for the transition force distribution,  , is not a feasible approach due to the complexity of the kinetics in multiple-barrier systems. Instead, we propose an approach that bypasses the difficulty of deriving an analytical form of the distribution of transition forces for complex landscapes—by transforming these forces into a form that is straightforward to analyze. This approach is illustrated with several examples representative of the different types of complexity encountered in biomolecular interactions.
Sequential Transitions Are Generally Not Independent
Consider a single-molecule force spectroscopy experiment on a macromolecule subject to stretching and/or relaxation cycles. As the macromolecule traverses its energy landscape, transitions over individual barriers are translated into a sequence of abrupt drops and increases—rips—in the force–extension curve. An abrupt drop in the force is associated with an unfolding or unbinding event; an abrupt increase in the force with a folding or binding event. The values of the force at each rip (arrows in Fig. 1, Lower) correspond to transition (unfolding or refolding) forces. By repeating these cycles multiple times, distributions of forces are collected for each type of transition. How can one translate the force distributions back into the underlying landscape and rates (Fig. 1)?
In view of the availability of an analytical theory of force-induced crossing of a single barrier (7, 8), it is instructive to first consider a naive approach: replace the problem of multiple sequential barriers by a sequence of independent single-barrier problems. The parameters of each barrier could then be extracted by fitting the corresponding force histogram to the single-barrier theory. Is such an approach justified? Simple arguments indicate that, generally, it is not.
Indeed, the force applied to the molecule in a force ramp changes with time as is set by the experimental protocol. Thus, the force faced by the molecule upon arrival to a state i depends on the time it takes the molecule to make its way through the states leading to i, a stochastic quantity. In particular, in a stretching protocol in which the applied force increases with time, the later the arrival into state i (due to a stochastic delay in the preceding states), the higher the force faced upon arrival, and even higher the force faced upon escape. It is this latter force that is recorded as the ith rip in the force–extension curve. Clearly, this force value is not a characteristic of the transition from i alone, but also of the transitions leading to i. Similar arguments hold for the relaxation protocol, in which a delay in the preceding transitions may cause a subsequent transition to occur at a lower force than that characteristic of this transition alone. The dependence of transition forces on the history preceding the transition in the present context should not be confused with non-Markovian dynamics (i.e., when the system does not equilibrate in a given state before escaping from this state). Rather, the dependence effect originates from the obvious fact that, while the system wanders among multiple barriers, the applied force is being changed.
The degree to which the  transition affects the
  transition can be assessed from the degree of overlap between the forces faced upon arrival into the state j from i and the forces at the escape from j en route to k (Fig. 2B). If there were no overlap in these forces, the transitions could be viewed as independent. A quantitative measure of the dependence of the two transitions is the correlation coefficient (18), defined as the ratio of the covariance of the forces at these transitions and the product of their SDs:
  . For example,
  has been reported for the native-to-intermediate
  and intermediate-to-unfolded
  transitions in the experiment on a fibronectin type III module in (18). The substantial correlation indicates that the second transition
  is not independent of the first one.
Fig. 2.
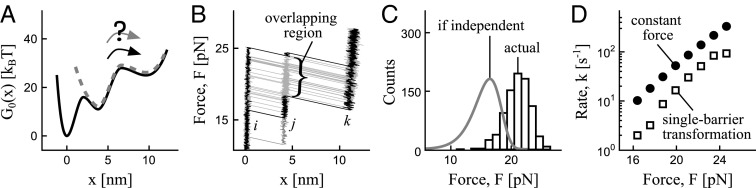
Transitions on complex landscapes in force spectroscopy are generally not independent, because the force faced by the system in a given transition depends on the duration of the preceding transitions. (A) Under a time-varying force, is the transition over the second barrier on the potential in black equivalent to the transition on the potential in gray? (B) Force–extension trajectories generated on the black potential in A show overlap between the forces faced upon arrival into the second well and the forces at the escape from this well. The overlap (the region indicated by a brace between the two trajectories highlighted in black) is caused by the delay of the transition from the first well. (C) Rupture force distribution for the transition over the second barrier (black histogram) is markedly different from the distribution (gray curve) for this transition if it were independent from the transition over the first barrier. (D) Force-dependent rate obtained by transforming the black histogram in C via the single-barrier transformation differs from the rate obtained directly at constant force, indicating that the effect of the first transition on the second one is not negligible.
To appreciate the dependence factor in sequential transitions, consider the potential shown in black in Fig. 2A at the parameters representative of an RNA hairpin (9) or a medium-size protein (19). Is the transition over the second barrier equivalent to the transition on the hypothetical potential shown in gray? Fig. 2C compares two distributions of forces: the black histogram (Brownian dynamics simulations; force-loading rate: 80 pN/s) results from the transition over the second barrier on the actual potential, whereas the distribution in gray results from the transition on the hypothetical single-barrier potential, which eliminates any influence from the first barrier. The pronounced discrepancy between the two distributions illustrates the arguments above: a delay caused by the first transition  shifts the force distribution for the second transition
  to higher forces. The second transition is thus far from being independent and cannot be analyzed with the single-barrier version of the expression for
  . Backward transitions
  at low pulling speeds will enhance the dependence effect even further. Fig. 2D shows the result of transforming the force distribution for the second transition (black histogram in C) into the force-dependent rate while ignoring the first transition, i.e., using the single-barrier mapping (8). If such an approach were justified, the resulting force-dependent rate would closely match the rate obtained at a constant force directly, which is not the case here. We conclude that sequential transitions under a time-varying force are generally not independent.
p(F) for Sequential Transitions: An Analytical Impasse
The demonstrated fallacy of the above naive approach suggests that a thoughtful approach must account for the dependence of sequential transitions. Ideally, one would like to have an analytical expression for the transition-force distribution  , analogous to that for the single-barrier process (7), but now accounting for the fact that the transition follows, and hence may be affected by, other transitions.
A natural starting point for attempting such an approach is the set of coupled rate equations for the time evolution of the probability density of molecular configurations in a multistate potential. Solving this set of equations analytically for the force distributions for every type of transition that occurs on this potential would provide the desired analytical tool for the analysis of transition-force histograms. However, this approach does not appear to be amenable to a general analytical treatment. In fact, even for the simple case of a single intermediate, it does not seem feasible to obtain a general analytical expression for  that would be valid for any arbitrary parameters of the barriers and wells.
The Transformation: From Fingerprints to Rate Map
We showed that it is generally incorrect to convert a force histogram  into the rate
  using the transformation that assumes an independent single-barrier process when the histogram itself results from a multiple-barrier process. At the same time, deriving a general analytical expression for
  is not a feasible approach when the dynamics involve multiple barriers. In contrast, an analytical expression for the force-dependent rates
  of such dynamics can be readily derived. Thus, if we find a way to convert the force histograms, measured in a multiple-barrier process, into the force-dependent rates, the analysis of these rates would be straightforward. The transformation derived below accomplishes this task.
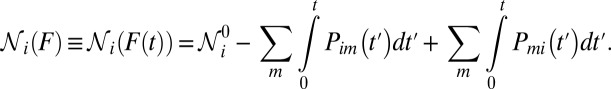
Consider conformational dynamics on a free-energy landscape with an arbitrary number of barriers and metastable states under a time-dependent external force. The number  of molecules in the ensemble that undergo the transition from state i to state j between times t and
  , is proportional to the rate constant
  for this transition, the number of molecules
  in the state i, and the time interval dt. During the same time interval, the applied force changes from F to
  by the experimental protocol. Summarizing the above arguments, the number of the molecules that transit from i to j at a force that falls within
  is
is
The absolute value sign makes this expression applicable both to the stretching and relaxation protocols. The population  in the state i at time t, in turn, is determined by the initial population
  in this state and the number of molecules that have transited out of
  and into
  , the state i by time t. This observation and Eq. 1 provide the ingredients for relating the rate
  and the transition-force distribution
  as follows:
 |
where
 |
Because the force-loading rate  changes as the molecule transits between different states, the index i has been added to specify the loading rate in state i.
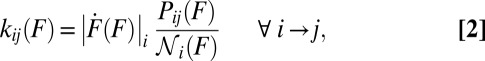
Having no constraints on the number of kinetic barriers in the system and therefore being quite general, the transformation in Eq. 2 is also remarkably practicable: every quantity on the right-hand side can be read directly off the experimental outputs. Indeed,  is found as the raw number of counts in a bin of the force histogram divided by the bin width. The population
  is found as the number of force trajectories in state i at force F. A simple algorithm in Supporting Information, section III and Fig. S1 automates the procedure of counting the trajectories. Although
  could also be calculated by approximating the integrals in the above expression for
  with the summation over the corresponding bins in the histogram, the method of counting the force trajectories has the advantage of eliminating the errors associated with the discretization of the integral. Finally, the loading rate
  is found as the slope of the force–time trajectory at force F in the state of interest. Expressing the transformation in Eq. 2 as a straightforward-to-implement word equation gives
 |
for a transition from state i to state j.
The transformation in Eqs. 2 and 3 converts the mechanical fingerprints of the system directly into the map of force-dependent rates  for all of the transitions that occur among the low-energy states in the system. Generalizing the method developed previously for an irreversible transition over a single barrier (8), the transformation in Eqs. 2 and 3 has no constraints on the complexity of the system as long as the individual transitions in the system are activated rate processes. The transformation can be applied to transitions involving an arbitrary number of activation barriers, as well as to transitions involving multiple dissociation pathways as long as the pathways can be identified based on mechanical fingerprints. The transformation naturally accounts for—and, in fact, turns into an advantage—the usually complicating factor of the reversibility (back-and-forth “hopping” between low-energy states), typically present in experiments on systems with multiple metastable states. Indeed, “hopping” is a source of additional data for the inputs
  and
and  in Eq. 2 (or “counts in bin F” and “trajectories in state i at F” in Eq. 3), thus increasing the statistical sample size. Moreover, because the reversible behavior involves, by definition, backward transitions, it opens access to the regions of the energy landscape that are rarely visited by the system otherwise. In the appropriate limit, when the topology of the landscape is such that the sequential transitions are independent, the transformation reduces to a sequence of single-barrier transformations (Fig. S2).
The Transformation at Work: Illustrations
Let us first illustrate the power of the transformation in Eqs. 2 and 3 on a system with a single intermediate along the dissociation pathway. The free-energy profile of the system is characterized by two activation barriers separating the (N)ative, (I)ntermediate, and (U)nfolded states (Fig. 3A and Table 1). Conformational dynamics in the presence of a harmonic pulling device and an anharmonic linker tethering the molecule to the device were assumed to be diffusive and captured by the extension  of the molecule-linker construct. Mechanical fingerprints of the system were generated via Brownian dynamics simulations on the combined potential
  , where ± indicates the stretching/relaxation protocol,
  is the intrinsic molecular potential along the molecular extension
  (Fig. 3A), GL is the worm-like chain potential of the linker, ϰ is the spring constant of the pulling device, and V is the pulling speed. Each stretching (relaxation) cycle began with a sufficiently small (large) separation X0 such that N (U) was initially the predominantly populated state. In addition, the simulations explicitly accounted for the effects of a position-dependent diffusion coefficient (20, 21), baseline drift (22), and missed/misjudged events (Supporting Information, sections IA and II,
Table S1, and Fig. S3).
(Fig. 3A), GL is the worm-like chain potential of the linker, ϰ is the spring constant of the pulling device, and V is the pulling speed. Each stretching (relaxation) cycle began with a sufficiently small (large) separation X0 such that N (U) was initially the predominantly populated state. In addition, the simulations explicitly accounted for the effects of a position-dependent diffusion coefficient (20, 21), baseline drift (22), and missed/misjudged events (Supporting Information, sections IA and II,
Table S1, and Fig. S3).
Fig. 3.

Practical implementation of the transformation in Eqs. 2 and 3, illustrated with conformational dynamics through an intermediate. Color code distinguishes different types of transitions. (A) Free-energy profile at zero force, featuring an intermediate. Indicated are the parameters of the barriers and intrinsic rates sought to be reconstructed. (B) Selected force–extension trajectories from a stretching and relaxation cycle, generated on the potential in A in the presence of an anharmonic linker and a pulling device with the spring constant ϰ = 5 pN/nm, representative of an atomic force microscope. Transition forces for different types of transitions are indicated. (C) Determining  in Eq. 2 and “trajectories in state i at F” in Eq. 3 by counting trajectories in the state of interest at a chosen value of force, illustrated with three trajectories from a stretching cycle. (D) Transition force histograms collected from the force–extension curves at the nominal loading rates indicated (in piconewtons per second) next to each histogram. As the result of the transformation (Eqs. 2 and 3), each histogram contributes to the corresponding branch on the rate map (Fig. 4A) as indicated by the matching symbol next to the histogram.
Table 1.
Intrinsic rates and barriers (heights and locations) from the analysis of the rate map in Fig. 4 with Eq. 5
| Parameter set |  |
 |
 |
 |
 |
 |
 |
 |
 |
 |
 |
 |
| True | −7.25 | 19.0 | 1.20 | 7.58 | 4.0 | 0.60 | −10.85 | 25.0 | 1.40 | 8.55 | 5.0 | 1.00 |
| Fit (mean) | −7.18 | 18.8 | 1.20 | 7.38 | 4.7 | 0.66 | −9.50 | 27.6 | 1.21 | 8.58 | 5.8 | 1.09 |
| Fit (σ) | 0.10 | 0.5 | 0.03 | 0.22 | 1.6 | 0.05 | 0.49 | 3.9 | 0.10 | 0.38 | 2.4 | 0.11 |
The key inputs into the transformation in Eqs. 2 and 3 are the transition forces and their histograms, collected from the force–extension curves. One thousand force–extension curves for each of the two protocols were generated at each of the four nominal loading rates. Fig. 3B shows two sample force–extension curves from a stretching and relaxation cycle, with multiple rips revealing the transitions between the three low-energy states on the potential in Fig. 3A. The transition forces (indicated in Fig. 3B) were grouped into histograms (Fig. 3D) for each of the four types of transitions that occur in this system. Note that the histograms include all transition events of a particular type observed in a given trajectory (e.g., both of the two transition forces FNI in the stretching trajectory in Fig. 3B are included in the histogram  ). Note also that the force histograms that enter the transformation should not be normalized, as
  in Eq. 2 is the raw number of counts in the bin divided by the bin width. Values of the force-loading rate
  were extracted as the slope of force-vs.-time trajectories in the individual states. Note that, although the anharmonic linker effect may complicate the force dependence of the loading rate
  , the incorporation of this effect in the transformation is straightforward because
  enters the transformation as a factor that can be determined from the slope of the force trajectories. Finally,
  was determined as the number of force–extension curves that are in state i at force F. Fig. 3C illustrates how to determine
  ,
,  , and
, and  with three sample trajectories; generalization to a larger number of trajectories is straightforward.
The described simple procedure converts the mechanical fingerprints of the system with an intermediate (Fig. 3A) into the map of force-dependent kinetic rates (Fig. 4A, color code follows the one adopted in Fig. 3). Every activated process that can possibly occur on the potential in Fig. 3A, and is resolved in the force–extension curves of the system, becomes reflected in the corresponding branch on this map. We note that, with the exception of the simplest biomolecules, it is challenging or unfeasible to construct such a comprehensive map by attempting to measure the transition rates directly under constant force. Indeed, sampling a sufficient number of rare events to be able to determine the transition rates in a broad range of forces in such measurements would require a force clamp with stability beyond that which is typically achieved. In contrast, the transformation in Eqs. 2 and 3 yields such a map with relative ease, because the desired broad range of forces—and hence the complete spectrum of transitions—is accessed by transforming data from force spectroscopy measurements performed at a broad range of pulling speeds.
Fig. 4.
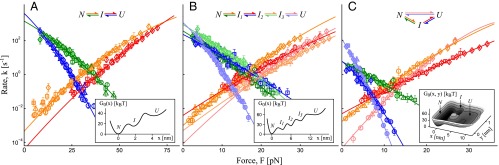
Rate maps obtained by applying the transformation in Eqs. 2 and 3 to the mechanical fingerprints of three systems comprised of different types of complexity of the molecular interactions. (A) An intermediate along the dissociation pathway. (B) A cascade of barriers along the dissociation pathway. (C) Coexisting dissociation pathways, with one of them featuring an intermediate. Individual branches on each map are the force-dependent rates for the corresponding activated processes. Symbols (color and shape) in A correspond to those in Fig. 3D. The colored lines are the fit of the individual branches to Eq. 5. Data points with  as calculated using Eq. 4 (∼5 counts or less in the bin of the original histogram) were not used in the fit as not statistically significant. Fitted parameters are summarized in Table 1 for the system in A and Tables S2 and S3 for the systems in B and C. Spring constant of the pulling device is ϰ = 5 pN/nm in A, representative of an atomic force microscope, and ϰ = 0.2 pN/nm in B and 0.5 pN/nm in C, representative of an optical trap. An anharmonic linker effect was incorporated in the simulations of the system in A and B.
The variation in the rates due to the finite number of the available force trajectories can be estimated as follows. For a transition  , the SD (error bars in Fig. 4) in the logarithmic rate
  at the force Fm is given by (Supporting Information, section IV):
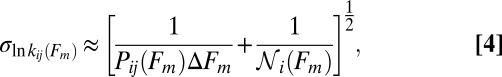 |
where  is the number of counts in the mth bin of width
  , and
, and  is number of trajectories in the state i (i.e., the origin of the transition) at the force Fm.
Next, we successfully apply the transformation in Eqs. 2 and 3 to more complex systems, each comprised of a particular type of complexity: multiple intermediates along the dissociation pathway (Fig. 4B) or competing dissociation pathways in which one of the pathways features an intermediate (Fig. 4C).
From Rate Map to Activation Barriers
The outcome of the transformation—the rate map—consists of individual branches, each being the force-dependent rate for the transition over a particular single barrier. Therefore, each branch can be approached with a single-barrier theory. However, when dealing with molecular interactions described by multistate energy landscapes, we must account for the fact that, unlike the narrow (“stiff”) folded state, the unfolded state in biopolymers may be broad (“soft”, i.e.,  may not be satisfied). Thus, the approximation of the applied force
  as
as  (7), although fully justified for a transition originating from the stiff folded state (i.e., the unfolding), may not be sufficiently accurate for transitions that originate in the unfolded state (i.e., the refolding) or in a soft intermediate. The following analytical expression for the force-dependent rate incorporates the first-order correction to this approximation:
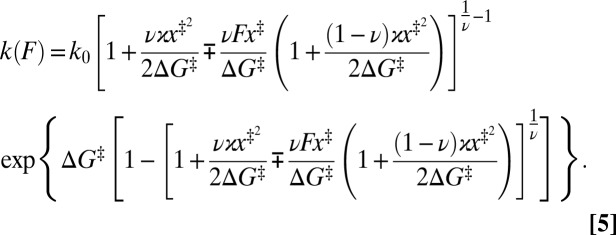 |
While the unified nature, captured by the scaling factor ν, of this expression has been retained, the expression is now applicable to transitions from both “stiff” and “soft” states. The minus sign (−) in ∓ notations applies to forward transitions, e.g.,  and
and  , and the plus sign (+) to backward transitions, e.g.,
  and
and  , in both the stretching and relaxation cycles. A smooth barrier corresponds to
  and a cusp-like barrier to
  (7). If an anharmonic linker is present, the effective spring constant may become force dependent, in which case ϰ can be estimated as the average of the effective spring constant in the range covered by transition forces.
Individual branches on the rate maps were each fitted with Eq. 5 (colored curves in Fig. 4), yielding the location  and height
  of each activation barrier and the associated rates k0 on the intrinsic potential. For the system with a single intermediate (Figs. 3 and 4A), the parameters extracted from the fit with
  are listed in Table 1 (rates in seconds−1, distances in nanometers, energies in kBT); fitting with
  yields results mostly within 2σ, indicating that the parameter values are relatively model insensitive. The key features of the energy landscape and the intrinsic rates are now reconstructed. Fig. 4 B and C and Tables S2 and S3 report the agreement between the reconstructed and actual parameters for the other two, more complex, systems studied.
The rate measured in a constant-force experiment at force F will generally deviate from the rate corresponding to the same force F on the rate map because of the difference in the bias (linear vs. nonlinear) imposed on the molecular potential in a force clamp vs. force ramp. To account for this difference when comparing rates from the two pulling schemes, the rate  measured at constant force F should be transferred to the rate map as
  with
with  (“+” applies to forward and “−” to backward transitions; Supporting Information, section V).
Having demonstrated the predictive power of the introduced transformation, we will mention a few cautionary notes on the application of this approach to experimental data. Limited time resolution may result in missed transitions, which, in turn, (i) may hamper the identification of the pathway the transition belongs to if multiple pathways are present, and (ii) may cause missed hopping events; both of these problems reduce the accuracy of the input in Eq. 2. A simple criterion can be used to assess the effect of the missed transitions: for any rate on the rate map that is small compared with the inverse of the instrument resolution time,  , this effect is negligible. Different states can be identified based on the change in the contour length upon a transition and the kinetic scheme can be determined from the connectivity of the states seen in the force–extension curves; however, if the resulting changes in contour length happen to be similar (14), these states may be identified incorrectly. This may lead to missed states in the reconstructed free-energy landscape or cause an abnormal behavior in the force-dependent rates; additional analyses (23) may be required to distinguish the cause from other effects, such as the multidimensionality of the energy landscape (24). Finally, because complex energy landscapes involve competing transitions, certain types of the transitions may only occur in a limited force range, which may introduce large uncertainties in the parameters extracted with Eq. 5 for those transitions.
Conclusions
Conformational transitions in biological macromolecules—usually a prerequisite for their functional activity—are often governed by complex energy landscapes with cascades of activation barriers and metastable intermediates. Single-molecule force spectroscopy experiments resolve these intermediates in the form of nonmonotonic features in the mechanical fingerprints of the macromolecules. Although the analytical framework for the analysis of the fingerprints of simple systems—those with a single barrier and no reversibility—has been developed, such an approach is generally not applicable to systems with multiple barriers subject to a time-varying force.
In this study, we introduced an approach to decode the mechanical fingerprints of complex systems—those with an arbitrarily large number of kinetic barriers. The central finding that enables this approach is a general transformation (Eqs. 2 and 3), which converts—in a model-free way—the observed features in the fingerprints directly into a map of force-dependent kinetic rates. Every activated process resolved in the fingerprints is reflected in a corresponding branch on this map. The rate map, itself being a comprehensive representation of the force-dependent kinetics of the system, can be further interpreted in terms of the intrinsic rates and rate-limiting barriers. To enable such interpretation, we derived a generalized analytical expression (Eq. 5) for the force-dependent transition rate, valid both for transitions from “stiff” states (typical of folded conformations) and “soft” states (typical of unfolded conformations). A combination of generality and simplicity makes the proposed theory suitable for the analysis of force spectroscopy data on complex macromolecules and their assemblies, yielding microscopic parameters that govern the conformational dynamics in these systems.
Supplementary Material
Acknowledgments
We are grateful to Robert Best, Tim Springer, Michael Woodside, Debarati Chatterjee, Ashok Garai, and Christopher Pierse for valuable discussions. This research was supported by National Science Foundation (NSF) Faculty Early Career Development Award MCB-0845099 and NSF Center for Theoretical Biological Physics Grant PHY-0822283.
Footnotes
The authors declare no conflict of interest.
This article is a PNAS Direct Submission.
This article contains supporting information online at www.pnas.org/lookup/suppl/doi:10.1073/pnas.1309101110/-/DCSupplemental.
References
- 1.Alberts B, et al., editors. Molecular Biology of the Cell. New York: Garland Science; 2008. [Google Scholar]
- 2.Onuchic JN, Luthey-Schulten Z, Wolynes PG. Theory of protein folding: the energy landscape perspective. Annu Rev Phys Chem. 1997;48:545–600. doi: 10.1146/annurev.physchem.48.1.545. [DOI] [PubMed] [Google Scholar]
- 3.Dill KA, Chan HS. From Levinthal to pathways to funnels. Nat Struct Biol. 1997;4(1):10–19. doi: 10.1038/nsb0197-10. [DOI] [PubMed] [Google Scholar]
- 4.Evans E. Probing the relation between force–lifetime–and chemistry in single molecular bonds. Annu Rev Biophys Biomol Struct. 2001;30:105–128. doi: 10.1146/annurev.biophys.30.1.105. [DOI] [PubMed] [Google Scholar]
- 5.Rief M, Gautel M, Oesterhelt F, Fernandez JM, Gaub HE. Reversible unfolding of individual titin immunoglobulin domains by AFM. Science. 1997;276(5315):1109–1112. doi: 10.1126/science.276.5315.1109. [DOI] [PubMed] [Google Scholar]
- 6.Marszalek PE, Li H, Fernandez JM. Fingerprinting polysaccharides with single-molecule atomic force microscopy. Nat Biotechnol. 2001;19(3):258–262. doi: 10.1038/85712. [DOI] [PubMed] [Google Scholar]
- 7.Dudko OK, Hummer G, Szabo A. Intrinsic rates and activation free energies from single-molecule pulling experiments. Phys Rev Lett. 2006;96(10):108101. doi: 10.1103/PhysRevLett.96.108101. [DOI] [PubMed] [Google Scholar]
- 8.Dudko OK, Hummer G, Szabo A. Theory, analysis, and interpretation of single-molecule force spectroscopy experiments. Proc Natl Acad Sci USA. 2008;105(41):15755–15760. doi: 10.1073/pnas.0806085105. [DOI] [PMC free article] [PubMed] [Google Scholar]
- 9.Greenleaf WJ, Frieda KL, Foster DAN, Woodside MT, Block SM. Direct observation of hierarchical folding in single riboswitch aptamers. Science. 2008;319(5863):630–633. doi: 10.1126/science.1151298. [DOI] [PMC free article] [PubMed] [Google Scholar]
- 10.Kim J, Zhang CZ, Zhang X, Springer TA. A mechanically stabilized receptor-ligand flex-bond important in the vasculature. Nature. 2010;466(7309):992–995. doi: 10.1038/nature09295. [DOI] [PMC free article] [PubMed] [Google Scholar]
- 11.Zhou R, et al. SSB functions as a sliding platform that migrates on DNA via reptation. Cell. 2011;146(2):222–232. doi: 10.1016/j.cell.2011.06.036. [DOI] [PMC free article] [PubMed] [Google Scholar]
- 12.Neupane K, Yu H, Foster DAN, Wang F, Woodside MT. Single-molecule force spectroscopy of the add adenine riboswitch relates folding to regulatory mechanism. Nucleic Acids Res. 2011;39(17):7677–7687. doi: 10.1093/nar/gkr305. [DOI] [PMC free article] [PubMed] [Google Scholar]
- 13.Kaiser CM, Goldman DH, Chodera JD, Tinoco I, Jr, Bustamante C. The ribosome modulates nascent protein folding. Science. 2011;334(6063):1723–1727. doi: 10.1126/science.1209740. [DOI] [PMC free article] [PubMed] [Google Scholar]
- 14.Stigler J, Ziegler F, Gieseke A, Gebhardt JCM, Rief M. The complex folding network of single calmodulin molecules. Science. 2011;334(6055):512–516. doi: 10.1126/science.1207598. [DOI] [PubMed] [Google Scholar]
- 15.Anthony PC, Perez CF, García-García C, Block SM. Folding energy landscape of the thiamine pyrophosphate riboswitch aptamer. Proc Natl Acad Sci USA. 2012;109(5):1485–1489. doi: 10.1073/pnas.1115045109. [DOI] [PMC free article] [PubMed] [Google Scholar]
- 16.Strunz T, Oroszlan K, Schumakovitch I, Güntherodt HJ, Hegner M. Model energy landscapes and the force-induced dissociation of ligand-receptor bonds. Biophys J. 2000;79(3):1206–1212. doi: 10.1016/s0006-3495(00)76375-2. [DOI] [PMC free article] [PubMed] [Google Scholar]
- 17.Derényi I, Bartolo D, Ajdari A. Effects of intermediate bound states in dynamic force spectroscopy. Biophys J. 2004;86(3):1263–1269. doi: 10.1016/S0006-3495(04)74200-9. [DOI] [PMC free article] [PubMed] [Google Scholar]
- 18.Li L, Huang HHL, Badilla CL, Fernandez JM. Mechanical unfolding intermediates observed by single-molecule force spectroscopy in a fibronectin type III module. J Mol Biol. 2005;345(4):817–826. doi: 10.1016/j.jmb.2004.11.021. [DOI] [PubMed] [Google Scholar]
- 19.Cecconi C, Shank EA, Bustamante C, Marqusee S. Direct observation of the three-state folding of a single protein molecule. Science. 2005;309(5743):2057–2060. doi: 10.1126/science.1116702. [DOI] [PubMed] [Google Scholar]
- 20.Zwanzig R. Diffusion in a rough potential. Proc Natl Acad Sci USA. 1988;85(7):2029–2030. doi: 10.1073/pnas.85.7.2029. [DOI] [PMC free article] [PubMed] [Google Scholar]
- 21.Best RB, Hummer G. Coordinate-dependent diffusion in protein folding. Proc Natl Acad Sci USA. 2010;107(3):1088–1093. doi: 10.1073/pnas.0910390107. [DOI] [PMC free article] [PubMed] [Google Scholar]
- 22.Schlierf M, Berkemeier F, Rief M. Direct observation of active protein folding using lock-in force spectroscopy. Biophys J. 2007;93(11):3989–3998. doi: 10.1529/biophysj.107.114397. [DOI] [PMC free article] [PubMed] [Google Scholar]
- 23.Hoffmann A, Woodside MT. Signal-pair correlation analysis of single-molecule trajectories. Angew Chem Int Ed Engl. 2011;50(52):12643–12646. doi: 10.1002/anie.201104033. [DOI] [PubMed] [Google Scholar]
- 24.Suzuki Y, Dudko OK. Single-molecule rupture dynamics on multidimensional landscapes. Phys Rev Lett. 2010;104(4):048101. doi: 10.1103/PhysRevLett.104.048101. [DOI] [PubMed] [Google Scholar]
Associated Data
This section collects any data citations, data availability statements, or supplementary materials included in this article.