


Abstract
Microbial communities represent the largest portion of the Earth’s biomass. Metagenomics projects use high-throughput sequencing to survey these communities and shed light on genetic capabilities that enable microbes to inhabit every corner of the biosphere. Metagenome studies are generally based on (i) classifying and ranking functions of identified genes; and (ii) estimating the phyletic distribution of constituent microbial species. To understand microbial communities at the systems level, it is necessary to extend these studies beyond the species’ boundaries and capture higher levels of metabolic complexity. We evaluated 11 metagenome samples and demonstrated that microbes inhabiting the same ecological niche share common preferences for synonymous codons, regardless of their phylogeny. By exploring concepts of translational optimization through codon usage adaptation, we demonstrated that community-wide bias in codon usage can be used as a prediction tool for lifestyle-specific genes across the entire microbial community, effectively considering microbial communities as meta-genomes. These findings set up a ‘functional metagenomics’ platform for the identification of genes relevant for adaptations of entire microbial communities to environments. Our results provide valuable arguments in defining the concept of microbial species through the context of their interactions within the community.
INTRODUCTION
An estimated 1030 microbes (1), prokaryotes of both the archeal and bacterial domains of life, inhabit the biosphere with metabolic agility that makes them capable of populating almost every corner of our planet. For example, the genes of microbes living in the human gut outnumber the gene complement of their host by a factor of 10 and provide enhanced metabolic capabilities not available to the host alone (2).
Environmental diversity studies have by and large bypassed the obstacle of <1% of microbes being amenable to cultivation in laboratory conditions [i.e. the great plate-count anomaly (3)] by instead using high-throughput sequencing to extract genomic information directly from the environmental sample without prior culturing. This approach, termed metagenomics, provides a ‘snapshot’ of the genetic content of entire, usually microbial, communities. While a pure microbial culture contains the clones of a single organism, microbes in natural habitats live in communities of varied phyletic composition with high rates of horizontal gene transfer documented even between evolutionary distant phylogenies (4). This in turn contributes to a substantial amount of genetic (and metabolic) diversity even within a single microbial species (5,6) that cannot be captured by single-clone sequencing and prompts us to rethink the concept of species at the microbial level (7). One such example is the pan-genome paradigm (8).
The increased availability of sequencing methods has enabled numerous metagenomic projects. Some of the sampled environments include geological sites such as sea (9), soil (10) and various extreme habitats [e.g. acid drainage from a metal mine (11), as well as gastrointestinal tracts of diverse organisms—including human (2) and mouse (12)]. Analysis pipelines of sequence data originating from metagenomics projects are presently focused in two main directions. The first one classifies the functions of identified genes (open reading frames) according to annotation available through orthology databases such as COG/KOG (Clusters of Orthologous Groups of genes) (13) or KEGG-KO (Kyoto Encyclopaedia of Genes and Genomes—Orthology) (14) and subsequently ranking the relative ‘importance’ of a particular function according to its abundance in the environment. The second direction focuses on estimating the phyletic distribution of microbial species represented in the environment, based on similarity searches against known microbial species’ sequences (15). In contrast to metagenomics, there are only a few metaproteomic studies (i.e. investigations of the total proteomes of microbial communities) (16–19) owing mostly to the complexity of experimental set-up and a relatively low throughput limited by high experimental costs (16).
Microbes in the same environment live within the same physical and chemical constraints, such as temperature, pH or ion concentration, and it was demonstrated that GC content is metagenome-specific (20). Furthermore, communities of microbes have been shown to share similar tRNA pools to facilitate horizontal gene transfer (21), which also implies a limited choice of preferred codons that are cognate to the shared community tRNA pool. It has also been shown that fast growth rates introduce stronger bias in synonymous codon usage at the level of whole metagenomes (22), much like the effect observed in single microbial species (23,24).
We hypothesize that under the same environmental constrains, under close contact and amenable to similar evolutionary pressures and horizontal gene transfer, the levels of integration within the community reach as deep as the constituent genes and that microbial communities effectively behave as meta-genomes. To validate our hypothesis and make a predictive model of communal gene expression, we explore the concept of translational optimization through synonymous codon usage bias.
Apart from the synonymous codon usage (CU) bias observed between genomes of different microbial species, synonymous codons are also used with unequal frequencies within a single microbial genome. The CU bias within a genome reflects the selection pressure for translational optimization of highly expressed genes—primarily the protein synthesis machinery such as ribosomal genes and elongation factors, but also genes with environmental adaptation functions (25). At the level of a single microbial genome, the effect of CU bias is routinely used to predict for functionally relevant and highly expressed genes (26–28). The choice of preferred codons in a single genome is most closely correlated with abundance of the cognate tRNA molecules (29–31) and further influenced by the genome’s GC content (32,33).
By analysing 11 diverse microbial community sequencing samples, we first demonstrate that microbes living in the same ecological niche, regardless of their phyletic diversity, share a common preference for codon usage, i.e. that we can observe CU bias at the community level and that this bias is different between different communities. Second, we show that CU bias varies within the community, with distributions resembling that of single microbial species, i.e. that we can observe the inter-community CU bias. We then use the effects of inter-community CU bias and translational optimization concepts to identify genes with CU close to that of the meta-ribosomal sample and therefore with high predicted expression across the entire microbial community, defining its ‘functional fingerprint’. We validate this functional fingerprint against metaproteomic samples and the literature, demonstrating the predictive potential for functional relevance. With this approach, we reveal higher level organizational patterns in metagenomes and propose a ‘functional metagenomics’ platform to predict functionally relevant genes at the level of the whole microbial community.
MATERIALS AND METHODS
Metagenomic data assembly and annotation
All metagenomic data used in this study are listed in Supplementary Tables S1 and S2. All data were downloaded from the National Centre for Biotechnology Information (NCBI), either preassembled or in trace format. Unassembled metagenomes were assembled in-house using the Celera Assembler (34).
We used the assembled data as query to the STRING/COG database version 8.0 (35) in a BLASTX (36) search with an e-value cut-off of 10−8. Open reading frames (ORFs) in the query sequences were assigned with an in-house Perl script based on the 3-nearest neighbour consensus rule. Specifically, a COG category is assigned to a gene only if the three best hits (smallest E-values) are all from the same orthologous group.
Single bacterial species’ genomes and annotation
The complete genome sequence of the skin commensal Propionibacterium acnes was previously determined (37) and is publicly available (IDs: NC_006085.1). Genome sequencing of 12 P. acnes isolates (Supplementary Table S3) was performed on the SOLiD 3 System (Applied Biosystems, now part of Life Technologies) following the manufacturer’s instructions. For this, DNA was extracted using the AquaGenomic kit (MultiTarget Pharmaceutical) and the preparation of the libraries and sequencing were performed using cycled ligation sequencing on a SOLiD 3 System; detailed procedure is described elsewhere (38–40). P. acnes strains were assigned STRING/COG categories and ORFs with the same method as metagenomes.
The complete genomes of six strains of Rhodopseudomonas palustris (41,42) from different environmental conditions were downloaded from the NCBI database including the complementary COG annotation (Supplementary Table S3). The Escherichia coli str. K-12 substr. DH10B, complete genome (ID: NC_010473) and complementary COG annotation were also retrieved from the NCBI.
Phylogenetic classification
We performed taxonomical analysis with the MEtaGenome ANalyzer (MEGAN) (15) from a BLASTX search of the all metagenomic samples against the NCBI non-redundant protein database (downloaded June 2010). Briefly, MEGAN classifies sequences to the last common ancestor of all significant BLAST hits and higher taxonomical levels do not include lower ones. For example, a sequence classified to the species level will not be counted again in the genus, family, order, etc.
Codon frequencies in metagenomes
The frequency of all codons whose cognate amino acids are encoded with more than one codon, i.e. synonymous codons, were normalized per amino acid for all metagenomic sets. The final set of codons includes all amino acids encoded with more than one codon, normalized so that the sum of frequencies of synonymous codons is equal to 1. According to MEGAN classification, the Sargasso Sea metagenome was divided into two groups (Supplementary Table S4): one containing only bacteria of the Alphaproteobacteria class and all its subgroups comprising ∼36% of the whole sample and the other group all remaining phylogenies in the whole metagenome. The intraclass correlation coefficient (ICC) (43) quantifies the difference between measurements (codon frequencies) of data structured into groups (synonymous codons). Therefore, an ICC of 1 indicates no difference between datasets, while 0 indicates a large difference.
To examine differences in codon frequencies between a single species of the metagenome and an entire metagenome and also between same species in different metagenomes, we used sequences taxonomically annotated by MEGAN down to the species level. From all 11 metagenomes, we selected those species that had at least 2000 codons in each metagenome and were present in at least two metagenomes (Supplementary Table S4). For each species found, we computed the ICC between codon frequencies from the first and second metagenome, totalling 1029 comparisons. Also for each of those species, we computed the ICC between codon frequencies of the species and codon frequencies of the entire metagenome, totalling 2058 comparisons.
Distance in codon usage
For both the single microbial genomes and whole metagenomes, we used ribosomal protein genes from their cognate samples as the reference set, owing to their ubiquitous high level of expression. We analysed codon usage with another in-house Perl script that calculates the Measure Independent of Length and Composition (MILC) as previously described (44) for each ORF assigned through COG homology.
MILC quantifies the distance in terms of codon usage between a certain open reading frame and some expected distribution of codons. Mathematically, the measure is based on goodness of fit. Individual contribution of each amino acid to the MILC statistics is calculated as
where Oc is the actual observed count of codon c in a gene and Ec is the expected count of that codon. Observed counts can be replaced by frequencies, where fc is the frequency of codon c in a gene and gc is the expected frequency of that codon. The total difference in codon usage is then defined as
The sum of all contributions (stop codons are excluded from the calculation) is divided by L, gene length in codons. C is the correction factor for overestimation of overall bias in shorter sequences. It is calculated as
where ra is the number of possible codons for the amino acid a, its degeneracy class.
For each gene in a genome, we derived the MILC distance to (i) the overall (meta)genome CU profile; and (ii) a reference set—a defined set of optimally encoded genes (i.e. ribosomal protein genes). We represented these two distances for each gene of a dataset by plotting them on a B-plot (26).
To test the variability in codon usage relative to phylogenetic distribution within ribosomal genes of a metagenome, we decomposed the Sargasso Sea ribosomal into subsets by species (Supplementary Table S5) using MEGAN. The MILC distance from the whole-metagenome ribosomal set of all subsets was measured and compared with the distance of all the genes of the metagenome and the whole ribosomal set.
Variability in codon usage for P. acnes and R. palustris isolates
The variability of codon usage within each COG was computed as the median MILC distance to the respective centroid for all genes from a given COG. The distances of two subsets, those within the 10% of smallest and 10% largest values, and the whole set were divided by STRING/COG supercategory. The occurrence of genes with the 10% smallest and largest values was tested against the whole set with the binomial test and the P-values corrected with the false discovery rate (FDR) method (Supplementary Table S6 and S7).
Codon usage distance between metagenomes
To measure the distance in codon usage between metagenomes, we used the MILC measure to derive the distance to (i) the overall metagenome CU profile of one metagenome; and (ii) the overall metagenome CU profile of another metagenome. By plotting the genes from both metagenomes in R (45), we can derive the distance in CU frequencies of the genes in each metagenome to both the genes in its own metagenome and those belonging to the other metagenome.
To simulate a situation in which a metagenome has no codon usage bias, we randomized the codons for each gene in the metagenome. The amino acid sequence was kept constant, but the synonymous codon used was randomly assigned using an in-house Perl script. The reference set of ribosomal genes was not randomized. We graphed the results in R in the same manner as the previous graph.
Enrichment of functions within highly expressed genes
We used an in-house Perl script to calculate the previously described MILC-Based Expression Level Predictor (MELP) (44) for every ORF, using ribosomal genes as the reference set. Briefly, the expression level of genes can be predicted through a ratio of a gene’s distance in CU frequency from the overall usage in the genome and a reference set, i.e. the ratio of the two MILC distances.
MELP is defined as
MILCgenome average is a measure of distance from the average codon usage of a microbial metagenome. MILCreference set is the distance from the average codon usage of a reference set, for which ribosomal genes were used.
Graphs produced in R were based on the number of ORFs in each STRING/COG supercategory with MELP values in the top 3% and low 3% (indicating high expression and low expression, respectively) normalized with the total occurrence of genes per supercategory regardless of MELP values. The occurrence of genes within the top and low 3% subsets for each STRING/COG supercategory was tested against the whole set, regardless of MELP values, with the binomial test and the P-values corrected with the FDR method.
Artificial metagenomes
For constructing artificial metagenomes, we downloaded all whole genome bacterial sequences from the NCBI Genbank database (downloaded June 2013). NCBI bacterial COG annotated sequences were used to create artificial metagenomes with similar COG supercategory composition to actual metagenomes (<1% difference). For each COG supercategory, the same number of sequences as in real metagenomes was randomly selected from the entire NCBI bacterial COG annotated set to make the corresponding artificial metagenome.
Metaproteome comparisons
The human gut (18) and Sargasso Sea metaproteomic studies (17) were chosen for benchmarking MELP values because both include >100 proteins and report relative abundances of proteins. The human gut study classified peptides into corresponding proteins, and we used the COG annotations for comparison with metagenomic COGs. The expression levels as predicted from metagenomes for each COG were computed as medians of MELP while the abundance of proteins in the metaproteome were computed as medians of normalized spectral abundance factors (NSAFs) per COG. The Sargasso Sea metaproteomic study provided sequences of proteins most closely matching peptides and the number of spectra they appeared in which we used as quantification of their abundance. We found the closest metagenomic genes for these proteins using a BLASTX search of the Sargasso Sea metagenome and show each gene’s MELP value and the corresponding protein’s spectral count. For each comparison, we computed the correlation of metaproteomic and metagenomic values and Spearman’s correlation coefficient in R.
RESULTS
We examine genes in 11 metagenomes from eight distinct environments: the Sargasso Sea (9), three whale fall carcass samples (10), Waseca farm soil (10), human gut microbiome (2), lean and obese mouse gut microbiomes (12), an acid mine drainage (11) and two geographically distant enhanced phosphorous removal sludges (46).
Metagenome-centric bias in codon usage is phylogeny-independent
To investigate whether microbes living in the same ecological niche share a bias in CU, we compared the distance of each gene’s CU in a metagenome from overall metagenome CU in the same metagenome of origin and all other metagenomes. Genes originating from one metagenome form a distinct cluster (as shown in one example in Figure 1A, and other examples in Supplementary Figure S1), and have CU predominantly closer to that metagenome overall CU than genes from the other metagenome. If the amino acid sequence and composition of each gene is preserved but the synonymous codons are randomly chosen (Figure 1B), the genes’ CU become equidistant to both metagenomes regardless of their metagenome of origin.
Figure 1.

Codon usage is metagenome-specific. Soil versus Santa Cruz Whale fall Santa Cruz Bone codon usage (CU) frequencies. (A) The distance (MILC, outlined in ‘Materials and Methods’ section) of each gene’s CU frequency to overall CU frequencies of two microbial communities. Genes [red in whale carcass (N = 33 422) and blue in Waseca soil (N = 88 696) metagenome] are predominantly closer to their respective metagenome of origin therefore forming two distinct groups (the distribution of log2 ratio of the two distances for each gene are shown in the inset). If the amino acid composition of metagenomes is kept constant and the codons randomly chosen, CU bias of each metagenome would be eliminated resulting in uniform distribution of CU distances and overlap of two colours, as shown in (B).
To demonstrate the independence of metagenome codon usage (CU) to phyletic composition, we tested two parameters (i) the variability of single species’ CU across metagenomes; and (ii) the variability of CU in a metagenome on removal of dominant phyla.
The variability of single species’ codon usage across metagenomes
We de-composed all metagenome genes into their respective phylogenies (see Materials and Methods section and Supplementary Table S4). Then, genes pertaining to each species identified in two metagenomes were compared in terms of CU distance with (i) their respective metagenome overall CU; and (ii) CU of genes from the same species in a different metagenome. The resulting distance distributions, quantified with the intraclass correlation coefficient measure (ICC, described in Materials and Methods section) show a statistically significant difference in CU patterns of compared phylogenies—the within-species’ CU pattern is more variable between metagenomes than in different species within the same metagenome (Figure 2).
Figure 2.
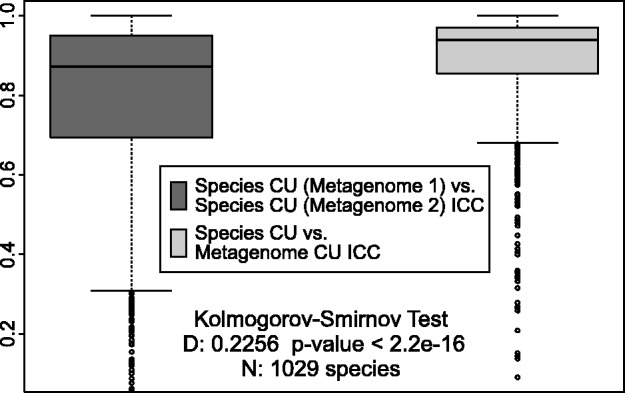
Codon usage variability between same species in different metagenomes is larger than within a metagenome. ORFs from each identified species (using MEGAN) were compared against their originating metagenome (dark grey, total comparisons N = 2058) and against same-species ORFs in a different metagenome (light grey, total comparisons N = 1029 comparisons). ICC measures were calculated, representing how ‘close’ the CU profiles match, with ICC = 1 denoting the perfect match. The light grey distribution shows less variability and is shifted towards higher ICC values, denoting the closer overall match of species’ CU to their metagenome of origin.
To further test whether CU is a dynamic property that changes with different environmental constraints at the level of single bacterial species, we compared the CU variability of independently sequenced strains of microbes living in distinct niches. The commensal Gram-positive bacteria P. acnes live in consistent environmental conditions, predominantly on the human skin. Nagy et al. (37–40) have sequenced the genomes of 12 P. acnes isolates and analysed them along with the publicly available genomes. When compared with the metabolically versatile and a cosmopolitan bacterium R. palustris with six publicly available genome projects on isolates from diverse environments (41,42), the P. acnes strains show less variation in CU per orthologous group than do the R. palustris strains (Figure 3). Despite the fact that the sampling includes more than twice as many strains from constrained environmental conditions (P. acnes) than variable conditions (R. palustris), the variability in CU is smaller in the constrained environmental conditions.
Figure 3.
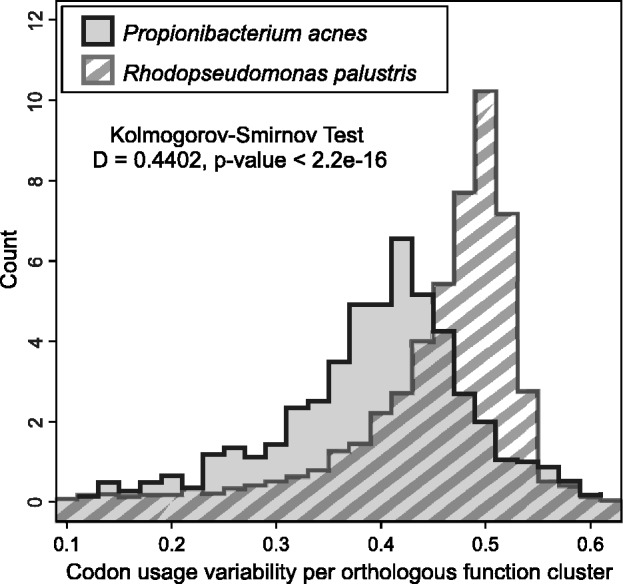
Environmental variability of codon usage. Variability of codon usage per COG Category in six strains of R. palustris and in 12 strains of P. acnes. The codon usage variability (calculated as median CU distance from the ribosomal set within an orthologous group to its centroid CU) for the strains of P. acnes (N = 15 436), living in consistent environmental conditions, is shifted to the left, i.e. shows smaller variation and higher bias, than for the R. palustris strains (N = 24 071) living in diverse environmental conditions.
The variability of codon usage in metagenomes on removal of dominant phyla
We analysed CU frequencies of the Sargasso Sea metagenome, the largest dataset in this study, in comparison with (i) other investigated metagenomes; (ii) itself, with dominant phyla removed; and (iii) by taking the equal sequence sample from the phyla where ≥30 sequences are present (32 phyla total with 32 sequences, for a total of 1024 sequences). The comparisons (Supplementary Figure S2) between Sargasso Sea CU frequencies and other metagenomes all show ICC < 0.75, while the same Sargasso sample with dominant phyla of the Alphaproteobacteria class removed (∼36% of the whole set, see Supplementary Table S4) and the Alphaproteobacteria class itself show virtually no deviation (ICC > 0.98 and 0.95, respectively) from the original metagenome CU (Supplementary Figures S2A and B). The comparison with a small subset of equally represented phyla (Supplementary Figure S2C), even with a 800× reduction in sample, still shows ICC closer to its original metagenome. This demonstrates that the community-level codon usage bias is not an effect caused by the most abundant species.
Codon usage within metagenomes follows similar patterns as in single microbial genomes
Next, we tested whether the existence of CU bias within whole metagenomes mirrors the bias observed within single microbial genomes that facilitates detection of translationally optimized genes. As has been established at the level of single microbial genomes (29,30), the distance of each gene’s CU frequency to the overall CU of the whole genome and to that of a ‘reference set’ of highly expressed genes (ribosomal protein genes) gives a characteristic crescent-shaped plot [Supplementary Figure S3A, introduced by (26)], separating the genes in two distinct groups based on the ratio of two distances. The group similar in CU to genes with high potential for expression (i.e. ribosomal proteins), are considered ‘optimized for translation’.
In comparison, the distribution of genes in metagenomes according to the distance of their CU frequencies to their respective meta-ribosomal genes (i.e. the metagenomic reference set) and the overall CU frequencies of the whole metagenome is shown in Supplementary Figure S3B for the Santa Cruz whale carcass bone microbial sample (distributions of other metagenomes are shown in Supplementary Figures S5A–D, left panels). Metagenomes exhibit similar CU distance distributions to those observed in single bacterial genomes, despite the fact that they are composed of genes that originate from diverse phylogenies. To test the significance of the CU distribution shapes, we performed three different procedures: (i) testing for CU distance within a meta-ribosomal reference set (Supplementary Figure S4); (ii) randomization of synonymous codons while preserving the overall amino-acid content within a metagenome (Supplementary Figure S5); and (iii) construction of environment-independent artificial metagenomes by randomly selecting the whole bacterial genome sequences from the NCBI while maintaining the original metagenome functional profile (COG category composition; Supplementary Figures S6–S8). When the Sargasso Sea ribosomal genes are de-composed into subsets by species (Supplementary Table S5) the six most abundant species cluster close to the whole metagenomic set indicating similar CU patterns (see ‘Materials and Methods’ section and Supplementary Figure S4). If the amino acid sequence composition of genes in a metagenome is kept constant but the synonymous codons are randomly chosen (Supplementary Figure S5), the crescent plot shape analogous to single bacterial genomes and CU bias is lost. Artificial metagenomes with the same size and functional properties (COG category composition) of the original metagenomes show emergence of a similar crescent shape in CU frequency distance for all artificial metagenomes (Supplementary Figure S7). The ratio of CU distances from the cognate genome average and the (meta)ribosomal reference set, represented as MELP values in Supplementary Figures S7 and S8, is uniform in all artificial metagenomes but distinct between real metagenomes. The crescent shape is therefore a property of both the amino-acid bias in various functional groups and the bias in the choice of synonymous codons.
Predicting metagenomic expression and functional profiles through synonymous codon usage
Given that CU can vary in different environmental constraints in single bacterial species and that metagenomes share CU, we can use the CU bias in metagenomes to predict the expression levels of genes in the same manner as is routinely used to predict genes optimized for high levels of expression in single microbial genomes (26,28,44). The resulting predictions at the level of whole metagenomes, using the meta-ribosomal protein reference set, are shown in Figure 4 with additional examples in Supplementary Figures S9 and S10. Briefly, the most significantly enriched functions in the high expression level set are (i) amino-acid transport and metabolism (COG supercategory E) for Sargasso sea; (ii) energy production and conservation (COG supercategory C) for the whale fall metagenomes; and (iii) inorganic ion transport and metabolism (COG supercategory P) for the acid mine biofilm metagenome. Furthermore, the most striking difference we found was the lack of enrichment in energy production and carbohydrate metabolism (COG supercategories C and G) in the obese mice microbiota sample, in contrast to both lean human and mouse microbiota samples.
Figure 4.
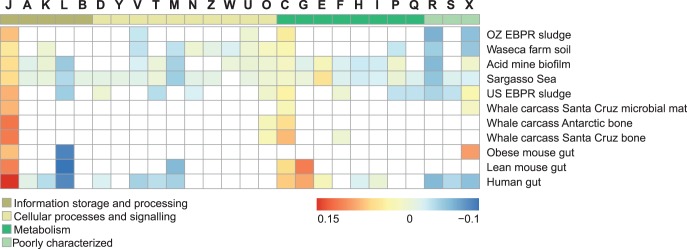
Enrichment of functions within highly expressed genes in metagenomes. Enrichment or depletion of functional annotations in the 3% genes with highest predicted expression (highest MELP measure) relative to the abundance of each COG supercategory in the whole metagenome for the OZ EBPR sludge (N = 29 754), Waseca farm soil (N = 88 696), acid mine biofilm (N = 79 257), Sargasso Sea (N = 688 539), US EBPR sludge (N = 20 175), Whale fall Santa Cruz microbial mat (N = 40 916), Whale fall Antarctic bone (N = 30 503), Whale fall Santa Cruz bone (N = 33 422), obese mouse gut (N = 4058), lean mouse gut (N = 4955) and human gut (N = 47 765), Santa Cruz whale fall bone (N = 33 422) and acid mine (N = 79 257). Metagenomes show different functional enrichment patterns that are consistent with environmental requirements (e.g. metabolite transport functions [E] in the Sargasso Sea or energy conversion [C] in the whale carcass metagenome). Non-significant enrichments are shown in white. Letters at the top represent COG supercategories: [J] Translation, ribosomal structure and biogenesis; [A] RNA processing and modification; [K] Transcription; [L] Replication, recombination and repair; [B] Chromatin structure and dynamics; [D] Cell cycle control, cell division, chromosome partitioning; [Y] Nuclear structure; [V] Defence mechanisms; [T] Signal transduction mechanisms; [M] Cell wall/membrane/envelope biogenesis; [N] Cell motility; [Z] Cytoskeleton; [W] Extracellular structures; [U] Intracellular trafficking, secretion and vesicular transport; [O] Posttranslational modification, protein turnover, chaperones; [C] Energy production and conversion; [G] Carbohydrate transport and metabolism; [E]Amino acid transport and metabolism; [F] Nucleotide transport and metabolism; [H] Coenzyme transport and metabolism; [I] Lipid transport and metabolism; [P] Inorganic ion transport and metabolism; [Q] Secondary metabolites biosynthesis, transport and catabolism; [R] General function prediction only; [S] Function unknown; [X] Uncharacterized.
To test whether the functional composition of metagenomes influences expression profiles, we again tested the effect on artificially constructed metagenomes. Supplementary Figure S11 shows the expression profiles for these artificial sets calculated in the same manner as for the original metagenomes. The resulting expression profiles, despite having the same functional composition, lost environment-specific signal, indicating that there is an environment-wide translational optimization for specific functional categories.
Validation with metaproteomics data
We compared our predictions of gene expression with two available metaproteomic studies that provided abundances of a comparably large number of proteins, the Sargasso Sea metaproteomic study (17) and a functionally (COG) classified subset of the human gut metaproteomic study (18). The predicted expression values based on CU optimization positively correlate with abundance in metaproteomic studies (Figure 5), both for the comparison of each gene with the protein most similar in sequence (Sargasso Sea rho = 0.34) and when median values per gene and protein COG are compared (Human Gut rho = 0.34). The comparison of the human gut metaproteome with our predictions in the Sargasso Sea metagenome, results in a correlation coefficient of rho = −0.03.
Figure 5.
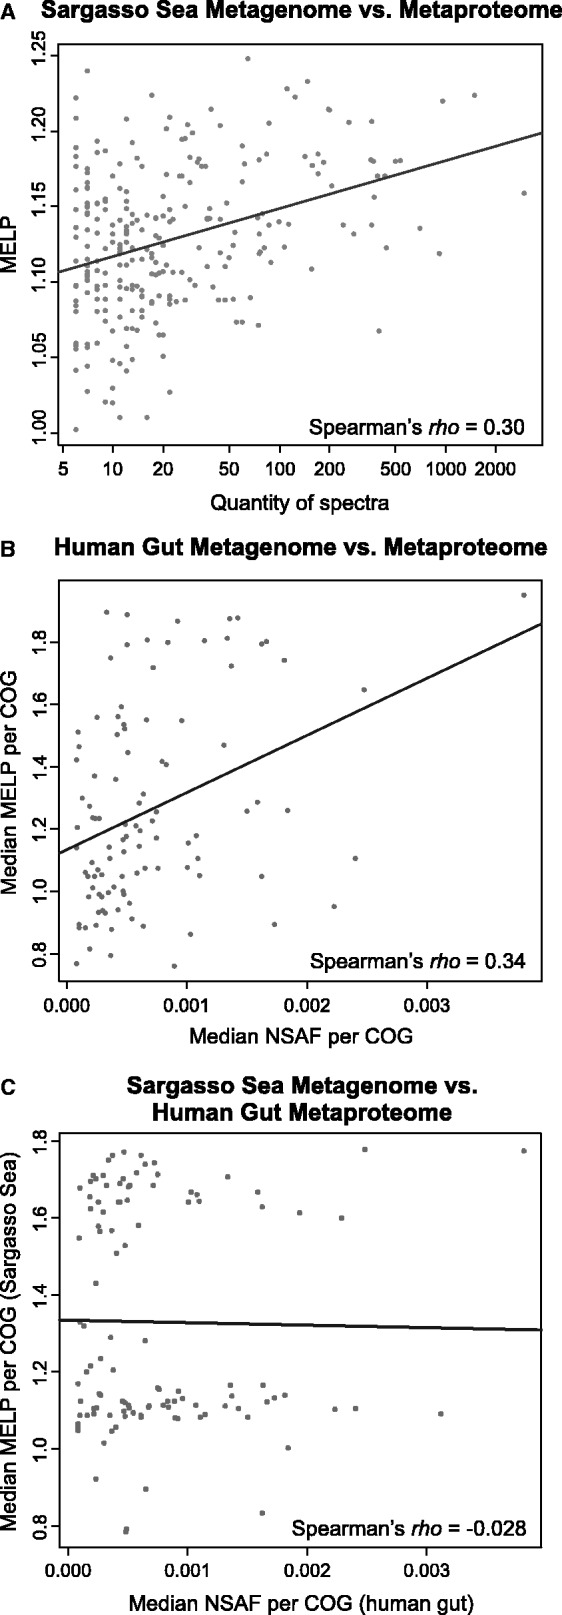
Correlation of metaproteomic and metagenomic data. Spearman’s correlation coefficient between metaproteomic and metagenomic data is shown for (A) the Sargasso Sea (N = 257)—each proteins’ number of spectra in the metaproteome versus the corresponding gene’s MELP value and (B) the human gut—the median NSAF value per protein COG versus the median MELP value per gene COG (N = 116) and (C) the Human gut median NSAF value per protein COG versus the median MELP value per Sargasso Sea gene COG. Spearman’s rho correlation is positive and greater for comparisons of metaproteomes with their own metagenomes then with foreign metagenomes.
DISCUSSION
Microbial communities have properties of single bacterial genomes
The phenomenon of translational optimization through CU has been a well-established method of gene regulation for single bacterial genomes, and provides a predictive link between genomic and expression data (25,27). We have adapted this approach to the analysis of genomic information from entire microbial communities. Analysis of 11 distinct metagenomes shows that microbial communities exhibit codon usage bias similar to that already described for single microbial species (Supplementary Figure S3B and left panels of Supplementary Figure S5). It suggests that microbial communities sharing an environment are likely to have synchronized regulation mechanisms of translational optimization for expression of environment-specific genes. In the opposite scenario, where each microbial constituent of the community would use independent translational optimization mechanisms, we would expect as a net community-wide effect a uniform codon usage, without a particular preference for any subset of synonymous codons. In fact, this is exactly the scenario we demonstrated with our randomized samples (Supplementary Figure S5) and artificial metagenomes (Supplementary Figures S6–S8).
The evidence of distinct functional profiles of microbial communities regardless of the actual phylogenetic composition (47), emphasizes the community-wide translational optimization effect as an important meta-genomic feature with relevant predictive power. This helps us rank metabolic functions and orthologous groups at the systems level that are more likely to be important for the adaptation of the entire metagenome to its particular environment. More importantly, our predictions can be used to identify and characterize genes of unknown functions with codon usage patterns similar to the community-wide lifestyle genes. By using the approach described here, we can effectively screen metagenomes for dominant functional properties that are not dependent on gene abundance data, but rather reflect higher organizational levels and give us essentially a ‘characteristic functional fingerprint’ of a microbial ecosystem, as shown in Figure 4.
Tracking functional adaptations across metagenomes
Two marine metagenomes, the Sargasso Sea and Santa Cruz whale carcass bone, have distinct profiles of gene enrichment within COG supercategories in environment-specific functions. The Sargasso Sea is a nutrient poor environment (9), and its genes for ABC-type transporters in the supercategory for amino acid transport and metabolism (COG supercategory E) are translationally optimized. On the other hand, the whale fall carcass metagenome, where microbes live on an abundant food source, shows optimization in the category for energy production and conversion (COG supercategory C). This difference in gene optimization can reflect functional adaptation of microbes to different environmental conditions and is lost in artificial metagenomes of the same functional composition (Supplementary Figure S11). The metaproteomic study of the Sargasso Sea environment (17) reported a dominance of the ABC-type transporters, consistent with our prediction of overrepresentation of these proteins in the set of genes with high translational optimization. Additionally, acid-mine drainage biofilms have been documented to frequently use inorganic ions as a source of energy (48), which is also validated in our analysis.
Alternative hypothesis for the influence of gut microbiota to host metabolism
The lifestyles of both the lean human and lean mouse gut metagenomes (Figure 4; for emphasis shown separately in Supplementary Figure S10) have similar profiles despite spatial isolation and different hosts. They show optimization enrichment in genes responsible for energy production and conversion (COG supercategory C) and carbohydrate transport and metabolism (COG supercategory G), i.e. the main functions of the biota inhabiting the intestinal track that aid the host in digestion of food. We show that these energy harvesting genes in the lean mouse’s microbiome, shown previously to be less abundant than those in the obese gut (12), are in fact optimized for translational efficiency. The same category of genes in the obese mouse’s gut lacks translational optimization, implying that these microbes might be less efficient at processing food therefore leaving more nutrients to be absorbed and metabolized by the obese host. A metaproteomic study of a healthy (lean) human gut microbiome (18) showed a greater fraction of proteins responsible for carbohydrate transport and metabolism (COG supercategory G) than is the fraction of coding sequences identified in the corresponding metagenome, consistent with our predictions of high expression in the human gut metagenome, and provides an alternative hypothesis on the association of intestinal fauna with obesity.
Environmental effect on codon usage stability in microbial species
We address how variable environmental conditions influence CU by examining the variability in CU in 12 strains of bacteria living in the same environmental conditions (P. acnes) and six strains of bacteria living in different environmental conditions (R. palustris). Consistent with our claims and the findings of Botzman and Margalit (49), the R. palustris samples show on overall higher variability in CU, suggesting plasticity of translational optimization that adopts to each specific environment. Even though the R. palustris strains generally show more variation in CU (Figure 3) both species, regardless of environmental constraints, show the least relative variation of CU within the COG categories (i.e. orthologous genes) for housekeeping, including ribosomal protein genes (Supplementary Table S6 and S7). The R. palustris strains show enrichment of genes with the highest variation in CU, predominantly in functional categories responsible for environment-specific metabolism, i.e. multidrug efflux pumps (supercategory V) and dehydrogenases (supercategories I, Q and R). This is consistent with previous findings that the optimal set of codons is consistent in varied bacterial phylogenies (23), and suggests that adaptation to environmental constraints occurs mainly through translational optimization of environment-specific functions, rather than equally for the entire bacterial genome(50). The observed effects can explain scenarios such as the intestinal fauna communities (51) where the genetic complement of a community can remain fairly constant, while they adapt to different environments through translational optimization, effectively changing the baseline expression levels of relevant genes to reflect the availability of a particular nutrient profile.
In-silico metaproteomics
Metaproteomics studies are crucial in comprehensive functional studies of protein families responsible for adaptation of entire microbial communities to an environment—many genes in metagenomes that have no identifiable homologue in the databases but show high expression levels or propensity for horizontal transfer. Even though there is an abundance of available metagenomic data, analogous studies of the whole proteome complement of an environment (17–19) are in their infancy and their throughput cannot rival that of metagenomics. Therefore, the most accessible approach to define communities at the level of proteome content will in the near future remain (meta)genome-based. We present a method that can link genomic data from easily accessible metagenomic sequences to the abundances of proteins in the corresponding metaproteome and provide insight into the functions of proteins important for survival in an environment. Despite the present scarcity of available metaproteome datasets resulting in the limited ability to perform quantitative comparisons, there is a general trend for proteins of higher abundance to have higher predicted metagenomic expression values and vice versa (Figure 5).
Possible mechanisms for the cause of CU bias in metagenomes
There is increasing evidence of novel mechanisms (52) that suggest an even higher amount of horizontal gene transfer events occurring within microbial communities than previously expected (53–56). We speculate that the inter-community CU bias we observe may be a consequence of an extensive exchange of genetic information in an environment, up to and including the level that is the strongest selection force for CU optimization—the shared tRNA pool (57,58). This in turn can be considered beneficial in particular for lifestyle-specific genes. With the common tRNA pool, these genes have an additional advantage for fixation within a community: better a priori translational optimization for more rapid protein production and therefore a faster penetrance. Drastic examples include the rapid propagation of antibiotic resistance genes (59). As the net effect of having a common community-wide optimization target, we observe the same signature as in single bacterial genomes—uneven intra-community CU bias regardless of its phylogenetic composition. Another contributing mechanism leading to the observed effect of CU bias at the community level would include parallel evolution of each microbial species’ CU in such a way to support GC content required by the environmental constraints. However, for each of the analysed data samples, we observe a statistically significant deviation of the ribosomal protein genes’ GC content with respect to that of the whole environmental sample (Supplementary Figure S12), indicating that the genes encoded with optimal codons are not under exclusive selection for GC content. In fact, both mechanisms combined seem to produce a detectable bias in CU and, as the net effect, allow us to build a predictive model based on the concept of translational optimization.
SUPPLEMENTARY DATA
Supplementary Data are available at NAR Online.
FUNDING
European Molecular Biology Organization Young Investigator Programme Installation grant [1431/2006 to K.V.]; International Centre for Genetic Engineering and Biotechnology Collaborative Research Programme [CRP/CRO07-03 to K.V.]; Integra-Life Seventh Framework Programme [315997 to K.V.]; and the Croatian Ministry of Science Education and Sports [119-0982913-1211 to K.V.]. I.N. was supported by the Hungarian National Office for Research and Technology Teller program [OMFB-00441/2007] and by the French-Hungarian Associated European Laboratory SkinChroma [OMFB-00272/2009]. Funding for open access charge: EU Seventh Framework Programme [INTEGRA-LIFE RegPot 315997]; EMBO Young Investigator Installation grant [1431/2006]; Croatian Ministry of Science Education and Sports [119-0982913-1211].
Conflict of interest statement. None declared.
Supplementary Material
ACKNOWLEDGEMENTS
The authors thank Ivan Jurić, Marija Buljan and Nenad Bartoniček for their contribution to the early stages of the analysis, Petar Jager for providing high performance computing support, Ozren Polašek with the discussions on statistical methods and Vedran Franke for discussion on analysis methods, manuscript versions and help with the figures. We also thank all members of the bioinfo.hr group and numerous colleagues for discussions on how to improve the manuscript.
REFERENCES
- 1.Whitman WB, Coleman DC, Wiebe WJ. Prokaryotes: the unseen majority. Proc. Natl Acad. Sci. USA. 1998;95:6578–6583. doi: 10.1073/pnas.95.12.6578. [DOI] [PMC free article] [PubMed] [Google Scholar]
- 2.Gill SR, Pop M, DeBoy RT, Eckburg PB, Turnbaugh PJ, Samuel BS, Gordon JI, Relman DA, Fraser-Liggett CM, Nelson KE. Metagenomic analysis of the human distal gut microbiome. Science. 2006;312:1355–1359. doi: 10.1126/science.1124234. [DOI] [PMC free article] [PubMed] [Google Scholar]
- 3.Staley JT, Konopka A. Measurement of insitu activities of nonphotosynthetic microorganisms in aquatic and terrestrial habitats. Annu. Rev. Microbiol. 1985;39:321–346. doi: 10.1146/annurev.mi.39.100185.001541. [DOI] [PubMed] [Google Scholar]
- 4.Keeling PJ, Palmer JD. Horizontal gene transfer in eukaryotic evolution. Nat. Rev. Genet. 2008;9:605–618. doi: 10.1038/nrg2386. [DOI] [PubMed] [Google Scholar]
- 5.Tettelin H, Masignani V, Cieslewicz MJ, Donati C, Medini D, Ward NL, Angiuoli SV, Crabtree J, Jones AL, Durkin AS, et al. Genome analysis of multiple pathogenic isolates of Streptococcus agalactiae: implications for the microbial “pan-genome”. Proc. Natl Acad. Sci. USA. 2005;102:13950–13955. doi: 10.1073/pnas.0506758102. [DOI] [PMC free article] [PubMed] [Google Scholar]
- 6.Willenbrock H, Hallin P, Wassenaar T, Ussery D. Characterization of probiotic Escherichia coli isolates with a novel pan-genome microarray. Genome Biol. 2007;8:R267. doi: 10.1186/gb-2007-8-12-r267. [DOI] [PMC free article] [PubMed] [Google Scholar]
- 7.Achtman M, Wagner M. Microbial diversity and the genetic nature of microbial species. Nat. Rev. Microbiol. 2008;6:431–440. doi: 10.1038/nrmicro1872. [DOI] [PubMed] [Google Scholar]
- 8.Mira A, Martin-Cuadrado AB, D’Auria G, Rodriguez-Valera F. The bacterial pan-genome: a new paradigm in microbiology. Int. Microbiol. 2010;13:45–57. doi: 10.2436/20.1501.01.110. [DOI] [PubMed] [Google Scholar]
- 9.Venter JC, Remington K, Heidelberg JF, Halpern AL, Rusch D, Eisen JA, Wu DY, Paulsen I, Nelson KE, Nelson W, et al. Environmental genome shotgun sequencing of the Sargasso Sea. Science. 2004;304:66–74. doi: 10.1126/science.1093857. [DOI] [PubMed] [Google Scholar]
- 10.Tringe SG, von Mering C, Kobayashi A, Salamov AA, Chen K, Chang HW, Podar M, Short JM, Mathur EJ, Detter JC, et al. Comparative metagenomics of microbial communities. Science. 2005;308:554–557. doi: 10.1126/science.1107851. [DOI] [PubMed] [Google Scholar]
- 11.Tyson GW, Chapman J, Hugenholtz P, Allen EE, Ram RJ, Richardson PM, Solovyev VV, Rubin EM, Rokhsar DS, Banfield JF. Community structure and metabolism through reconstruction of microbial genomes from the environment. Nature. 2004;428:37–43. doi: 10.1038/nature02340. [DOI] [PubMed] [Google Scholar]
- 12.Turnbaugh PJ, Ley RE, Mahowald MA, Magrini V, Mardis ER, Gordon JI. An obesity-associated gut microbiome with increased capacity for energy harvest. Nature. 2006;444:1027–1031. doi: 10.1038/nature05414. [DOI] [PubMed] [Google Scholar]
- 13.Tatusov RL, Fedorova ND, Jackson JD, Jacobs AR, Kiryutin B, Koonin EV, Krylov DM, Mazumder R, Mekhedov SL, Nikolskaya AN, et al. The COG database: an updated version includes eukaryotes. BMC Bioinformatics. 2003;4:14. doi: 10.1186/1471-2105-4-41. [DOI] [PMC free article] [PubMed] [Google Scholar]
- 14.Kanehisa M, Goto S, Hattori M, Aoki-Kinoshita KF, Itoh M, Kawashima S, Katayama T, Araki M, Hirakawa M. From genomics to chemical genomics: new developments in KEGG. Nucleic Acids Res. 2006;34:D354–D357. doi: 10.1093/nar/gkj102. [DOI] [PMC free article] [PubMed] [Google Scholar]
- 15.Huson DH, Auch AF, Qi J, Schuster SC. MEGAN analysis of metagenomic data. Genome Res. 2007;17:377–386. doi: 10.1101/gr.5969107. [DOI] [PMC free article] [PubMed] [Google Scholar]
- 16.Keller M, Hettich R. Environmental proteomics: a paradigm shift in characterizing microbial activities at the molecular level. Microbiol. Mol. Biol. Rev. 2009;73:62–70. doi: 10.1128/MMBR.00028-08. [DOI] [PMC free article] [PubMed] [Google Scholar]
- 17.Sowell SM, Wilhelm LJ, Norbeck AD, Lipton MS, Nicora CD, Barofsky DF, Carlson CA, Smith RD, Giovanonni SJ. Transport functions dominate the SAR11 metaproteome at low-nutrient extremes in the Sargasso Sea. ISME J. 2008;3:93–105. doi: 10.1038/ismej.2008.83. [DOI] [PubMed] [Google Scholar]
- 18.Verberkmoes NC, Russell AL, Shah M, Godzik A, Rosenquist M, Halfvarson J, Lefsrud MG, Apajalahti J, Tysk C, Hettich RL, et al. Shotgun metaproteomics of the human distal gut microbiota. ISME J. 2009;3:179–189. doi: 10.1038/ismej.2008.108. [DOI] [PubMed] [Google Scholar]
- 19.Wilmes P, Wexler M, Bond PL. Metaproteomics provides functional insight into activated sludge wastewater treatment. PLoS One. 2008;3:e1778. doi: 10.1371/journal.pone.0001778. [DOI] [PMC free article] [PubMed] [Google Scholar]
- 20.Foerstner KU, von Mering C, Hooper SD, Bork P. Environments shape the nucleotide composition of genomes. EMBO Rep. 2005;6:1208–1213. doi: 10.1038/sj.embor.7400538. [DOI] [PMC free article] [PubMed] [Google Scholar]
- 21.Tuller T, Girshovich Y, Sella Y, Kreimer A, Freilich S, Kupiec M, Gophna U, Ruppin E. Association between translation efficiency and horizontal gene transfer within microbial communities. Nucleic Acids Res. 2011;39:4743–4755. doi: 10.1093/nar/gkr054. [DOI] [PMC free article] [PubMed] [Google Scholar]
- 22.Vieira-Silva S, Rocha EP. The systemic imprint of growth and its uses in ecological (meta)genomics. PLoS Genet. 2010;6:e1000808. doi: 10.1371/journal.pgen.1000808. [DOI] [PMC free article] [PubMed] [Google Scholar]
- 23.Rocha EP. Codon usage bias from tRNA’s point of view: redundancy, specialization, and efficient decoding for translation optimization. Genome Res. 2004;14:2279–2286. doi: 10.1101/gr.2896904. [DOI] [PMC free article] [PubMed] [Google Scholar]
- 24.Sharp PM, Bailes E, Grocock RJ, Peden JF, Sockett RE. Variation in the strength of selected codon usage bias among bacteria. Nucleic Acids Res. 2005;33:1141–1153. doi: 10.1093/nar/gki242. [DOI] [PMC free article] [PubMed] [Google Scholar]
- 25.Supek F, Škunca N, Repar J, Vlahoviček K, Šmuc T. Translational selection is ubiquitous in prokaryotes. PLoS Genet. 2010;6:e1001004. doi: 10.1371/journal.pgen.1001004. [DOI] [PMC free article] [PubMed] [Google Scholar]
- 26.Karlin S, Mrazek J. Predicted highly expressed genes of diverse prokaryotic genomes. J. Bacteriol. 2000;182:5238–5250. doi: 10.1128/jb.182.18.5238-5250.2000. [DOI] [PMC free article] [PubMed] [Google Scholar]
- 27.Plotkin JB, Kudla G. Synonymous but not the same: the causes and consequences of codon bias. Nat. Rev. Genet. 2011;12:32–42. doi: 10.1038/nrg2899. [DOI] [PMC free article] [PubMed] [Google Scholar]
- 28.Sharp P, Li W. The codon Adaptation Index–a measure of directional synonymous codon usage bias, and its potential applications. Nucleic Acids Res. 1987;15:1281–1295. doi: 10.1093/nar/15.3.1281. [DOI] [PMC free article] [PubMed] [Google Scholar]
- 29.Ikemura T. Codon usage and transfer-RNA content in unicellular and multicellular organisms. Mol. Biol. Evol. 1985;2:13–34. doi: 10.1093/oxfordjournals.molbev.a040335. [DOI] [PubMed] [Google Scholar]
- 30.Kanaya S, Yamada Y, Kinouchi M, Kudo Y, Ikemura T. Codon usage and tRNA genes in eukaryotes: correlation of codon usage diversity with translation efficiency and with CG-dinucleotide usage as assessed by multivariate analysis. J. Mol. Evol. 2001;53:290–298. doi: 10.1007/s002390010219. [DOI] [PubMed] [Google Scholar]
- 31.Tuller T, Carmi A, Vestsigian K, Navon S, Dorfan Y, Zaborske J, Pan T, Dahan O, Furman I, Pilpel Y. An evolutionarily conserved mechanism for controlling the efficiency of protein translation. Cell. 2010;141:344–354. doi: 10.1016/j.cell.2010.03.031. [DOI] [PubMed] [Google Scholar]
- 32.Chen SL, Lee W, Hottes AK, Shapiro L, McAdams HH. Codon usage between genomes is constrained by genome-wide mutational processes. Proc. Natl Acad. Sci. USA. 2004;101:3480–3485. doi: 10.1073/pnas.0307827100. [DOI] [PMC free article] [PubMed] [Google Scholar]
- 33.Hershberg R, Petrov DA. General rules for optimal codon choice. PLoS Genet. 2009;5:e1000556. doi: 10.1371/journal.pgen.1000556. [DOI] [PMC free article] [PubMed] [Google Scholar]
- 34.Myers EW, Sutton GG, Delcher AL, Dew IM, Fasulo DP, Flanigan MJ, Kravitz SA, Mobarry CM, Reinert KHJ, Remington KA, et al. A whole-genome assembly of Drosophila. Science. 2000;287:2196–2204. doi: 10.1126/science.287.5461.2196. [DOI] [PubMed] [Google Scholar]
- 35.Jensen LJ, Kuhn M, Stark M, Chaffron S, Creevey C, Muller J, Doerks T, Julien P, Roth A, Simonovic M, et al. STRING 8-a global view on proteins and their functional interactions in 630 organisms. Nucleic Acids Res. 2009;37:D412–D416. doi: 10.1093/nar/gkn760. [DOI] [PMC free article] [PubMed] [Google Scholar]
- 36.Altschul SF, Madden TL, Schaffer AA, Zhang JH, Zhang Z, Miller W, Lipman DJ. Gapped BLAST and PSI-BLAST: a new generation of protein database search programs. Nucleic Acids Res. 1997;25:3389–3402. doi: 10.1093/nar/25.17.3389. [DOI] [PMC free article] [PubMed] [Google Scholar]
- 37.Bruggemann H, Henne A, Hoster F, Liesegang H, Wiezer A, Strittmatter A, Hujer S, Durre P, Gottschalk G. The complete genome sequence of Propionibacterium acnes, a commensal of human skin. Science. 2004;305:671–673. doi: 10.1126/science.1100330. [DOI] [PubMed] [Google Scholar]
- 38.Horvath B, Hunyadkurti J, Voros A, Fekete C, Urban E, Kemeny L, Nagy I. Genome sequence of Propionibacterium acnes type II strain ATCC 11828. J. Bacteriol. 2012;194:202–203. doi: 10.1128/JB.06388-11. [DOI] [PMC free article] [PubMed] [Google Scholar]
- 39.Hunyadkurti J, Feltoti Z, Horvath B, Nagymihaly M, Voros A, McDowell A, Patrick S, Urban E, Nagy I. Complete genome sequence of Propionibacterium acnes type IB strain 6609. J. Bacteriol. 2011;193:4561–4562. doi: 10.1128/JB.05372-11. [DOI] [PMC free article] [PubMed] [Google Scholar]
- 40.McDowell A, Hunyadkurti J, Horvath B, Voros A, Barnard E, Patrick S, Nagy I. Draft genome sequence of an antibiotic-resistant Propionibacterium acnes strain, PRP-38, from the novel type IC cluster. J. Bacteriol. 2012;194:3260–3261. doi: 10.1128/JB.00479-12. [DOI] [PMC free article] [PubMed] [Google Scholar]
- 41.Oda Y, Larimer FW, Chain PSG, Malfatti S, Shin MV, Vergez LM, Hauser L, Land ML, Braatsch S, Beatty JT, et al. Multiple genome sequences reveal adaptations of a phototrophic bacterium to sediment microenvironments. Proc. Natl Acad. Sci. USA. 2008;105:18543–18548. doi: 10.1073/pnas.0809160105. [DOI] [PMC free article] [PubMed] [Google Scholar]
- 42.Larimer FW, Chain P, Hauser L, Lamerdin J, Malfatti S, Do L, Land ML, Pelletier DA, Beatty JT, Lang AS, et al. Complete genome sequence of the metabolically versatile photosynthetic bacterium Rhodopseudomonas palustris. Nat. Biotechnol. 2004;22:55–61. doi: 10.1038/nbt923. [DOI] [PubMed] [Google Scholar]
- 43.Donner A, Koval JJ. The estimation of intraclass correlation in the analysis of family data. Biometrics. 1980;36:19–25. [PubMed] [Google Scholar]
- 44.Supek F, Vlahovicek K. Comparison of codon usage measures and their applicability in prediction of microbial gene expressivity. BMC Bioinformatics. 2005;6:15. doi: 10.1186/1471-2105-6-182. [DOI] [PMC free article] [PubMed] [Google Scholar]
- 45.R Development Core Team. 2009. R Foundation for Statistical Computing. [Google Scholar]
- 46.Martin HG, Ivanova N, Kunin V, Warnecke F, Barry KW, McHardy AC, Yeates C, He SM, Salamov AA, Szeto E, et al. Metagenomic analysis of two enhanced biological phosphorus removal (EBPR) sludge communities. Nat. Biotechnol. 2006;24:1263–1269. doi: 10.1038/nbt1247. [DOI] [PubMed] [Google Scholar]
- 47.Burke C, Steinberg P, Rusch D, Kjelleberg S, Thomas T. Bacterial community assembly based on functional genes rather than species. Proc. Natl Acad. Sci. 2011;108:14288–14293. doi: 10.1073/pnas.1101591108. [DOI] [PMC free article] [PubMed] [Google Scholar]
- 48.Johnson DB. Biodiversity and ecology of acidophilic microorganisms. Fems. Microbiol. Ecol. 1998;27:307–317. [Google Scholar]
- 49.Botzman M, Margalit H. Variation in global codon usage bias among prokaryotic organisms is associated with their lifestyles. Genome Biol. 2011;12:R109. doi: 10.1186/gb-2011-12-10-r109. [DOI] [PMC free article] [PubMed] [Google Scholar]
- 50.Retchless AC, Lawrence JG. Ecological adaptation in bacteria: speciation driven by codon selection. Mol. Biol. Evol. 2012;29:3669–3683. doi: 10.1093/molbev/mss171. [DOI] [PMC free article] [PubMed] [Google Scholar]
- 51.Arumugam M, Raes J, Pelletier E, Le Paslier D, Yamada T, Mende DR, Fernandes GR, Tap J, Bruls T, Batto JM, et al. Enterotypes of the human gut microbiome. Nature. 2011;473:174–180. doi: 10.1038/nature09944. [DOI] [PMC free article] [PubMed] [Google Scholar]
- 52.McDaniel LD, Young E, Delaney J, Ruhnau F, Ritchie KB, Paul JH. High frequency of horizontal gene transfer in the oceans. Science. 2010;330:50. doi: 10.1126/science.1192243. [DOI] [PubMed] [Google Scholar]
- 53.Boto L. Horizontal gene transfer in evolution: facts and challenges. Proc. Biol. Sci. 2010;277:819–827. doi: 10.1098/rspb.2009.1679. [DOI] [PMC free article] [PubMed] [Google Scholar]
- 54.Caro-Quintero A, Deng J, Auchtung J, Brettar I, Hofle MG, Klappenbach J, Konstantinidis KT. Unprecedented levels of horizontal gene transfer among spatially co-occurring Shewanella bacteria from the Baltic Sea. ISME J. 2011;5:131–140. doi: 10.1038/ismej.2010.93. [DOI] [PMC free article] [PubMed] [Google Scholar]
- 55.Kuo CH, Ochman H. The fate of new bacterial genes. FEMS Microbiol. Rev. 2009;33:38–43. doi: 10.1111/j.1574-6976.2008.00140.x. [DOI] [PubMed] [Google Scholar]
- 56.Malmstrom RR, Rodrigue S, Huang KH, Kelly L, Kern SE, Thompson A, Roggensack S, Berube PM, Henn MR, Chisholm SW. Ecology of uncultured Prochlorococcus clades revealed through single-cell genomics and biogeographic analysis. ISME J. 2013;7:184–198. doi: 10.1038/ismej.2012.89. [DOI] [PMC free article] [PubMed] [Google Scholar]
- 57.Tuller T. Codon bias, tRNA pools and horizontal gene transfer. Mob. Genet. Elements. 2011;1:75–77. doi: 10.4161/mge.1.1.15400. [DOI] [PMC free article] [PubMed] [Google Scholar]
- 58.Diene SM, Merhej V, Henry M, El Filali A, Roux V, Robert C, Azza S, Gavory F, Barbe V, La Scola B, et al. The rhizome of the multidrug-resistant Enterobacter aerogenes genome reveals how new “killer bugs” are created because of a sympatric lifestyle. Mol. Biol. Evol. 2013;30:369–383. doi: 10.1093/molbev/mss236. [DOI] [PubMed] [Google Scholar]
- 59.Forsberg KJ, Reyes A, Wang B, Selleck EM, Sommer MO, Dantas G. The shared antibiotic resistome of soil bacteria and human pathogens. Science. 2012;337:1107–1111. doi: 10.1126/science.1220761. [DOI] [PMC free article] [PubMed] [Google Scholar]
Associated Data
This section collects any data citations, data availability statements, or supplementary materials included in this article.