

Abstract
Nucleic acid binding proteins are generally viewed as either specific or non-specific, depending on characteristics of their binding sites in DNA or RNA 1,2. Most studies have focused on specific proteins, which identify cognate sites by binding with highest affinities to regions with defined signatures in sequence, structure, or both 1–4. Proteins that bind to sites devoid of defined sequence or structure signatures are considered non-specific 1,2,5. Substrate binding by these proteins is poorly understood, and it is not known to what extent seemingly non-specific proteins discriminate between different binding sites, aside from those sequestered by nucleic acid structures 6. Here, we systematically examine substrate binding by the apparently non-specific RNA-binding protein C5, and find clear discrimination between different binding site variants. C5 is the protein subunit of the tRNA processing ribonucleoprotein enzyme RNase P from E. coli. The protein binds 5′ leaders of precursor tRNAs at a site without sequence or structure signatures. We measure functional binding of C5 to all possible sequence variants in its substrate binding site, using a high-throughput sequencing kinetics approach (HiTS-Kin) that simultaneously follows processing of thousands of RNA species. C5 binds different substrate variants with affinities varying by orders of magnitude. The distribution of functional affinities of C5 for all substrate variants strikingly resembles affinity distributions of highly specific nucleic acid binding proteins. Unlike these specific proteins, C5 does not bind its physiological RNA targets with the highest affinity, but with affinities near the median of the distribution, a region not associated with a sequence signature. We delineate defined rules governing substrate recognition by C5, which reveal specificity that is hidden in cellular substrates for RNase P. Our findings suggest that apparently non-specific and specific RNA binding modes might not fundamentally differ, but represent distinct parts of common affinity distributions.
The term “non-specific” is widely used to describe proteins that bind DNA or RNA substrates at sites without apparent sequence or structure signatures 1,2,5. Although “non-specific” proteins are numerous and play many important biological roles, it is a central open question whether the absence of defined recognition elements in nucleic acid binding sites reflects largely indiscriminate substrate binding, or if and how non-specific proteins discriminate between different binding sites. To answer this question, we systematically examined substrate binding for the apparently non-specific RNA binding protein C5, the protein subunit of RNase P from E. coli. RNase P is a ribonucleoprotein enzyme that removes 5′ leader sequences from precursor tRNA (ptRNA) in Bacteria 7 (Fig. 1a). The C5 protein promotes ptRNA processing by RNase P 8, and contributes to ptRNA binding by associating with six consecutive nucleotides in the 5′ ptRNA leaders 9,10 (Fig. 1a,b). This binding site displays no apparent sequence or structure signatures in the 87 genomically encoded E. coli ptRNA leaders (Extended Data Fig. 1).
Fig. 1. Processing of ptRNA with randomized leader sequences.

(a) ptRNA processing reaction by RNase P. (b) Structure of the RNase P holoenzyme 9. (c) Sequences of non-initiator ptRNAMet leaders (reference: black; randomized: red). The tRNA body is omitted for clarity. The arrow indicates the cleavage site. (d) Timecourses of RNase P processing of ptRNAMet82 (black), and ptRNAMet(-3-8N) (red), in the presence (filled circles), and in the absence of C5 (open circles). The solid lines are fits to the integrated rate equation for a biphasic first order reaction. (e) PAGE of reactions processed for Illumina sequencing. (f) Distributions of species for individual timepoints, ranked from fastest to slowest. Distributions are normalized to t = 0.
To determine whether and how C5 discriminates between different binding sites, we measured functional binding of C5 to all sequence variants in its cognate ptRNA site. Here, functional binding reflects productive substrate association in an ongoing enzymatic reaction. It is expressed by the specificity constant (kcat/Km) for a given substrate variant, which measures biologically relevant specificity 11,12. To simultaneously determine functional binding of C5 to all substrate variants, we generated precursor tRNA (non-initiator ptRNAMet) with a randomized C5 binding site (Fig. 1c), and followed the processing reaction of this ptRNAMet(-3-8N) population (Fig. 1d). Reactions were conducted with excess ptRNAMet(-3-8N). Under these multiple turnover conditions all sequence variants compete for C5 association, and the relative reaction rate for each variant reflects functional binding 13.
The timecourse for the reaction of the randomized ptRNAMet(-3-8N) population differed markedly from the timecourse of ptRNAMet82 with a genomically encoded leader (Fig. 1d). This difference indicates that sequence variation affects functional binding by C5. Removal of C5 slowed the reaction rate as expected and greatly diminished the kinetic differences between the substrates with the genomically encoded and the randomized leaders (Fig. 1d).
To determine reaction rate constants for the individual substrate variants, we isolated remaining substrates at various reaction times and measured the distribution of the RNA species by Illumina sequencing (Fig. 1e,f, Extended Data Fig. 2, Extended Data Tab. 1). We used primers with degenerate barcodes to detect biased amplification of sequences during the PCR (Extended Data Fig. 2, Extended Data Tab. 1). Of the 4,096 sequence variants, 2,900 showed unbiased amplification and were retained for further analysis. The distribution of sequence variants changed over the reaction time, revealing distinct fast and slow reacting species (Fig. 1f). These data demonstrate that C5 discriminates between different sequence variants, despite the lack of sequence signatures in genomically encoded E. coli ptRNA leaders.
We calculated a relative processing rate constant rk for each RNA variant, using internal competition analysis, developed for the evaluation of kinetic isotope effects (Extended Data Fig. 3) 13–15. The rk value is the ratio between the kcat/Km values for the given sequence variant and our reference sequence, the physiological leader AAAAAG. The relative rate constants for all sequence variants describe C5 binding to the entire sequence space of the six nucleotide recognition site. Our approach to measure functional binding of large numbers of substrates during an ongoing reaction adds a kinetic dimension to the scope of high throughput sequencing experiments with randomized RNA populations 3,4,16,17. We therefore propose to term our method High Throughput Sequencing Kinetics (HiTS-Kin). The approach is applicable to other systems for kinetic analysis of next generation sequencing data.
For the ptRNA processing reaction with C5, the HiTS-Kin method revealed a range of relative rate constants spanning several orders of magnitude (Fig. 2a). Obtained relative rate constants were highly reproducible in independent experiments (Fig. 2b). We also validated rate constants by direct kinetic measurements of selected sequence variants (Fig. 2c, Extended Data Fig. 4). Together, these data show that the HiTS-Kin approach provides reproducible and accurate relative rate constants.
Fig. 2. Discrimination of C5 between different ptRNAMet leader sequences.

(a) Relative rate constants (rk) for processing of all ptRNA leader sequence variants, ranked from slow to fast. Relative rate constants are averaged from four values (two timepoints of two experiments) and shown for only sequences where data from all four measurements passed quality control criteria (Extended Data Tab. 1). The line at rk = 1 marks the reference sequence. (b) Correlation of relative rate constants from two independent biological replicates (red line: linear fit through the data, R2: correlation coefficient). (c) Correlation between relative rate constants obtained by PAGE and by the HiTS-Kin approach for selected sequence variants. Error bars represent the standard deviation of multiple individual experiments. (d) Distribution of relative rate constants for processing of ptRNAMet(-3-8N) sequence variants by C5 (black) and apparent affinities for DNA binding by the transcription factor Arid3a, indicated as Z-scores based on published microarray data 18. The Z-score is not identical to rk values, but accurately reflects affinity-based ranking of all sequences 18 (triangles: rk values for genomic leader sequences of ptRNAMet). (e) Plot of all sequence variants ranked from slowest to fastest processed. The bracket marks of 0.3% of sequence variants with the largest relative rate constants. (f) Sequence logo for this fraction.
Next, we plotted the number of sequence variants processed at a given range of relative rate constants (Fig. 2d). The resulting histogram revealed that a significant number of sequence variants reacted faster than the physiological leader reference (rk > 1). Numerous sequence variants reacted slower (rk < 1). These observations indicate that physiological leader sequences of non-initiator ptRNAMet are not preferentially bound by C5. Removal of C5 greatly contracted the range of relative rate constants, highlighting the impact of C5 on functional substrate binding and on the characteristic affinity distribution (Extended Data Fig. 5).
Most strikingly, the shape of the distribution of functional C5 affinities closely resembled affinity distributions of highly specific DNA binding proteins, for which large numbers of sequence variants had been examined 18–21 (Fig. 2d). This degree of similarity between the non-specific C5 and specific proteins was unexpected, given the absence of sequence signatures in the C5 binding site. For specific proteins, the cellular substrates that define binding site signatures are found at the high affinity tail of the distribution 18,19 (Extended Data Fig. 6a,b). Remarkably, this high affinity region for C5 also shows a clear sequence signature (Fig. 2e,f), as seen for specific proteins. In stark contrast to specific proteins, the C5 sequence signature does not correspond to the physiological binding sites on the non-initiator ptRNAMet. None of the genomically encoded non-initiator ptRNAMet leader sequences falls into this fastest reacting fraction (Fig. 2d). For both C5 and specific proteins, no sequence signatures were detected for other regions of the sequence spectrum (Extended Data Fig. 6). Our results thus reveal remarkable similarities between sequence discrimination by the apparently non-specific C5 and by specific DNA binding proteins. At the same time, our data highlight a major difference: sequences bound with the highest affinity do not represent physiological substrates for C5, but for specific DNA binding proteins with known affinity distributions.
To delineate sequence determinants that govern substrate recognition by C5, we fit the distribution of rate constants to models of increasing complexity and determined which percentage of the measured variance in the rate constants was explained by the respective model. Our simplest model considered only the number of a given nucleotide in the binding site, regardless of position. This model explained 29% of the variance in the measured rate constants (Fig. 3a, left panel). The model suggested favorable binding of A/U rich sequences (Extended Data Fig. 7a). Since A/U basepairs are thermodynamically less stable than G/C basepairs, we speculate that the variance explained by this model reflects in part the propensity of the leader to form transient structures with other parts of the ptRNA 22, which potentially compete with C5 binding. While competing structures are generally expected in RNAs with more than two dozen nucleotides 23, the relatively low correlation of the model with measured rate constants suggests that competing RNA structures have only limited impact on C5 binding for the majority of sequences.
Fig. 3. Rules for sequence discrimination by C5.
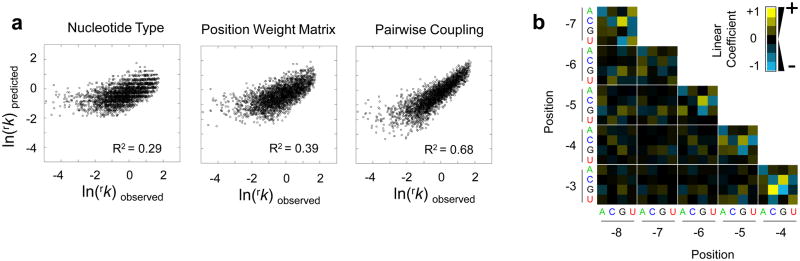
(a) Correlation between observed rk and values calculated with the best fit of the data to models of increasing complexity. Logarithmic rk values are used because of their correspondence to differences in binding energies 30. R2 expresses the correlation of each model with measured processing rate constants. (b) Functional coupling between two base positions. Yellow squares show promotion of processing (high linear coefficients), black squares indicate small or no effects, blue squares mark inhibition of processing.
We next considered both base identity and position in the binding site. This model, a traditional Position Weight Matrix 21, explained 39% of the variance in measured rate constants (Fig. 3a middle panel, Extended Data Fig. 7b). This modest improvement over the previous model indicated that the position of individual bases in the binding site impacted C5 binding only to a limited extent. However, the Position Weight Matrix assesses the bases independent of each other 21. To probe interdependence of the bases in the binding site, we employed a model accounting for functional coupling between two bases. This model explained 68% of the variance in measured rate constants (Fig. 3a, right panel). The strongest couplings were detected between neighboring bases (Fig. 3b).
The observed strength of the couplings between adjacent bases did not scale with energies expected to overcome stacking of the respective bases 22. This finding suggests that the couplings result from interactions of the RNA with C5, not primarily from inherent RNA conformations. Functional couplings between more than two base positions, assessed by neural network analysis, only modestly improved correlation between predicted and measured data, and explained 76% of the variance (Extended Data Fig. 8). Thus, functional couplings between adjacent bases exert the largest influence on C5 binding. The limited resolution of the structural model of RNase P protein bound to RNA 9 currently precludes structural interpretation of these effects. However, we note that functional coupling between neighboring bases also contributes markedly to the binding of several specific transcription factors to DNA 21,24,25.
Taken together, the examination of the functional binding data with models of increasing complexity reveals defined rules for substrate binding by C5. The data demonstrate that discrimination between different substrates, and thus specificity, is an inherent property of C5. However, this specificity is “hidden” in the cellular RNA targets. This observation raises the question why the specificity in C5 has not led to selection of ptRNA leaders with high affinity sequence signatures, as seen in proteins with canonical specificity 18–21. Our data suggest a farther reaching utility of specificity. C5 employs its inherent specificity, as reflected in the rules for substrate recognition, to enable binding of diverse substrate variants with similar functional affinity. This enables RNase P to process these diverse substrates at a similar rate, which may be required for cellular tRNA homeostasis 26.
The striking similarities between affinity distributions of C5 and those of highly specific transcription factors also raise questions about the concept of “non-specific” RNA binding proteins. Given that RNA binding requires a protein interface to establish interactions with the RNA, certain RNA sequence or structure variants conceivably fit this interface better than others. Genuine “non-specificity” might thus be difficult to accomplish, even for proteins binding exclusively to the RNA backbone, because sequence differences impact backbone geometry 27. Differences between substrate variants may become smaller for proteins that bind to the backbone of RNA duplexes, which show less structural heterogeneity, but are nevertheless dynamic 28.
Preferences of apparently non-specific proteins for certain binding site variants are thus likely to impact substrate selection, unless compensation for these preferences exist. Compensation may arise from varying concentrations of RNA species, rate determining metabolic steps other than substrate binding, or a combination thereof. Alternatively, a single protein could bind multiple distinct substrate regions while thermodynamically compensating for the preferences at each region, as shown for uniform binding of diverse aminoacyl tRNAs to EF-Tu 29.
While hidden specificity remains to be revealed for other proteins, the findings for C5 indicate that absence of sequence or structure signatures in cellular binding sites does not reflect an inability to discriminate between different RNA binding sites. At the same time, the data highlight the key difference between the hidden specificity of C5 and proteins that are specific in a canonical sense. For proteins with canonical specificity, cellular substrates appear to fall mainly into the high affinity region of the sequence distribution. This region is associated with sequence signatures, even for C5. Biological substrates for C5 bind near the median of the affinity distribution, which does not produce a sequence signature. These findings suggest that specific and “non-specific” binding modes might not fundamentally differ, but represent distinct parts of similar affinity distributions. Our data thus have potentially broad implications for RNA binding by proteins thought to be “non-specific”, including many RNases, RNA helicases, or the La-protein.
Methods Summary
ptRNAs and ptRNAMet with randomized leader sequences were produced by in vitro transcription from PCR-generated templates. RNase P processing reactions were performed with 1 μM ptRNA and 5 nM RNase P holoenzyme (equimolar RNase P RNA and C5). Product and unreacted ptRNA were separated by PAGE. cDNA libraries for Illumina sequencing were prepared from unreacted ptRNA at each given timepoint. Primers with degenerate barcodes were used to detect biased PCR amplification of certain sequences. Sequencing was performed on an Illumina GA2. Relative rate constants rk for individual substrate variants were calculated from changes in the distribution of substrates over time, using a multiple turnover reaction scheme for competitive substrate kinetics, which was extended to several thousand substrates. Computational modeling for the rules of substrate discrimination was performed by ordinary least squares regression of the matrix of values for ln(rk) for each sequence variant according to four models of increasing complexity. The quality of the different models was judged by the correlation coefficient between a dataset calculated from values obtained from the regression analysis and the set of experimentally obtained values for ln(rk).
Supplementary Material
Alignment and sequence logos for the C5 binding site in all 87 ptRNA leaders encoded by E. coli. Binding of C5 to the consecutive ptRNA positions −3 to −8 is well established, based on a crystal structure 9 and biochemical evidence 10. That is, looping of bases seen for certain RNA and DNA binding proteins, does not occur with C5. Consistent with this notion, we did not detect any sequence motif with the MEME software, when including positions −1 to −10. (a) Sequence alignment. Sequences were aligned with CLUSTAL. Colored squares indicate the bases (C: blue, A: green, U: red, G: black), “tRNA #” the tRNA ID number, “tRNA type” the amino acid, and “Anticodon” the anticodon recognized by the tRNA. (b) Sequence logo depicting the probability of any base at a given position, based on the alignment in panel (a). The logo was generated with Weblogo. (c) Sequence logo for the information content of the alignment in panel (a). The logo was generated with Weblogo.
(a) Preparation of DNA libraries for Illumina sequencing. NN indicates the degenerated barcode, BAR the indexing barcode. For primer sequences see Supplementary Methods. (b) DNA libraries (PCR products, panel (a)) for samples at the timepoints indicated. Controls: lane 5 - no RNA, lane 6 - no reverse transcriptase. (c) Read structure. nt 1,2 -degenerated barcode, nt 3 - 5: sample barcode (index tag), nt 6–29: additional leader sequence, nt 30–35: randomized leader sequence, nt > 38: tRNA.
Sequencing data. Overall number of reads obtained for the respective timepoints in the independent replicate experiments 1 and 2, and number of reads that passed the quality control.
(a) The fraction of processed ptRNA was determined from PAGE data (Fig. 1e, Supplementary Methods).
(b) Read numbers after filtering for potential PCR artifacts for each sequence variant (Supplementary Methods).
Multiple turnover reaction scheme. E: enzyme, S1....i: individual substrate variants, ES1...i: individual enzyme substrate complexes, K1...i: individual functional binding constants, V1...i: individual reaction rate constants.
Effect of the 21 nt extension on ptRNA processing by RNase P for fast, intermediate and slow reacting leader sequences. (a) Relative processing rate constants were measured for three sequence variants from different parts of the affinity distribution by PAGE. Reactions for each sequence variant were conducted in the presence of the randomized population (unlabeled) with equal amounts of substrate with (S/21) and without the 21 nt extension (S/nL). The asterisk marks the position of the radiolabel at the 5′ end of the substrate. Reactions were conducted under the conditions described in Methods. (b) PAGE for the reaction of the reference sequence variant. The timepoint at 5 min is marked for reference. (c) Effects of the 21 nt extension on relative processing rate constants of the three indicated sequence variants. The position of each sequence variant in the affinity distribution of all sequence variants (Fig. 2d) is given for reference by the vertical line above the plot. The number indicates the factor (S/nL)/(S/21) by which the 21 nt extension decreases the relative rate constant of the given sequence variant, given as average from three independent experiments. The horizontal line approximates the degree of the relative change. The 21 nt extension decreases the observed rk for sequence variant (CTCCTG) by a factor of 2.3. For the genomically encoded leader sequence AAAAAG, the 21 nt extension decreases rk for by a factor of 0.95, i.e., the substrate with the extension reacts slightly faster than the substrate without extension. The fast reacting substrate (TTATAT) is also only minimally affected by the extension (0.92). Together, the data show only minor effects of the 21 nt extension on the position of a given sequence variant in the affinity distribution.
Distribution of rk values for processing of ptRNAMet(-3-8) by RNase P without C5 (black line). Data were obtained analogously to those with C5. For comparison, the distribution of rk values with C5 is shown (red line).
Sequence logos are only associated with the high affinity tail of the distribution. (a) Plot of sequence variants ranked from weakest to tightest binder to the specific transcription factor Arid3a (Fig. 2d), based on data published by Badis et al. 18. To facilitate direct comparison to the 6 nt bindig site of C5, only roughly half of all sequences are shown in the plot, and only 6 positions (2 to 7, as indicated) of the 8 nt binding site are shown. The position in the binding site is marked on the right. The brackets mark 0.1% of sequence variants (33 sequences) that bind tightest, fall into the medium, and bind weakest. Sequence logos show the information content in these sequences. The logos were generated with Weblogo. Sequence signatures of the tightest binding variants are highly enriched in physiological substrates of Arid3a 18. (b) Plot of sequence variants ranked from weakest to tightest binder to another specific transcription factor, Hnf4a, based on data published by Badis et al. 18. Roughly half of all sequences are shown in the plot, and 6 positions (2 to 7, as indicated) of the 8 nt binding site. Sequence signatures of the tightest binding variants are highly enriched in physiological substrates of Hnf4A 18. (c) Plot of sequence variants ranked from slowest to fastest reacting for C5 (Fig. 2e). The brackets mark 1% of sequence variants that react fastest bind tightest, fall into the medium and react slowest. Sequence logos were generated as in panel (a).
Sequence determinants for substrate recognition by C5. (a) Model considering identity, but not position of a given base in the C5 binding site. Ranking of the four bases according to their potential to promote (positive linear coefficient) or decrease (negative linear coefficient) functional C5 binding. For calculation of linear coefficients, see Methods. (b) Position Weight Matrix (PWM) model considering both, base identity and position in the binding site, but assuming independent contributions of each position. The plot shows the ranking of the bases according to their potential to promote (positive linear coefficient) or decrease (negative linear coefficient) functional C5 binding, relative to the reference sequence (AAAAAG, Fig. 1c). Bases are colored as in panel (a). For calculation of linear coefficients, see Methods.
Correlation between observed rk and values calculated with the best model obtained by neural network analysis (Supplementary Methods).
Acknowledgments
We particularly thank T. Nilsen for helpful comments on the manuscript. We are grateful to G. Stormo for insightful discussion, M. Adams for support with the Illumina sequencing, and H-C Lin for technical assistance. This work was supported by the NIH (GM067700, GM099720 and CSTA UL1RR024989 to E.J.; GM056740 and GM096000 to M.E.H.; T32 GM005086 to C.E.N.). U.P.G received a DFG fellowship.
Footnotes
Author Contributions
U.P.G., M.E.H. and E.J. designed the study. U.P.G, L.E.Y, C.N.N. and F.E.C performed the experiments. V.E.A. contributed to the development of the data analysis framework. D.A. developed and performed the modeling for binding models. U.P.G., D.A., M.E.H., and E.J. analyzed the data. U.P.G., M.E.H. and E.J. wrote the paper.
Reprints and permissions information is available at www.nature.com/reprints. The authors declare no competing financial interests.
References
- 1.Gupta A, Gribskov M. The role of RNA sequence and structure in RNA-protein interactions. J Mol Biol. 2011;409:574–587. doi: 10.1016/j.jmb.2011.04.007. [DOI] [PubMed] [Google Scholar]
- 2.von Hippel PH, Berg OG. On the specificity of DNA-protein interactions. Proc Natl Acad Sci USA. 1986;83:1608–1612. doi: 10.1073/pnas.83.6.1608. [DOI] [PMC free article] [PubMed] [Google Scholar]
- 3.Ray D, et al. Rapid and systematic analysis of the RNA recognition specificities of RNA-binding proteins. Nat Biotechnol. 2009;27:667–670. doi: 10.1038/nbt.1550. [DOI] [PubMed] [Google Scholar]
- 4.Campbell ZT, et al. Cooperativity in RNA-protein interactions: Global analysis of RNA binding specificity. Cell Rep. 2012;1:570–581. doi: 10.1016/j.celrep.2012.04.003. [DOI] [PMC free article] [PubMed] [Google Scholar]
- 5.Singh R, Valcárcel J. Building specificity with nonspecific RNA-binding proteins. Nat Struct Mol Biol. 2005;12:645–653. doi: 10.1038/nsmb961. [DOI] [PubMed] [Google Scholar]
- 6.Zhuang F, Fuchs RT, Sun Z, Zheng Y, Robb GB. Structural bias in T4 RNA ligase-mediated 3′-adapter ligation. Nucleic Acids Res. 2012;40:e54. doi: 10.1093/nar/gkr1263. [DOI] [PMC free article] [PubMed] [Google Scholar]
- 7.Kurz JC, Fierke CA. Ribonuclease P: a ribonucleoprotein enzyme. Curr Opin Chem Biol. 2000;4:553–558. doi: 10.1016/s1367-5931(00)00131-9. [DOI] [PubMed] [Google Scholar]
- 8.Smith JK, Hsieh J, Fierke CA. Importance of RNA-protein interactions in bacterial ribonuclease P structure and catalysis. Biopolymers. 2007;87:329–338. doi: 10.1002/bip.20846. [DOI] [PubMed] [Google Scholar]
- 9.Reiter NJ, et al. Structure of a bacterial ribonuclease P holoenzyme in complex with tRNA. Nature. 2010;468:784–789. doi: 10.1038/nature09516. [DOI] [PMC free article] [PubMed] [Google Scholar]
- 10.Rueda D, Hsieh J, Day-Storms JJ, Fierke CA, Walter NG. The 5′ leader of precursor tRNAAsp bound to the Bacillus subtilis RNase P holoenzyme has an extended conformation. Biochemistry. 2005;44:16130–16139. doi: 10.1021/bi0519093. [DOI] [PubMed] [Google Scholar]
- 11.Herschlag D. The role of induced fit and conformational changes of enzymes in specificity and catalysis. Bioorg Chem. 1988;16:62–96. [Google Scholar]
- 12.Fersht AR. Enzyme Structure and Mechanism. Freeman; New York: 1985. [Google Scholar]
- 13.Cornish-Bowden A. Enzyme specificity: its meaning in the general case. J Theor Biol. 1984;108:451–457. doi: 10.1016/s0022-5193(84)80045-4. [DOI] [PubMed] [Google Scholar]
- 14.Cleland WW. In: Isotope Effects in Chemistry and Biology. Kohen A, Limbach HH, editors. CRC Press; 2006. pp. 915–930. [Google Scholar]
- 15.Schellenberger V, Siegel RA, Rutter WJ. Analysis of enzyme specificity by multiple substrate kinetics. Biochemistry. 1993;32:4344–4348. doi: 10.1021/bi00067a025. [DOI] [PubMed] [Google Scholar]
- 16.Lorenz C, et al. Genomic SELEX for Hfq-binding RNAs identifies genomic aptamers predominantly in antisense transcripts. Nucleic Acids Res. 2010;38:3794–3808. doi: 10.1093/nar/gkq032. [DOI] [PMC free article] [PubMed] [Google Scholar]
- 17.Pitt JN, Ferré-D’Amaré AR. Rapid construction of empirical RNA fitness landscapes. Science. 2010;330:376–379. doi: 10.1126/science.1192001. [DOI] [PMC free article] [PubMed] [Google Scholar]
- 18.Badis G, et al. Diversity and complexity in DNA recognition by transcription factors. Science. 2009;324:1720–1723. doi: 10.1126/science.1162327. [DOI] [PMC free article] [PubMed] [Google Scholar]
- 19.Rowe W, et al. Analysis of a complete DNA-protein affinity landscape. J R Soc Interface. 2009;7:397–408. doi: 10.1098/rsif.2009.0193. [DOI] [PMC free article] [PubMed] [Google Scholar]
- 20.Nutiu R, et al. Direct measurement of DNA affinity landscapes on a high-throughput sequencing instrument. Nat Biotechnol. 2011;29:659–664. doi: 10.1038/nbt.1882. [DOI] [PMC free article] [PubMed] [Google Scholar]
- 21.Stormo G, Zhao Y. Determining the specificity of protein - DNA interactions. Nat Rev Genetics. 2010;11:751–760. doi: 10.1038/nrg2845. [DOI] [PubMed] [Google Scholar]
- 22.SantaLucia JJ, Turner DH. Measuring the thermodynamics of RNA secondary structure formation. Biopolymers. 1997;44:309–319. doi: 10.1002/(SICI)1097-0282(1997)44:3<309::AID-BIP8>3.0.CO;2-Z. [DOI] [PubMed] [Google Scholar]
- 23.Forsdyke DR. Calculation of folding energies of single-stranded nucleic acid sequences: conceptual issues. J Theor Biol. 2007;248:745–753. doi: 10.1016/j.jtbi.2007.07.008. [DOI] [PubMed] [Google Scholar]
- 24.Maerkl SJ, Quake SR. A systems approach to measuring the binding energy landscapes of transcription factors. Science. 2007;315:233–237. doi: 10.1126/science.1131007. [DOI] [PubMed] [Google Scholar]
- 25.Zhao Y, Stormo G. Quantitative analysis demonstrates most transcription factors require only simple models of specificity. Nature Biotechnol. 2011;6:480–483. doi: 10.1038/nbt.1893. [DOI] [PMC free article] [PubMed] [Google Scholar]
- 26.Sun L, Campbell FE, Yandek LE, Harris ME. Binding of C5 protein to P RNA enhances the rate constant for catalysis for P RNA processing of pre-tRNAs lacking a consensus (+ 1)/C(+ 72) pair. J Mol Biol. 2010;395:1019–1037. doi: 10.1016/j.jmb.2009.11.027. [DOI] [PMC free article] [PubMed] [Google Scholar]
- 27.Leontis NB, Lescoute A, Westhof E. The building blocks and motifs of RNA architecture. Curr Opin Struct Biol. 2006;16:279–287. doi: 10.1016/j.sbi.2006.05.009. [DOI] [PMC free article] [PubMed] [Google Scholar]
- 28.Snoussi K, Leroy JL. Imino proton exchange and base-pair kinetics in RNA duplexes. Biochemistry. 2001;40:8898–8904. doi: 10.1021/bi010385d. [DOI] [PubMed] [Google Scholar]
- 29.LaRiviere FJ, Wolfson AD, Uhlenbeck OC. Uniform binding of aminoacyl-tRNAs to elongation factor Tu by thermodynamic compensation. Science. 2001;294:165–168. doi: 10.1126/science.1064242. [DOI] [PubMed] [Google Scholar]
- 30.Stormo GD, Schneider TD, Gold L. Quantitative analysis of the relationship between nucleotide sequence and functional activity. Nucleic Acids Res. 1986;14:6661–66679. doi: 10.1093/nar/14.16.6661. [DOI] [PMC free article] [PubMed] [Google Scholar]
Associated Data
This section collects any data citations, data availability statements, or supplementary materials included in this article.
Supplementary Materials
Alignment and sequence logos for the C5 binding site in all 87 ptRNA leaders encoded by E. coli. Binding of C5 to the consecutive ptRNA positions −3 to −8 is well established, based on a crystal structure 9 and biochemical evidence 10. That is, looping of bases seen for certain RNA and DNA binding proteins, does not occur with C5. Consistent with this notion, we did not detect any sequence motif with the MEME software, when including positions −1 to −10. (a) Sequence alignment. Sequences were aligned with CLUSTAL. Colored squares indicate the bases (C: blue, A: green, U: red, G: black), “tRNA #” the tRNA ID number, “tRNA type” the amino acid, and “Anticodon” the anticodon recognized by the tRNA. (b) Sequence logo depicting the probability of any base at a given position, based on the alignment in panel (a). The logo was generated with Weblogo. (c) Sequence logo for the information content of the alignment in panel (a). The logo was generated with Weblogo.
(a) Preparation of DNA libraries for Illumina sequencing. NN indicates the degenerated barcode, BAR the indexing barcode. For primer sequences see Supplementary Methods. (b) DNA libraries (PCR products, panel (a)) for samples at the timepoints indicated. Controls: lane 5 - no RNA, lane 6 - no reverse transcriptase. (c) Read structure. nt 1,2 -degenerated barcode, nt 3 - 5: sample barcode (index tag), nt 6–29: additional leader sequence, nt 30–35: randomized leader sequence, nt > 38: tRNA.
Sequencing data. Overall number of reads obtained for the respective timepoints in the independent replicate experiments 1 and 2, and number of reads that passed the quality control.
(a) The fraction of processed ptRNA was determined from PAGE data (Fig. 1e, Supplementary Methods).
(b) Read numbers after filtering for potential PCR artifacts for each sequence variant (Supplementary Methods).
Multiple turnover reaction scheme. E: enzyme, S1....i: individual substrate variants, ES1...i: individual enzyme substrate complexes, K1...i: individual functional binding constants, V1...i: individual reaction rate constants.
Effect of the 21 nt extension on ptRNA processing by RNase P for fast, intermediate and slow reacting leader sequences. (a) Relative processing rate constants were measured for three sequence variants from different parts of the affinity distribution by PAGE. Reactions for each sequence variant were conducted in the presence of the randomized population (unlabeled) with equal amounts of substrate with (S/21) and without the 21 nt extension (S/nL). The asterisk marks the position of the radiolabel at the 5′ end of the substrate. Reactions were conducted under the conditions described in Methods. (b) PAGE for the reaction of the reference sequence variant. The timepoint at 5 min is marked for reference. (c) Effects of the 21 nt extension on relative processing rate constants of the three indicated sequence variants. The position of each sequence variant in the affinity distribution of all sequence variants (Fig. 2d) is given for reference by the vertical line above the plot. The number indicates the factor (S/nL)/(S/21) by which the 21 nt extension decreases the relative rate constant of the given sequence variant, given as average from three independent experiments. The horizontal line approximates the degree of the relative change. The 21 nt extension decreases the observed rk for sequence variant (CTCCTG) by a factor of 2.3. For the genomically encoded leader sequence AAAAAG, the 21 nt extension decreases rk for by a factor of 0.95, i.e., the substrate with the extension reacts slightly faster than the substrate without extension. The fast reacting substrate (TTATAT) is also only minimally affected by the extension (0.92). Together, the data show only minor effects of the 21 nt extension on the position of a given sequence variant in the affinity distribution.
Distribution of rk values for processing of ptRNAMet(-3-8) by RNase P without C5 (black line). Data were obtained analogously to those with C5. For comparison, the distribution of rk values with C5 is shown (red line).
Sequence logos are only associated with the high affinity tail of the distribution. (a) Plot of sequence variants ranked from weakest to tightest binder to the specific transcription factor Arid3a (Fig. 2d), based on data published by Badis et al. 18. To facilitate direct comparison to the 6 nt bindig site of C5, only roughly half of all sequences are shown in the plot, and only 6 positions (2 to 7, as indicated) of the 8 nt binding site are shown. The position in the binding site is marked on the right. The brackets mark 0.1% of sequence variants (33 sequences) that bind tightest, fall into the medium, and bind weakest. Sequence logos show the information content in these sequences. The logos were generated with Weblogo. Sequence signatures of the tightest binding variants are highly enriched in physiological substrates of Arid3a 18. (b) Plot of sequence variants ranked from weakest to tightest binder to another specific transcription factor, Hnf4a, based on data published by Badis et al. 18. Roughly half of all sequences are shown in the plot, and 6 positions (2 to 7, as indicated) of the 8 nt binding site. Sequence signatures of the tightest binding variants are highly enriched in physiological substrates of Hnf4A 18. (c) Plot of sequence variants ranked from slowest to fastest reacting for C5 (Fig. 2e). The brackets mark 1% of sequence variants that react fastest bind tightest, fall into the medium and react slowest. Sequence logos were generated as in panel (a).
Sequence determinants for substrate recognition by C5. (a) Model considering identity, but not position of a given base in the C5 binding site. Ranking of the four bases according to their potential to promote (positive linear coefficient) or decrease (negative linear coefficient) functional C5 binding. For calculation of linear coefficients, see Methods. (b) Position Weight Matrix (PWM) model considering both, base identity and position in the binding site, but assuming independent contributions of each position. The plot shows the ranking of the bases according to their potential to promote (positive linear coefficient) or decrease (negative linear coefficient) functional C5 binding, relative to the reference sequence (AAAAAG, Fig. 1c). Bases are colored as in panel (a). For calculation of linear coefficients, see Methods.
Correlation between observed rk and values calculated with the best model obtained by neural network analysis (Supplementary Methods).