

Abstract
The early diagnosis of diabetes, one of the top three chronic incurable diseases, is becoming increasingly important. Here, we investigated the applicability of an 18O-labeling technique for the development of a standard-free, label-free liquid chromatography-tandem mass spectrometry (LC-MS/MS) method for the early diagnosis of type 2 diabetes mellitus (T2DM). Rather than attempting to identify quantitative differences in proteins as biomarkers, glycation of the highest abundance protein in human plasma, human serum albumin (HSA), was monitored through quantitative analysis of HSA characteristic peptides using the 18O-labeling technique. Eight glucose-sensitive peptides and one glucose-insensitive peptide were discovered. The glucose-insensitive peptide served as the internal standard, and a standard-free, label-free LC-MS/MS method was developed. This method was then used to select putative biomarkers for T2DM in a clinical trial with 389 human plasma samples. As a result, three of the eight glucose-sensitive peptides (FKDLGEENFK, LDELRDEGK, and KVPQVSTPTLVEVSR) were selected and could be used as potential biomarkers for the early diagnosis of T2DM.
Diabetes is a group of metabolic diseases characterized by high blood glucose levels, resulting from the body not producing enough insulin or the cells not responding to the insulin produced (1). Among the 3 main types of diabetes (type 1, type 2, and gestational diabetes mellitus), type 2 diabetes mellitus (T2DM) is mainly characterized by insulin resistance, which is different from type 1 diabetes mellitus (T1DM) that results from the body's failure to produce insulin (1). Although diabetes has been controlled since insulin became available, it is still considered incurable and poses serious threats to human health (2). Reports have suggested that the hyperglycemic condition of patients with diabetes may be greatly alleviated or even reversed if it could be controlled at an early stage of diabetes (3). Thus, early detection and diagnosis of diabetes and prediabetes are become increasingly important in the treatment and prevention of diabetes (4).
Diabetes is currently diagnosed by recurrent or persistent hyperglycemia (5). In an effort to identify novel biomarkers for diabetes, research has shown that neither plasma glucose nor glycated hemoglobin (HbA1c) levels are able to be used in the early detection of diabetes (6–9). Plasma glucose is easily affected by patients’ lifestyle (e.g., food intake and body condition). HbA1c levels have a poor quantitative relationship with the accumulation of glycation and low sensitivity.
Therefore, additional biomarkers are being explored, including C-reactive protein (10), alanine aminotransferase (11), triglycerides (12), and plasminogen activator inhibitor (13). ELISA has been widely used in the detection of diabetes biomarkers (14–18). ELISA has high sensitivity because of the high catalytic efficiency of enzymes but requires knowledge of biomarkers and their corresponding antibodies. The concentration of serum advanced glycation end products (AGEs) is also recognized as a marker for monitoring the treatment of diabetes complications and can usually be detected by florescence (19). Besides these protein-level biomarkers, biomarkers on the peptide level, such as C-peptide, are becoming increasingly popular (20). Although a wide variety of biomarkers for diabetes exist, the sensitivities, feasibilities, and capabilities of these methods to detect diabetes at an early stage are limited.
With high sensitivity and specificity, mass spectrometry (MS)-based quantitative proteomics methods, including absolute and relative quantitative proteomics, have been applied in diabetes pathogenesis and biomarker explorations (21,22). Absolute quantitative proteomics uses a standard curve to quantify target proteins. A candidate diabetes biomarker, C-reactive protein, has been quantified using MS-based methods both with and without an affinity removal system (23,24). In addition, relative quantitative proteomics has also been used in diabetes biomarker discovery and mechanism studies. Combined with isotope-labeling techniques, Zhang et al. (25) demonstrated that S-nitrosation might be involved in the pathophysiology of T2DM. Different glycation states of hemoglobin have also been monitored in vitro with the glycation isotopic–labeling technique (26). Label-free techniques have also been used in the discovery of five biomarker candidates for T1DM. After six highly abundant plasma proteins were removed, liquid chromatography (LC)-MS was used in the identification and quantification of plasma proteins. Relative quantification was performed based on a mass spectra intensity global normalization procedure (27). In addition, Zhang and colleagues (28–30) developed a bottom-up proteomics method that applied boronate affinity chromatography and electron transfer dissociation tandem MS (MS/MS) analyses in the study of glycated proteins and peptides. They recently reported the identification of 7,749 unique glycated peptides through a similar process after removing 12 highly abundant plasma proteins (31). In our laboratory, we previously identified a series of AGE-precursors and AGEs after comparing glycated BSA peptides with unmodified BSA peptides (32).
Nonenzymatic glycation of proteins, also known as the Maillard or browning reaction, has recently attracted increased attention in proteomics research due to its clinical relevance to diabetes and related complications (33,34). As a nonenzymatic reaction, the Maillard reaction (glycation) does not have chemical selectivity. Therefore, higher abundance proteins have more opportunity to be modified by glucose in the plasma. As a result, quantification of glycation levels on high-abundance proteins by MS analysis is much more sensitive than testing plasma glucose to determine the presence of diabetes.
In this work, we developed a standard-free, label-free MS-based proteomics method for the early diagnosis of T2DM. The highest-abundance protein in human plasma (∼62%), human serum albumin (HSA), served as a glycation collector and was monitored through quantitative analysis of HSA characteristic peptides. This strategy is different from the traditional concept that almost all functional proteins are low-abundance proteins and, thus, that biomarkers for diseases should be screened from low-abundance proteins. Moreover, the use of the highest-abundance protein as the target makes the quantification accurate because glycation of high-abundance proteins is dominant in vivo, and the use of high-abundance protein as a target protein can drastically improve the sensitivity of the MS analysis by reducing detection errors. In addition, another reason peptide biomarkers were preferred in our study rather than protein biomarkers was because proteins in vivo could undergo several types of post-translational modifications, such as ubiquitination, phosphorylation, glycosylation, methylation, and acetylation (35). Each post-translational modification can possibly change the molecular weight of the target protein, which leads to difficulties in MS analysis.
RESEARCH DESIGN AND METHODS
Study design.
Figure 1 shows a complete workflow of the experiment. First, 18O-labeling, a convenient proteomics technique (36), was used to screen glucose-sensitive and glucose-insensitive peptides within HSA characteristic peptides. Next, a glucose-insensitive peptide was selected as the internal standard, and glucose-sensitive peptides underwent further screening as biomarker candidates. With the glucose-insensitive peptide as the internal standard, a standard-free quantitative method was then applied in the discovery of candidate peptide biomarkers for T2DM in a clinical plasma sample set. This sample set included three groups that were classified according to the fasting plasma glucose (FPG) levels and 2-h postprandial glucose (2hPG) of the individuals: T2DM group: FPG ≥7.0 mmol/L or 2hPG ≥11.1 mmol/L; impaired glucose tolerance (IGT) group: FPG 11.1 mmol/L and >2hPG >7.8 mmol/L; and normal glucose tolerance (NGT) group: FPG <7.0 mmol/L and 2hPG ≤7.8 mmol/L. Potential biomarker peptides were verified to show significant differences among groups, and the receiver operating characteristic (ROC) analysis showed excellent sensitivity and specificity as well.
FIG. 1.

Schematic workflow of the experiments.
Materials.
Sequencing-grade modified trypsin was purchased from Promega (Madison, WI), H218O (97%) was purchased from the China Isotope Company (Beijing, China), high-performance LC (HPLC)-grade acetonitrile and formic acid (FA) were purchased from Fisher Scientific (Fair Lawn, NJ, and Edmonton, AB, Canada), and inorganic salts for making buffers (NH4HCO3, KH2PO4, and K2HPO4) were purchased from Beijing Chemical Company (Beijing, China). All other chemicals (dithiothreitol [DTT], iodoacetamide, d-glucose, urea, and xylene) were purchased from Sigma-Aldrich (St. Louis, MO). Water was prepared by a Milli-Q system (Millipore, Billerica, MA). A reverse-phase VYDAC LC column (C18, 2.1 × 150 mm, 300 Å) was purchased from Grace (Deerfield, IL).
HPLC/electrospray ionization–time of flight MS.
An Agilent 1100 series HPLC system was coupled with an Agilent electrospray ionization–time of flight (ESI-TOF) MS (6210) with a VYDAC C18 column (300 Å, 2.1 × 150 mm) at a flow rate of 0.2 mL/min for quantitative analysis. The sample injection amount was 10 μg. The mobile phase consisted of buffer A (0.1% FA in H2O) and buffer B (0.1% FA in acetonitrile). The gradient elution for buffer B was as follows: 3% from 0 to 5 min, 40% from 5 to 35 min, 40–95% from 35 to 40 min, 95% from 40 to 43 min, and 95–3% from 43 to 45 min, with a final flow from 45 to 55 min. Nitrogen was used as the drying and nebulizing gas (flow rate, 10 L/min; pressure, 35 ψ; temperature, 350°C). The MS ionization mode was positive, and the capillary voltage was set at −3.5 kV. A mass window of 300–1,800 amu was used for the TOF MS instrument.
HPLC/ESI-ion trap MS.
The same Agilent 1100 series HPLC system was coupled with an Agilent MSD trap for qualitative analysis. The same chromatographic and ESI conditions were used. MS and MS/MS analyses were performed on favorable fragmentations to double- and triple-charged ions. Ion trap MS also had a mass window of 300–1,800 amu. The Mascot database (Matrix Science) was used to identify peptide sequences associated with each MS/MS spectrum, and the human protein database SwissProt was used for protein identification.
HSA glycation.
In vitro glycation of pure HSA was done with glucose according to a published procedure (37). Briefly, unmodified HSA (40 mg/mL in 50 mmol/L KH2PO4-K2HPO4 buffer [pH 7.4], containing 0.1 mmol/L toluene as a bacteriostat) was incubated with d-glucose at four different HSA-to-glucose molar ratios (1:10, 1:41.5, 1:83, and 1:415) at 37°C for 10, 20, or 30 days, and then lyophilized. These four concentrations were calculated by the HSA-to-glucose molar ratio to give a physiological glucose condition (∼12.05% site-occupancy), theoretical 50% site-occupancy, theoretical 100% site-occupancy, and fivefold glucose excess, respectively. An equal volume of HSA incubated under the same conditions without glucose was used as a control.
Protein digestion.
Two hundred micrograms of HSA (both glycated and control HSA) was denatured and reduced by a 20 μL solution containing 8 mol/L urea and 10 mmol/L DTT in 50 mmol/L NH4HCO3 buffer (pH 8.3) at 37°C for 4 h. Alkylation was performed in a 50 mmol/L iodoacetamide solution at room temperature for 1 h in the dark. After alkylation, the sample was diluted using a 50 mmol/L NH4HCO3 buffer to give a final urea concentration of 1 mol/L. Tryptic digestion was then performed at a protein-to-trypsin concentration ratio of 50:1 (w/w) for 20 h at 37°C. All digested peptide samples were lyophilized to complete dryness and then used for the labeling reaction.
Peptide 18O-labeling.
Peptide 18O-labeling was done under optimized conditions (38). Peptide samples were dissolved in 50 mmol/L KH2PO4-K2HPO4 buffer, pH ∼5. This step was followed by a second lyophilization to completely dry the sample. Finally, the control HSA peptides and the glycated HSA peptides were labeled in H218O and H216O, respectively, with 1.6 μg trypsin. After labeling at 37°C for 20 h, residual trypsin activity was quenched by boiling the sample for 10 min and adding 5% FA (v/v). All samples were centrifuged at 17,000g for 15 min before HPLC-MS analysis.
Clinical sample collection.
Clinical samples for the T2DM, IGT, and NGT groups were provided by the Beijing Institute of Technology Hospital, Beijing, China. During 2009–2010, upon request, 389 volunteers provided blood samples with questionnaires about their characteristics, including basic characteristics (age, sex, and BMI), family history of diabetes, and symptoms of early diabetes. Biochemical examinations of their blood samples were also performed and recorded. This clinical study was conducted in accordance with the requirements of medical ethics.
RESULTS
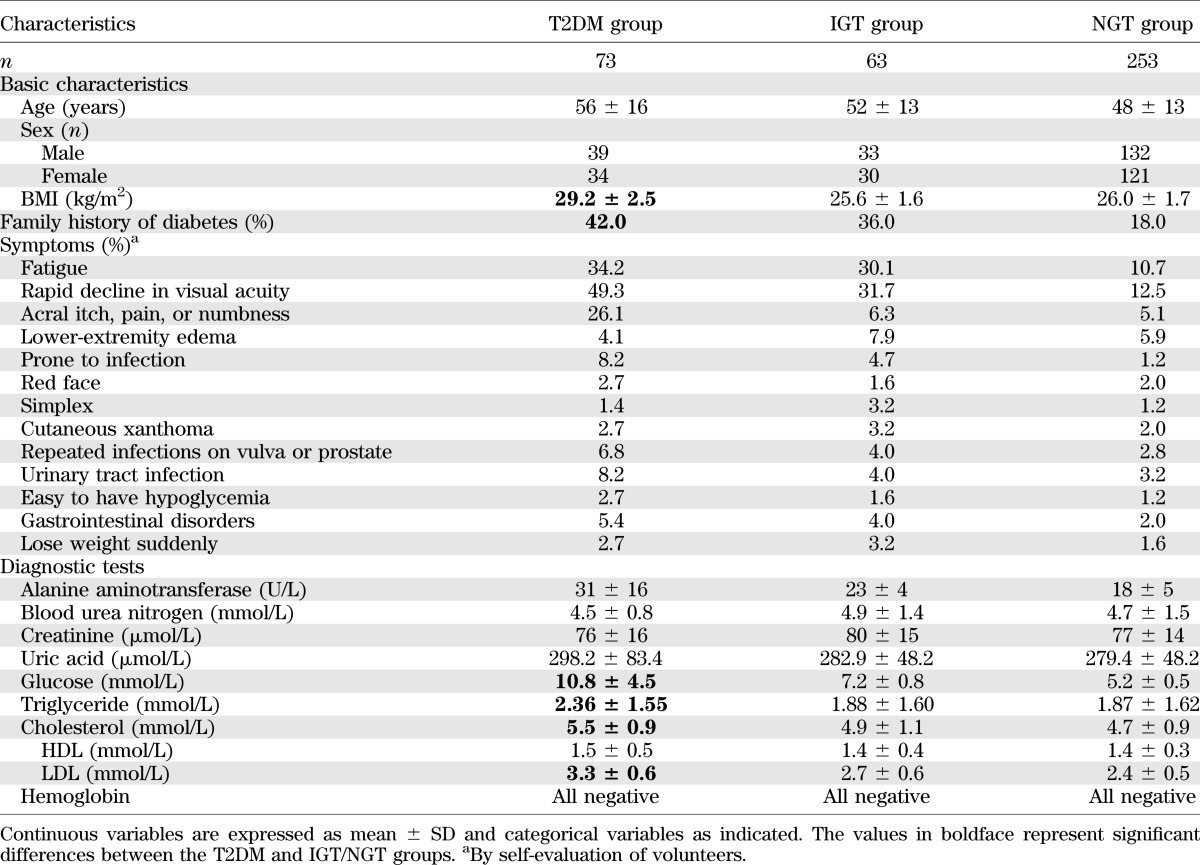
The participants who provided blood samples were classified into 3 groups: T2DM, IGT, and NGT, as described in the research design and methods. Table 1 lists the basic characteristics of the study participants. As expected, patients classified into the T2DM group had a higher BMI and a higher probability of having a family history of diabetes than patients classified into the NGT group. Furthermore, patients in the T2DM group were more inclined to feel that they had symptoms of diabetes and its complications than patients in the NGT group. Biochemical examinations showed that patients in the T2DM group had significantly higher glucose, cholesterol, alanine aminotransferase, triglyceride, and LDL levels than patients in the NGT group.
TABLE 1.
Basic characteristics of individuals who participated in this clinical study
In an environment with high glucose concentrations, glycation will occur on certain sites of HSA (i.e., lysines, arginines, and the N-terminal free amine), which are called glycation-sensitive sites. Peptides with glucose-sensitive sites were potential glucose-sensitive peptides, whereas peptides without glucose-sensitive sites were potential glucose-insensitive peptides. With increasing degrees of glycation, three types of peptides were expected after HSA was digested to peptides: 1) glucose-insensitive peptides, 2) glucose-modified glucose-sensitive peptides, and 3) unmodified glucose-sensitive peptides. In this study, type 1 and type 3 peptides were quantitatively analyzed and used for diagnosis of T2DM.
The 18O-labeling proteomics technique was first used in in vitro samples to search for type 1 and type 3 peptides. Within glucose-insensitive peptides (summarized in Supplementary Table 1), the peptide AAFTECCQAADKAACLLPK (m/z = 977.4 and retention time of 28.7 min) was chosen as the internal standard peptide. As shown in Fig. 2, the peak area ratio (16O-to-18O) of peptide AAFTECCQAADKAACLLPK was close to 1 (0.961 ± 0.077; Fig. 2A) in 72 MS runs of 36 samples, where 4 different glucose concentrations were used for incubations of 10, 20, or 30 days. After glycated HSA samples were digested with trypsin, 57 unmodified peptide sequences with usable sequence coverage of 83% in total were matched in the database search query by exporting their MS/MS data to Mascot (Supplementary Table 2). Similar results have been reported (36). As an example, Fig. 2B shows the concentration variation of one of these glucose-sensitive peptides, FKDLGEENFK (m/z = 614.8), with a retention time of 25.5 min.
FIG. 2.

The relative peak area ratios (16O-to-18O) with respect to incubation day and glucose concentration (Conc.) are shown for a glucose-insensitive peptide (AAFTECCQAADKAACLLPK) (A) and a glucose-sensitive peptide (FKDLGEENFK) (B). The error bars are SD values of triplicate.
Glycation is dependent on the concentration of glucose and has an accumulation effect. As a result, the concentration of a glucose-sensitive peptide in glycated HSA samples will be a function of the glucose concentration and the incubation duration. Supplementary Table 3 reports the relative intensity (peak area ratio 16O-to-18O of the LC-TOF MS data) variations of selected peptide ions (usually detected in each MS run) in glycated HSA samples. By calculating their statistical correlations with respect to glucose concentration and incubation duration, eight peptides were provisionally recognized as unmodified glucose-sensitive peptides (or type 3 peptides) for HSA (summarized in Table 2) because they exhibited a steady decrease in peak area ratio (significant difference) against increasing glucose concentration and incubation duration. The decreasing ratio among peak area ratios (16O-to-18O) of these glucose-sensitive peptides with different incubation durations is presented in Supplementary Table 4, and the peak area ratios of three peptides with respect to glucose concentration and incubation times is shown in Fig. 3. Detailed information describing statistical correlation values (P values) with respect to glucose concentrations is given in Supplementary Table 5.
TABLE 2.
Characteristics of the eight glucose-sensitive peptides identified through MS
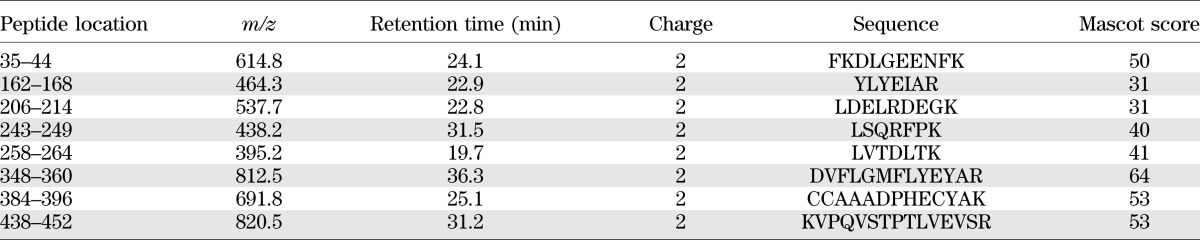
FIG. 3.

Peak area ratios (16O-to-18O) of the three potential peptide-biomarkers with respect to glucose concentration (Conc.) and incubation day.*P < 0.05. **P < 0.01. The error bars are SD values of triplicate.
Finally, when the standard-free and label-free method was applied to the clinical samples, the amount of three peptide ions (m/z = 537.7, 614.8, and 820.5) of the eight potential biomarkers showed significant differences among the T2DM, IGT, and NGT groups. Figure 4 shows the box plot of these three peptides for the T2DM, IGT, and NGT groups, and Supplementary Table 6 provides the corresponding P values. These three peptides (LDELRDEGK, FKDLGEENFK, and KVPQVSTPTLVEVSR) showed significant decreases in their concentrations in the T2DM group compared with the IGT group. Furthermore, there were significant differences (P < 0.01) between both NGT/IGT and IGT/T2DM groups for peptides FKDLGEENFK and KVPQVSTPTLVEVSR, indicating that these three peptides could be used as potential biomarkers for the early diagnosis of T2DM.
FIG. 4.

Clinical behavior of the three potential peptide biomarkers (LDELRDEGK, FKDLGEENFK, and KVPQVSTPTLVEVSR) among T2DM, IGT, and NGT groups, with the selected glucose-insensitive peptide (AAFTECCQAADKAACLLPK) used as the internal standard (IS). A box plot of these three peptides is shown. The horizontal line in the middle of each box indicates the median, the top and bottom borders of the box mark the 75th and 25th percentiles, respectively, and the whiskers mark the maximum and minimum values.
In addition, Supplementary Fig. 1 shows the ROC analysis for early diagnosis of T2DM. Peptides FKDLGEENFK and KVPQVSTPTLVEVSR showed excellent sensitivities and specificities between the NGT/IGT groups (Supplementary Fig. 1A) and the NGT/IGT and T2DM groups (Supplementary Fig. 1B). The parameters of the ROC analysis (sensitivity, specificity, area under the curve, and cutoff point) are given in Supplementary Table 7.
DISCUSSION
In this study, we developed a novel method (outlined in Fig. 1) for the detection of glycated peptides as a potential technique for the early diagnosis of T2DM. During the process of 18O-labeling, control HSA was prepared in the presence of an 18O-enriched PBS buffer, whereas glycated HSA was prepared in an 16O-enriched buffer. After incubation and digestion, the corresponding glycated HSA peptide sample was mixed with the control sample in a 1:1 ratio (v/v), and the mixtures were injected into HPLC/ESI-TOF MS for quantitative analysis. This allowed for the identification of an internal standard peptide and three promising glucose-sensitive peptides, which may have potential application in the early diagnosis of T2DM. Then, following the identification of an internal standard peptide and putative biomarker peptides, a standard-free and label-free method was developed and applied to clinical samples. Thus, instead of using the 18O-labeling technique for final quantification and validation of the data, we performed quantification of the putative biomarker peptides by calculating the peak area ratios of the putative biomarker peptide over the internal standard peptide (m/z = 977.4).
Peptide AAFTECCQAADKAACLLPK (m/z = 977.4 and retention time of 28.7 min) was chosen as the internal standard peptide because its concentration was independent of the concentration of glucose solution and the incubation duration. In addition, this peptide had a stable and strong enough signal (×105 in vitro and ×104 in vivo) in the TOF mass spectrum, which would ensure analysis accuracy. Internal standards in quantitative analysis usually have to be exogenously added. However, there are many limits to the selection of an internal standard; for example, the internal standard substance must be completely dissolved in the sample, no interactions must occur between the internal standard and the component to be measured, and the retention time of the two peaks should be close in the chromatogram. We solved this problem in our study by using the above-mentioned peptide, which was cleaved from HSA itself.
In addition, as shown in Supplementary Fig. 2, the glucose-insensitive peptide used as the internal standard (AAFTECCQAADKAACLLPK) was located at the center of the HSA protein. Thus, the location of this peptide within the HSA protein may contribute to its glucose-insensitivity, because it would be difficult for small molecules (such as glucose) to attack the modification site.
As reported in Supplementary Table 1, three glucose-insensitive peptides were obtained from the in vitro study. That the three peptides are insensitive to glucose in the clinical samples (the T2DM group, 73 cases) was also confirmed. Therefore, the peptide (AAFTECCQAADKAACLLPK) was used as an internal standard for the clinical study.
HSA has no unique peptide sequence, and today we know that there are hundreds of different proteins in the human plasma. HSA characteristic peptides are the peptides that are present in HSA but are not the highest abundance proteins in human plasma. However, HSA itself is the highest abundance protein in human plasma, and proteins that have similar amino acid sequences to HSA are all albumins. Importantly, studies have demonstrated that no other albumin protein is among the 137 highest abundance proteins in human plasma (22).
In conclusion, this report describes the development of a standard-free and label-free LC-MS/MS method for the discovery of putative biomarkers for T2DM. In vitro glycation of the most abundant protein, HSA, in human blood plasma was monitored through quantitative analysis of HSA characteristic peptides using 18O-labeling techniques. Verified by clinical samples, three peptides (FKDLGEENFK, LDELRDEGK, and KVPQVSTPTLVEVSR) exhibited significant differences between T2DM and NGT groups, and two of these peptides (FKDLGEENFK and KVPQVSTPTLVEVSR) also showed significant differences between both NGT/IGT and IGT/T2DM groups. Our results indicate that these peptides could be putative biomarkers for the early diagnosis of T2DM.
ACKNOWLEDGMENTS
This research was financially supported by the Ministry of Science and Technology of the People’s Republic of China (grant numbers 2012YQ040140 and 2012CB910603) and the National Natural Science Foundation of China (grant number 21205005).
No potential conflicts of interest relevant to this article were reported.
M.Z. collected data and prepared the manuscript. W.X. was involved in data integration and analysis and also in preparing the manuscript. Y.D. conceived the idea and designed the study. Y.D. is the guarantor of this work and, as such, had full access to all the data in the study and takes responsibility for the integrity of the data and the accuracy of the data analysis.
The authors thank David R. Raisor and Editage for providing the English language editing.
Footnotes
Clinical trial reg. no. NCT01902316, clinicaltrials.gov.
This article contains Supplementary Data online at http://diabetes.diabetesjournals.org/lookup/suppl/doi:10.2337/db13-0347/-/DC1.
REFERENCES
- 1.Gardner D, Shoback D. Greenspan’s Basic and Clinical Endocrinology 9th ed. New York, McGraw-Hill Professional, 2011 [Google Scholar]
- 2.Mason C. The production and effects of uncertainty with special reference to diabetes mellitus. Soc Sci Med 1985;21:1329–1334 [DOI] [PubMed] [Google Scholar]
- 3.Clement S, Braithwaite SS, Magee MF, et al. American Diabetes Association Diabetes in Hospitals Writing Committee Management of diabetes and hyperglycemia in hospitals. Diabetes Care 2004;27:553–591 [DOI] [PubMed] [Google Scholar]
- 4.Harris MI, Eastman RC. Early detection of undiagnosed diabetes mellitus: a US perspective. Diabetes Metab Res Rev 2000;16:230–236 [DOI] [PubMed] [Google Scholar]
- 5.American Diabetes Association Standards of medical care in diabetes—2007. Diabetes Care 2007;30(Suppl. 1):S4–S41 [DOI] [PubMed] [Google Scholar]
- 6.American Diabetes Association . Screening for type 2 diabetes. Diabetes Care 1998;21(Suppl. 1):S20–S22. [Google Scholar]
- 7.Klein S, Sheard NF, Pi-Sunyer X, et al. American Diabetes Association. North American Association for the Study of Obesity. American Society for Clinical Nutrition Weight management through lifestyle modification for the prevention and management of type 2 diabetes: rationale and strategies: a statement of the American Diabetes Association, the North American Association for the Study of Obesity, and the American Society for Clinical Nutrition. Diabetes Care 2004;27:2067–2073 [DOI] [PubMed] [Google Scholar]
- 8.Beard E, Clark M, Hurel S, Cooke D. Do people with diabetes understand their clinical marker of long-term glycemic control (HbA1c levels) and does this predict diabetes self-care behaviours and HbA1c? Patient Educ Couns 2010;80:227–232 [DOI] [PubMed] [Google Scholar]
- 9.Tay TL, Foo JP, Tan E, et al. HbA1c may not be a sensitive determinant of diabetic status in the elderly. Diabetes Res Clin Pract 2011;92:e31–e33 [DOI] [PubMed] [Google Scholar]
- 10.Gomez-Marcos MA, Recio-Rodríguez JI, Patino-Alonso MC, et al. Relationships between high-sensitive C-reactive protein and markers of arterial stiffness in hypertensive patients. Differences by sex. BMC Cardiovasc Disord 2012;12:37. [DOI] [PMC free article] [PubMed] [Google Scholar]
- 11.Tan PC, Aziz AZ, Ismail IS, Omar SZ. Gamma-glutamyltransferase, alanine transaminase and aspartate transaminase levels and the diagnosis of gestational diabetes mellitus. Clin Biochem 2012;45:1192–1196 [DOI] [PubMed] [Google Scholar]
- 12.Håglin L, Bäckman L, Törnkvist B. A structural equation model for assessment of links between changes in serum triglycerides, -urate, and -glucose and changes in serum calcium, -magnesium and -phosphate in type 2 diabetes and non-diabetes metabolism. Cardiovasc Diabetol 2011;10:116. [DOI] [PMC free article] [PubMed] [Google Scholar]
- 13.Espino A, Villagrán A, Vollrath V, et al. Plasminogen activator inhibitor type 1 serum levels and 4G/5G gene polymorphism in morbidly obese Hispanic patients with non-alcoholic fatty liver disease. Ann Hepatol 2011;10:493–501 [PubMed] [Google Scholar]
- 14.Yudkin JS, Stehouwer CD, Emeis JJ, Coppack SW. C-reactive protein in healthy subjects: associations with obesity, insulin resistance, and endothelial dysfunction: a potential role for cytokines originating from adipose tissue? Arterioscler Thromb Vasc Biol 1999;19:972–978 [DOI] [PubMed] [Google Scholar]
- 15.Rifai N, Tracy RP, Ridker PM. Clinical efficacy of an automated high-sensitivity C-reactive protein assay. Clin Chem 1999;45:2136–2141 [PubMed] [Google Scholar]
- 16.Mendall MA, Strachan DP, Butland BK, et al. C-reactive protein: relation to total mortality, cardiovascular mortality and cardiovascular risk factors in men. Eur Heart J 2000;21:1584–1590 [DOI] [PubMed] [Google Scholar]
- 17.Burgert TS, Taksali SE, Dziura J, et al. Alanine aminotransferase levels and fatty liver in childhood obesity: associations with insulin resistance, adiponectin, and visceral fat. J Clin Endocrinol Metab 2006;91:4287–4294 [DOI] [PubMed] [Google Scholar]
- 18.Fraser A, Ebrahim S, Smith GD, Lawlor DA. A comparison of associations of alanine aminotransferase and gamma-glutamyltransferase with fasting glucose, fasting insulin, and glycated hemoglobin in women with and without diabetes. Hepatology 2007;46:158–165 [DOI] [PubMed] [Google Scholar]
- 19.Arif B, Ashraf JM, Moinuddin, Ahmad J, Arif Z, Alam K. Structural and immunological characterization of Amadori-rich human serum albumin: role in diabetes mellitus. Arch Biochem Biophys 2012;522:17–25 [DOI] [PubMed] [Google Scholar]
- 20.Jones AG, Besser RE, McDonald TJ, et al. Urine C-peptide creatinine ratio is an alternative to stimulated serum C-peptide measurement in late-onset, insulin-treated diabetes. Diabet Med 2011;28:1034–1038 [DOI] [PubMed] [Google Scholar]
- 21.Doerr A. Absolute proteomics. Nat Methods 2007;4:195 [Google Scholar]
- 22.Cheng D, Hoogenraad CC, Rush J, et al. Relative and absolute quantification of postsynaptic density proteome isolated from rat forebrain and cerebellum. Mol Cell Proteomics 2006;5:1158–1170 [DOI] [PubMed] [Google Scholar]
- 23.Williams DK, Jr, Kovach AL, Muddiman DC, Hanck KW. Utilizing artificial neural networks in MATLAB to achieve parts-per-billion mass measurement accuracy with a fourier transform ion cyclotron resonance mass spectrometer. J Am Soc Mass Spectrom 2009;20:1303–1310 [DOI] [PMC free article] [PubMed] [Google Scholar]
- 24.Kiernan UA, Addobbati R, Nedelkov D, Nelson RW. Quantitative multiplexed C-reactive protein mass spectrometric immunoassay. J Proteome Res 2006;5:1682–1687 [DOI] [PubMed] [Google Scholar]
- 25.Zhang X, Huang B, Zhou X, Chen C. Quantitative proteomic analysis of S-nitrosated proteins in diabetic mouse liver with ICAT switch method. Protein Cell 2010;1:675–687 [DOI] [PMC free article] [PubMed] [Google Scholar]
- 26.Priego-Capote F, Ramirez-Boo M, Hoogland C, et al. Human hemolysate glycated proteome. Anal Chem 2011;83:5673–5680 [DOI] [PubMed] [Google Scholar]
- 27.Metz TO, Qian WJ, Jacobs JM, et al. Application of proteomics in the discovery of candidate protein biomarkers in a diabetes autoantibody standardization program sample subset. J Proteome Res 2008;7:698–707 [DOI] [PMC free article] [PubMed] [Google Scholar]
- 28.Zhang Q, Ames JM, Smith RD, Baynes JW, Metz TO. A perspective on the Maillard reaction and the analysis of protein glycation by mass spectrometry: probing the pathogenesis of chronic disease. J Proteome Res 2009;8:754–769 [DOI] [PMC free article] [PubMed] [Google Scholar]
- 29.Zhang Q, Tang N, Schepmoes AA, Phillips LS, Smith RD, Metz TO. Proteomic profiling of nonenzymatically glycated proteins in human plasma and erythrocyte membranes. J Proteome Res 2008;7:2025–2032 [DOI] [PMC free article] [PubMed] [Google Scholar]
- 30.Zhang Q, Tang N, Brock JW, et al. Enrichment and analysis of nonenzymatically glycated peptides: boronate affinity chromatography coupled with electron-transfer dissociation mass spectrometry. J Proteome Res 2007;6:2323–2330 [DOI] [PMC free article] [PubMed] [Google Scholar]
- 31.Zhang Q, Monroe ME, Schepmoes AA, et al. Comprehensive identification of glycated peptides and their glycation motifs in plasma and erythrocytes of control and diabetic subjects. J Proteome Res 2011;10:3076–3088 [DOI] [PMC free article] [PubMed] [Google Scholar]
- 32.Ahmad W, Li L, Deng Y. Identification of AGE-precursors and AGE formation in glycation-induced BSA peptides. BMB Rep 2008;41:516–522 [DOI] [PubMed] [Google Scholar]
- 33.Lapolla A, Fedele D, Seraglia R, Traldi P. The role of mass spectrometry in the study of non-enzymatic protein glycation in diabetes: an update. Mass Spectrom Rev 2006;25:775–797 [DOI] [PubMed] [Google Scholar]
- 34.Priego-Capote F, Scherl A, Müller M, Waridel P, Lisacek F, Sanchez JC. Glycation isotopic labeling with 13C-reducing sugars for quantitative analysis of glycated proteins in human plasma. Mol Cell Proteomics 2010;9:579–592 [DOI] [PMC free article] [PubMed] [Google Scholar]
- 35.Seo J, Lee KJ. Post-translational modifications and their biological functions: proteomic analysis and systematic approaches. J Biochem Mol Biol 2004;37:35–44 [DOI] [PubMed] [Google Scholar]
- 36.Barnaby OS, Cerny RL, Clarke W, Hage DS. Quantitative analysis of glycation patterns in human serum albumin using 16O/18O-labeling and MALDI-TOF MS. Clin Chim Acta 2011;412:1606–1615 [DOI] [PMC free article] [PubMed] [Google Scholar]
- 37.Sattarahmady N, Moosavi-Movahedi AA, Ahmad F, et al. Formation of the molten globule-like state during prolonged glycation of human serum. Biochim Biophys Acta 2007;1770:933–942 [DOI] [PubMed]
- 38.Wang H, Hu G, Zhang Y, et al. Optimization and quality assessment of the post-digestion 18O labeling based on urea for protein denaturation by HPLC/ESI-TOF mass spectrometry. J Chromatogr B Analyt Technol Biomed Life Sci 2010;878:1946–1952 [DOI] [PubMed] [Google Scholar]