

Abstract
Most biological processes involve multiple proteins interacting with each other. It has been recently discovered that certain residues in these protein-protein interactions, which are called hot spots, contribute more significantly to binding affinity than others. Hot spot residues have unique and diverse energetic properties that make them challenging yet important targets in the modulation of protein-protein complexes. Design of therapeutic agents that interact with hot spot residues has proven to be a valid methodology in disrupting unwanted protein-protein interactions. Using biological methods to determine which residues are hot spots can be costly and time consuming. Recent advances in computational approaches to predict hot spots have incorporated a myriad of features, and have shown increasing predictive successes. Here we review the state of knowledge around protein-protein interactions, hot spots, and give an overview of multiple in silico prediction techniques of hot spot residues.
Keywords: Protein-Protein Interactions, Hot Spot Residues, Structure-based Drug Discovery, In Silico Prediction, Alanine Scanning, TRAF6
Protein-Protein Interactions
Most cellular proteins do not act as isolated units; they often form complexes with other proteins [1]. Formation of these protein complexes require specific interactions that become the foundation for almost all biological processes, especially signal transduction. The complexity of these protein-protein interactions (PPIs) is what primarily provides them with their diversity in functions. From this complexity, distinctions can be made in the shape, size and surface complementarity of protein-protein interactions [2–6]. These interactions can be described as locally optimized, with the clustered, networked, densely packed residues contributing mainly and cooperatively to the stability of the complex [7]. The sites by which proteins interact with their partners are formed by surfaces with adequate electrostatic complementarity and shape [8–11]. Other major factors that influence protein-protein interactions are hydrophobicity [3, 12] and electrostatic interactions [10], and flexibility [8–10]. While interfaces with an area as small as 1150–1200 Å2 have been described in low-stability and short-lived complexes, “standard-size” interfaces [13] are roughly 1600 Å2 (+/− 400 Å2) and involve only small changes in conformation [6]. The “large” interfaces bury 2000 to 4660 Å2 and occur mostly between G-protein and other components of signal transducers, and between proteases and one class of their inhibitors [11, 13]. Understanding the connection between structure and function of molecular systems can be achieved through examination of the protein-protein associations, and enables the characterization of their energetic properties [14, 15]. When one considers that there are over 45,000 protein-protein pairs in yeasts, it is should become apparent that the number of potential, druggable targets in humans is enormous [16].
Cellular dysfunctions from faulty protein-protein interactions are the underlying cause of a variety of diseases, including cancer and neurological disorders [17, 18]. Despite the critical importance and relative abundance of protein-protein interactions, very few small-molecule PPI inhibitors have made the difficult transition from hits to marketed drugs. While peptide-based inhibitors derived from 5–50 amino acids of a single member of an interacting protein pair are easy to construct, conversion to of these peptides to “drug-like” molecules has proved to be the biggest hurdle [19, 20]. One significant part of this problem is the nature of the PPIs; classic protein inhibitors primarily target well -defined grooves and pockets [21, 22], whereas PPIs are usually large and relatively planar surfaces that were originally considered not conducive to druggability by “drug-like” molecules [10, 23]. Advancements in two areas: the understanding of the physical nature of PPIs as well as the increasing diversity and quality of small, lead-like compounds have allowed PPIs into the realm of valid targets, thereby greatly expanding the available target space for a plethora of diseases [24, 25].
Protein Hot Spot Residues
It has been well established that for all proteins, the energy distribution is not uniform across a given protein -protein interaction; that a small subset of residues will have a more significant contribution to the binding free energy than other residues [7, 27–34]. Clackson and Wells’ pioneering study of the binding of human growth hormone to its receptor discovered these important residues and coined the term ‘hot spots’ [27]. Later work revealed that hot spots occupy only a fraction of the larger interface area [28], and proclaimed a more precise definition of a hot spot as a residue whose mutation to alanine results in a decrease of at least 2.0 kcal/mol in binding free energy (ΔΔGbinding) [35]. Binding free energy, or ΔΔG, is defined as ΔGmut – ΔGwt, where ΔGwt and ΔGmut are the binding free energies upon complex formation of the wild-type and alanine-mutated proteins, respectively. It has been calculated that 9.5% of interfacial residues are hot spots [36].
The composition of hot spots is distinctive and not random, with tryptophan (21%), arginine (13.3%), and tyrosine (12.3%) being the only three fundamental amino acids having more than 10% frequency [28, 37]. The complex formed by human growth hormone and its receptor is shown with its dominating tryptophan residues (Figure 1). Out of the 29 interfacial residues in this complex, only four hot spots have ΔΔGbinding higher than 4.5 kcal/mol, and two of them are tryptophan. Tryptophan’s unique function can be partially explained by its large and aromatic p-interactive nature [38] as well as its large hydrophobic surface and protective effects from water [39]. When the bulky tryptophan residue is mutated to alanine, the difference in size generates a large cavity that creates a highly complex destabilization [28].
Figure 1.

Human growth hormone and its receptor (PDB Code 1a22). Three of the four hot spot residues are represented in sticks, hydrogen bonds are shown in dashes. This result was displayed using PyMol [26].
Consideration of the structural aspects of hot spots [40, 41] reveals that they are cooperative and structurally conserved [7, 30, 42, 43]. This structural conservation is also apparent when examining the rate of mutation of surface residues; protein interfaces [44] and functional sites [45] mutate at a relatively slower rate when compared to other surface residues. Mutations of the interactions between proteins may occur largely by coevolution, where substitutions in one protein trigger reciprocal changes in the other protein [44]. Numerous studies of protein-protein interfaces have revealed the presence of hot spots where binding affinity and specificity can be resolved by an epitope that is consisting of only a small portion of interfacial residues [28, 29, 46–48]. Clearly, the structural conservation of hot spots and their correlating binding affinity make them attractive drug targets for small molecule inhibition. It is not surprising then, that hot spots have been considered in the design of small molecule inhibitors of unwanted protein-protein interactions, and several potential drugs show great promise in targeting hot spots [18, 36, 49–57].
Hot spots can facilitate drug design in two ways. First, the binding site can be predicted by the presence of hot spots, and this binding site can be considered a starting point to perform docking and/or screening of ligands [58]. Second, rigid docking could exploit the relatively less flexible hot spots, and improvements in protein docking would be achieved by choosing dominant conformation of the hot spot side chains resulting from molecular dynamics (MD) simulations rather than the unbound X-ray conformation [59, 60]. Initial studies have shown that hot spots have physico-chemical properties that may be predictive [36, 46], and this prediction goes a long way to decipher the functional mechanism of proteins. From the mechanisms, valuable information can be used for a wide range of purposes: mutant proteins can be designed that will validate the interactions, drugs can be developed that target the protein-protein interactions, and molecular recognition can be expanded to help us understand complex signaling pathways.
Experimental Prediction of Hot Spot Residues
Experimental identification of hot spot residues is primarily performed by alanine scanning. This process involves mutation of a residue of interest to alanine, and recording the resulting binding energy changes. If this mutation results in a marked drop in the binding constant (typically tenfold or higher), the residue is considered a hot spot [46]. Substitution with alanine removes all atoms in the side chain past the β-carbon. Alanine is used because of its relatively inert methyl functional group without contributing additional flexibility [61–63]. Mutation to glycine would also remove the side chain, but is not used since it can introduce unwanted conformational flexibility in the protein backbone [64].
In the context of protein folding, a mutation on a hot spot residue can be considered to destabilize the bound ensemble state relative to the unbound one [65, 66]. It follows then that alanine scanning determines the specific contribution of residues to the ensemble’s stability, and resulting protein function. If we are to consider the plasticity of protein interfaces, alanine scanning mutations affect free energy surfaces that can lead to differential effects of the bound, unbound state, or both (Figure 2). It becomes advisable then to interpret both the structure and energetic properties of each ensemble to rather than a specific residue interactions [46]. Initially, alanine scanning was applied towards human growth hormone and the growth hormone binding protein [27], and this technique has proved invaluable in PPI analysis and hot spot detection [6, 28, 33, 46, 55]. The resulting data from alanine scanning can be deposited in the Alanine Scanning Energetics Database (ASEdb), and verified experimental hot spots from the literature are found in the Binding Interface Database (BID) [35, 67]. These repositories, while useful, have two drawbacks. First, hot spot information from experimental studies is limited to very few complexes. Secondly, it is not recommended to interpret this data to specific residue interactions [46].
Figure 2.
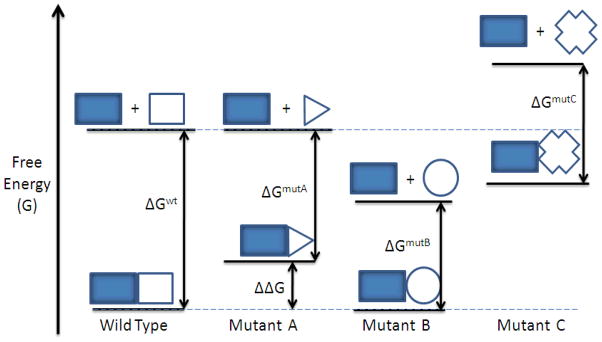
Mutations from alanine scanning can affect free energies of bound and unbound states. Mutant A is an ideal result where only the complex is destabilized, and the binding free energy with respect to the wildtype (ΔΔG) can be attributed to specific changes in the PPI contacts. Mutant C affects both states simultaneously. The measured binding free energy difference from B and C mutants must be interpreted cautiously. (Figure adapted from [46]).
Experimental mutagenesis of target proteins for elucidation of hot spots is not applicable on a large scale since individual mutants must be purified and analyzed separately [46]. Systematic analysis requires each alanine-mutated protein to be constructed, placed in an expression system sometimes refolded, then the resulting protein activity is assessed in an in vitro assay [64]. While techniques such as reflectometric interference spectroscopy [68] and “shotgun scanning” [69] have alleviated some of the labor involved, experimental hot spot analysis is still very time consuming and expensive. The theoretical and computational prediction of hot spots has become one of the most attractive and challenging topics in biochemistry, biophysics, and bioinformatics, and each of these disciplines offer unique strategies to confront this challenge. Next, we will outline the methods and tools available for computational hot spot prediction (Table 1).
Table 1.
Summary of hot spot prediction methods.
| Hotspot prediction | Properties Used | Availability | Technique | Reference |
|---|---|---|---|---|
| FoldX | Energy-based | Tool & Server | Computational alanine scanning | [70] |
| Robetta | Energy-based | Server | Computational alanine scanning | [71] |
| PP_Site | Energy, structure-based | Tool | Simple algorithm | [72] |
| FTMAP | Energy –based | Tool & Server | Probe based rigid body docking with fast Fourier transform correlation | [73] |
| PCRPi, PCRPi-W | Energy, structure, evolutionary | Tool & Server | Bayesian Network | [74,75] |
| Guhary & Chakrabarti | H-bonding, interface location | Tool | Simple algorithm | [76] |
| KFC2 | ASA, various structural features | Server | Support Vector Machine (SVM) | [77] |
| MINERVA | Structure, sequence, molecular interaction | Tool | Descision Tree, SVM | [78] |
| HSPred | Energy-based | Tool | SVM (Residue specific) | [79, 80] |
| Rajamani | Side chain ΔASA | Tool | Molecular Dynamics | [59] |
| Higa & Tozzi | Structural, evolutionary | Tool | SVM | [81] |
| Grosdidier & Recio | Energy-based (Docking) | Tool | Normalized interface propensity | [82] |
| HotPoint HotSprint | Conservation, accessibility, residue propensity | Server & Database | Empirical formula | [83, 84] |
Energy-based Computational Methods
Computational alanine scanning estimates the energetic contribution of each residue to the total binding energy via virtual alanine scanning. The process for computational alanine scanning is briefly described as follows: Using a side chain repacking algorithm, mutation of each interface residue to alanine is performed. Then, a numeric energy function is used to evaluate the bound and unbound states of the original and mutant proteins. Finally, the change in the binding energy (ΔΔG) of each mutation is calculated thermodynamically. This approach requires the complex structure as input and is best for providing an accurate estimation of free energy charges [85].
One such algorithm is FOLDEF, available as the FoldX web server. It was developed by Guerois et al., and was used to predict the energetic effect of mutations on protein complexes. FOLDEF was built on the FoldX complex energy function, which systematically truncates side chains between two proteins (or protein-peptide) to alanine, then calculates change in the binding energy after relaxation [70]. The complex energy function contains terms for: implicit and explicit desolvation, van der Walls forces, hydrogen bonding, Coulombic electrostatics, changes in entropy, and dipole interactions. FOLDEF was trained on a database of 339 mutants and gave a global correlation of 0.83 and a standard deviation of 0.81 kcal/mol when tested on a database of 1030 mutants. FoldX predictions have a linear correlation with experimental binding energies, and the standard deviation of predictions from a linear regression of the data is 0.88 kcal/mol [86].
Similarly, Kortemme and Baker used a simple physical model (named Robetta) that includes various parameters including: Lennard Jones interactions, solvation interactions, packing interactions, implicit solvation and hydrogen bonding to calculate free energy [71]. Similar to FoldX, the Robetta energy function was parameterized from protein stability data. Robetta mutates side chains to alanine and locally repacks the structure within 5Å of the mutant residue, while keeping the rest of the protein unchanged. The predicted changes in binding energies form the basis for hot spot predictions [87]. When tested on a database of 743 mutations in the interface of each protein (from the ASEdb), Robetta was able to correctly predict 79% of hot spot residues with a 1.0 kcal/mol cutoff, and an average error of 1.06 kcal/mol [87, 88]. The implicit solvation model has two potential errors: Robetta cannot identify hot spots that are involved in water-mediated hydrogen bonds, and when waters can compensate for a mutation, it will incorrectly predict mutations as hot spots.
Gao et al. developed a structure-based method, called PP_SITE, based only on three properties: H-Bond, hydrophobic and van der Walls interactions. PP_SITE is developed based on POCKET, which is a module of the multi-purpose program LigBuilder [89]. PP_SITE creates a box with regularly spaced grids to cover interfacial residues and uses probes for each structural property to screen those grids. The probes include a positively charged sp3 nitrogen (ammonium cation), a negatively charged sp2 oxygen (as in a carboxyl group), and a neutral sp3 carbon atom (methane). For each grid, the scores are calculated and a grid label is assigned to it. This method then offers the ability to analyze the decomposition of the contributions of regions in the predicted hot spots, enabling comprehensive exploration of the properties of the protein-protein interface. PP_SITE was tested on 13 complexes with 250 alanine mutations on interfacial residues. For the 75 hot spot residues in this set, 66 were predicted correctly, giving an 88% success rate (ΔΔG > 1.5 kcal/mol) [72].
FTMAP [73] is a recent approach that uses docking results of small organic probes to discover hot spots. It was originally conceived as a computational equivalent of the experimental multiple solvent crystal structures (MSCS) technique, where a target protein is co-crystallized in the presence of a diverse set of organic solvent probe molecules. It has been shown that molecular probe distribution on the protein surface allows for discovery and characterization of potential ligand interaction sites [90]. The FTMAP algorithm samples billions of positions from 16 small molecule probes (with varying hydrophobicity and hydrogen-bonding capacity) globally across the total protein surface using a fast Fourier transform correlation approach. The poses are evaluated with an empirical scoring function that includes van der Waals terms, electrostatic interaction energy, a cavity term to represent the effect of nonpolar enclosures, and a structure-based pair-wise interaction potential. The 2000 most favorable docked conformations are energetically minimized and clustered. The lowest energy clusters from different and overlapping probe types are clustered again into consensus sites; the largest consensus site is generally located at the most important sub-site of the protein binding site. FTMAP is available as a publically-available server, where only the PDB file or a PDB code of the protein is required. The output shows the six lowest energy cluster representatives as well as the number of non-bonded and hydrogen bonds between the probes and each residue in the protein (Figure 3).
Figure 3.

FTMAP results for carbonic anhydrase I (PDB 2CAB) displayed in PyMol. The pocket nearest to the center contains 19 docked probes, and is the binding site for drugs acetazolamide, methazolamide, and foscarnet.
Another recent method called PCRPi (Presaging Critical Residues in Protein interfaces) is based on the integration of three main sources: energetic, structural, and evolutionary determinants by using Bayesian networks to unify them into a common probabilistic framework [74]. Specifically, the attributes are: interaction engagement index, topographical index, four separate conservation indexes (ANCCON, ANC3DCON, CON, and 3DCON), and the BE index. The BE index is an in silico alanine scan using FoldX [70]. This method has been developed as a web server (called PCRPi-W) where users can enter a PDB code or upload a complex, as well as select the type of Bayesian network architecture (naïve or expert) [75]. Two different types of training sets are available for users: Ab+, which contains entire dataset of 636 interface residues, including antigen-antibody complexes, and Ab−, which does not include these antigen-antibody complexes. Using a BID dataset derived in Tuncbag et al. [91], the PCRPi-W method recorded a precision of 0.79 and recall of 0.64 when compared in a head-to-head comparison with other computational methods [75]. Also of note, the PCRPi-DB is the result of annotating and archiving the entire Protein DataBank [92] using PCRPi [93].
Finally, Guharoy and Chakrabarti used only the two criteria: hydrogen bonding across the interface, and location in the interface core to predict more than 80% of hot spots with experimental contribution of core residues to the energy of binding (ΔΔG > 2 kcal/mol) [76]. An experimental database of 462 mutants from 28 interfaces was used, out of which 143 form hydrogen bonds. The average unsigned error (calculated as | ΔΔGcalc − ΔΔGexp|) for all mutations was 1.04 kcal/mol. This technique is computationally inexpensive due to its small number of parameters, and is hence potentially applicable across a large set of complexes. One limitation of this technique is that coupling and indirect effects cannot be considered explicitly.
Molecular Dynamics-based Methods
These types of methods are also energy-based, but use more intensive molecular dynamics computations to provide an atomic level of hot spot prediction. Therefore we grouped them separately. One particular study using MD techniques looked at anchor residues, which are residues that have limited mobility and strongly correlate with conserved hot spot residues [94]. The study of anchor residues was conducted by Rajamani et al. on 11 different proteins and concluded that these residues have side chains that experience the largest decrease in solvent-accessible surface area (>100 Å2) when in a complex [59]. From their analysis of 39 complexes, they concluded that anchor residues have high structural conservation across different homologs. They also found that the anchor residue (primarily from the smaller of the two proteins) binds to a structurally constrained binding groove of the other protein that stabilizes the bound intermediate state, and the larger the buried surface area of the main anchor residue, the fewer secondary anchors are required for complex formation [59]. This work was based on another group’s nanosecond explicit solvent MD simulations of three complexes and the observation that key side chains frequently display the rotamer conformations of the complex before any receptor-ligand interaction [95].
Huo et al. applied a MM-PBSA (molecular mechanics-Poisson-Boltzmann surface area) approach to the human growth hormone-receptor complex (hGHpb). Here, protein-protein interfaces are probed with explicit molecular mechanical energies, continuum implicit solvation free energies, and approximations of vibrational entropy changes. All of these terms are then averaged over each conformation provided by the MD simulation. Using free energy calculations of snapshots equally spaced along a single dynamical trajectory, they were able to predict the experimental ΔΔG of binding with an average error of ±1kcal/mol for the alanine mutations of hydrophobic and polar/charged residues without buried salt bridges [96]. The full structural and energetic consequences of a mutation of a bound and unbound state can be adequately described when the proper thermodynamic cycle is employed [96]. This comprehensive analysis requires repeated sampling of the mutant in both bound and unbound forms, which is computationally expensive when compared to other methods, especially on a large scale. To circumvent this potential computational roadblock, approximations to generate the mutant ensembles can be used which simulate first the un-mutated protein, then are post-processed to introduce mutations to alanine [58, 97].
Machine Learning-based Methods
The third method uses learning based methods (commonly called machine learning, or ML). This method is very novel, considers a diverse series of factors, and will be used in future drug discovery efforts. The KFC (Knowledge-based FADE and Contacts) uses a rule-based model created by a machine learning algorithm to elucidate structural patterns that are indicative of hot spots. The KFC model is actually a combination of two learned decision tree models: K-FADE uses the residue size and radial distribution of shape specificity and interface points calculated by Fast Atomic Density Evaluation (FADE) [98], and K-CON uses the residue’s intermolecular atomic contacts, hydrogen bonds, interface points, and chemical types [99]. These structural features return a binary answer as to whether a residue is a hot spot or not, and a confidence score with each prediction. Alone KFC predicted 58% of alanine scanning hot spots with precision of 49% and recall of 58% when a hot spot is associated with ΔΔG > 2kcal/mol. When KFC was combined with Robetta’s computational alanine scanning technique described previously, (the combined model called KFC+Robetta-Ala, or KFCA) [87], the predictive accuracy jumps to 72%. The KFCA analysis was applied to two complexes: the calmodulin (CaM)/smooth muscle myosin light chain kinase (smMLCK) and to the bone morphogenetic protein-2 (BMP-2)/BMP receptor-type I (BMPR-IA) complex. Both complexes had strong correlation between KFC hot spot predictions and experimental mutations, and in the case of BMP2, KFC was able to highlight a region where alanine mutation of two key residues (Phe49 and Pro50) are more disruptive than the sum of the individual mutations [100]. A more recent study also used the KFC method in the study of the interaction of the antibody, called 19D9D6, and the hepatitis C virus (HCV). Comparison of MD simulation results matched three residues that were predicted as hot spots in KFC that are important for the interaction between the virus and antibody [101]. The KFC method is now available via an interactive, public web server, where users can submit complexes (via uploaded file, or providing the PDB code) and view results for each job, as well as upload scores from Robetta’s alanine scanning, ConSurf sequence conservation, or experimental data [99] (Figure 4).
Figure 4.

KFC2 output viewer. Using Jmol, users can visualize residues, display select residues, and save view settings. Here, hot spots for erythropoietin receptor and its mimetic peptide (PDB 1ebp) were all correctly predicted by KFC2 but not by KFC.
The KFC method has been recently improved, with two new models trained using a support vector machine (SVM) [102]: KFC2a and KFC2b. KFC2a is composed of eight features primarily related to solvent accessibility, interface position, packing density, and local plasticity. This KFC2a model showed a true positive rate of 0.85, outperforming HotPoint, KFC, Robetta, and FOLDEF, despite having a slightly higher false positive rate than the other models. KFC2b uses seven features (two of which are found in KFC2a), and boasts a higher specificity [77].
Cho et al. applied a SVM that initially incorporates 54 multifaceted features from structure, sequence, and molecular interaction. The model is named MINERVA, an acronym of MINE, Residue VAlue. From these 54 features, decision tree selection is performed to identify the best feature subset. Atomic packing density, relative surface area burial and weighted hydrophobicity are the top three features for picking hot spots that were selected from the decision tree, with the weighted atomic packing density displaying the highest effectiveness [78]. Previous hot spot and conservation analysis has shown that local packing density around conserved residues and hot spots is higher than anticipated, and a good correlation exists between local packing density and experimental ΔΔG [103]. MINERVA displays better sensitivity, specificity, precision and F1 score than Robetta, FOLDEF, and KFC when tested on two different training sets; the best performance occurred when the model was trained on the 2 kcal/mol set rather than the 1 kcal/mol set [78]. Their work also revealed that residue conservation is not ideal for correctly identifying hot spots, and that hot spots are closely related to π- π interactions.
Another group that has successfully used SVM is Lise et al., who previously described a hybrid method in which energy terms are used as input features of a SVM classifier and is called HSPred [79]. Their method considers basic energy terms (van der Waals, H-bond, electrostatic and desolvation potentials, hydrogen bonds, and Coulomb electrostatics) calculated from the complex structure. In a later study, this model was improved by 10% in overall precision and recall by creating separate SVM classifier predictions specifically optimized for arginine or glutamic acid residues, as these amino acid types did not perform well in the original model [80]. The method is also available as a web server and is free to non-commercial users [80].
A set of 43 structural and evolutionary parameters were used with an SVM classifier in the work by Higa and Tozzi. These parameters can be grouped into the following types: amino acid type, evolutionary profile, conservation score, surface area, solvation energy, and geometry [81]. When using the dataset compiled by Darnell et al.[100], this method had a performance of 60.4% (measured by F-Measure) that corresponded to a recall of 78.1% and a precision of 49.5% [81]. This work is significant in that it does not require the complex; it can be used with only knowledge of the monomer. As a result, this method can be used when the interface region is unknown, and can prove useful for discovery of novel protein interfaces.
Another method that does not require prior knowledge of the complex structure is the work from Grosdidier and Recio, whereby the analysis of rigid-body docking ensembles provides normalized interface propensity (NIP) values. This NIP parameter is obtained from rigid-body docking simulations and calculates the propensity of a given residue to be located at the interface. It includes electrostatics and desolvation scoring in its calculations for predictions [82]. The NIP method was developed from their previous findings that highly populated low-energy regions consistently corresponded to proven binding sites [104]. Their method has up to a 80% positive predictive value, but it is not exhaustive and will miss hot spots that are not directly involved in the interface or arise from highly specific interactions [82].
While machine learning methods hold great promise, it is worth mentioning that simple empirical models can provide better predictive power. Tuncbag et al. presented a empirical model based on conservation, accessible surface area (ASA), and knowledge-based pairwise residue potentials of the interface residues This model provides 70% accuracy, higher than machine learning based methods when using 150 residues from ASEdb as the training set [91]. Later, this method was incorporated into a web server, called HotPoint, where users can upload a protein complex and quickly visualize results [83] (Figure 5). The relative residue solvent accessibilities are calculated in the complex and monomer states, and the solvent mediated potentials are taken from Keskin et al [105]. If the following two qualifications for a residue are met: the relative ASA in complex is less than or equal to 20%, and the total pair potential is greater or equal to 18.0, then that residue is labeled a hot spot [83]. Change of solvent accessible surface area (ΔASA) upon the formation of a complex is strongly related to the solvation energy, which has been shown previously to be one of the most significant factors involved in protein-protein binding [106]. This technique was also used to correctly identify the hot spots on Mdm2. Another database named HotSprint was developed by the same group. It was the first database to exploit sequence conservation and incorporates solvent accessibility of residues. This method gives an accuracy of 76% that performs better than several machine-learning based methods [84].
Figure 5.

Output of HotPoint prediction of erythropoietin receptor and erythropoietin mimetic peptide (PBD 1EBP). Interface residues of this complex are presented in table with hot spot predictions: 1.) Coordinates of interface residues can be downloaded; 2.) Results are downloadable; 3.) Interface residues can be visualized by Jmol.
Case study of hot spot prediction methods: TRAF6/RANK complex
In order to validate the various web-based hot spot prediction methods, we used a target with available known hot spots on a novel target, the TRAF6/RANK interaction site. Tumor necrosis factor (TNF) receptor associated factor 6 (TRAF6) is a vital signaling molecule involved in adaptive immunity, innate immunity, and bone homeostasis. TRAF6 is unique in its signaling in the TNFR, IL-1 and TLR superfamily [107–109]. The formation of the complex consisting of receptor activator of nuclear factor-kappa B (RANK) with its ligand (RANKL) results in the recruitment of TRAF6, which activates NF-κB, JNK and MAP kinase pathways [110–112]. The interaction between TRAF6 and the Pro-X-Glu-X-X-(Ar/Ac) (aromatic/acidic residue) consensus sequence motif is responsible for signal transduction, and there are three residues that completely abolished binding when mutated to alanine: Arg392, Phe471 and Tyr473 [113]. To see which of the web-based programs can successfully predict the known hot spots, we submitted the TRAF6/RANK complex (PDB 1LB5) to Robetta, KFC2, and HotPoint and will briefly discuss the results.
Robetta provided a very accurate prediction of the TRAF6 hot spot residues, with only the three experimental hot spot residues having a predicted ΔΔG greater than 1 kcal/mol (Table 2). Positive values for the ΔΔG of the complex indicate that replacement by alanine is predicted to destabilize the complex; negative values predict a stabilizing effect. Robetta’s prediction indicates that while there are a good number of residues that destabilize the complex, none are as significant as the three that were correctly identified as hot spots. The only other residue that comes close to the 1.0 kcal/mol energy is Phe410, with a ΔΔG of 0.76 kcal/mol.
Table 2.
TRAF6 results from Robetta.
| Num | Residue | int_id | ΔΔG(complex) | ΔG(partner) |
|---|---|---|---|---|
| 374 | Val | 1 | 0.36 | 1.04 |
| 376 | His | 1 | 0.44 | 0.32 |
| 392 | Arg | 1 | 3.76 | 1.51 |
| 410 | Phe | 1 | 0.76 | 3.21 |
| 412 | His | 1 | 0.4 | 2.61 |
| 448 | Glu | 0 | −0.03 | −0.12 |
| 450 | Met | 1 | 0.13 | 2.38 |
| 453 | Lys | 0 | −0.12 | 0.08 |
| 456 | Leu | 1 | 0.48 | 1.34 |
| 466 | Arg | 1 | 0.07 | 0.94 |
| 469 | Lys | 1 | 0.62 | −0.14 |
| 471 | Phe | 1 | 2.05 | 1.65 |
| 473 | Tyr | 1 | 1.73 | 1.8 |
| 474 | Val | 0 | 0.07 | 0.43 |
Note: Residues are considered hot spots when ΔΔG(complex) is greater than 1.0 (kcal/mol). The columns contain the following information: (Column 3) int_id: Measure of whether a residue side chain atom is within 4 Å of an atom on the other partner (1) or not contacting directly, but buried upon binding (0); (Column 4) ΔΔG(complex): Predicted change in binding free energy upon alanine mutation; and (Column 5) ΔG(partner): Predicted change in protein stability of the mutated complex partner upon alanine mutation.
KFC2, while correctly labeling Arg392 and Phe471 as hot spots, incorrectly labeled two residues as hot spots (Phe410 and His412) and missed Tyr473. KFC2 labels a residue a hot spot if the confidence of either method is greater than zero (Table 3). It is interesting that despite KFC2a’s higher reported sensitivity and accuracy when compared to KFC2b, no hot spots were predicted for this particular complex with KFC2a. Hotpoint had similar results to KFC2, predicting Arg392 and Phe471 correctly, but missing Tyr473 and incorrectly predicting Phe410 as a hot spot (Table 4). Both KFC2 and Hotpoint did not predict Phe417 as a hot spot, even though it is clear to see that in both methods, it was calculated as very close to the cutoff values for a hot spot prediction: Tyr473’s confidence in the KFC2b model was the closest to being greater than zero than all other residues, and Hotpoint did not label Tyr473 a hot spot only because the potential was not greater than 18.0. Hotpoint’s false positives (Phe410 and Met450) exist only from the high potential of those residues, not from the ASA factors. Both Phe410 and Met450 were experimentally shown not to be hot spot residues [113]. It is interesting to note that Phe410 was scored highly in each of the programs listed here, which indicates that its mutation to alanine in TRAF6 will likely destabilize the complex, but likely not enough for it to affect the binding affinity to RANK.
Table 3.
KFC2 prediction of hot spots on TRAF6.
| Num | Res | KFC2-A Class | KFC20-A Conf | KFC2-B Class | KFC2-B Conf |
|---|---|---|---|---|---|
| 374 | Val | 0 | −1.78 | 0 | -0.99 |
| 376 | His | 0 | −2.18 | 0 | -0.98 |
| 392 | Arg | 0 | −0.37 | Hotspot | 0.15 |
| 394 | His | 0 | −1.9 | 0 | −0.95 |
| 410 | Phe | 0 | −0.43 | Hotspot | 0.23 |
| 412 | His | 0 | −0.63 | Hotspot | 0.05 |
| 448 | Glu | 0 | −2.31 | 0 | −0.98 |
| 449 | Ile | 0 | −2.39 | 0 | −0.92 |
| 450 | Met | 0 | −1.42 | 0 | −0.26 |
| 451 | Asp | 0 | −2.32 | 0 | −0.96 |
| 453 | Lys | 0 | −1.77 | 0 | −0.96 |
| 456 | Leu | 0 | −1.25 | 0 | −0.83 |
| 457 | Leu | 0 | −2.37 | 0 | −0.94 |
| 458 | Ala | 0 | −0.84 | 0 | −0.76 |
| 466 | Arg | 0 | −1.8 | 0 | −0.79 |
| 468 | Pro | 0 | −0.88 | 0 | −0.8 |
| 469 | Lys | 0 | −0.79 | 0 | −0.56 |
| 470 | Gly | 0 | −0.22 | 0 | −0.46 |
| 471 | Phe | 0 | −0.17 | Hotspot | 0.28 |
| 472 | Gly | 0 | −0.38 | 0 | −0.59 |
| 473 | Tyr | 0 | −0.87 | 0 | −0.04 |
| 474 | Val | 0 | −1.24 | 0 | −0.95 |
| 475 | Thr | 0 | −1.83 | 0 | −0.99 |
Note: Predicted KFC model classification (A or B model); (Conf): Confidence of prediction. Residues in bold (Arg392, Phe471, Tyr473) are experimentally proven hot spots.
Table 4.
Hotpoint prediction of TRAF6 hot spots.
| Num | Residue | RelComp ASA | RelMonomer ASA | Potential | Prediction |
|---|---|---|---|---|---|
| 374 | Val | 36.17 | 50.36 | 12.38 | 0 |
| 376 | His | 29.78 | 35.89 | 18.13 | 0 |
| 392 | Arg | 1.34 | 22.39 | 25.64 | Hotspot |
| 410 | Phe | 1.94 | 11.86 | 28.55 | Hotspot |
| 450 | Met | 1.76 | 6.09 | 33.49 | Hotspot |
| 456 | Leu | 21.77 | 35.29 | 11 | 0 |
| 457 | Leu | 61.09 | 62.37 | 7.59 | 0 |
| 458 | Ala | 2.41 | 5.39 | 13.8 | 0 |
| 468 | Pro | 37.32 | 74.16 | 4.79 | 0 |
| 469 | Lys | 25.35 | 53.96 | 8.9 | 0 |
| 470 | Gly | 0.19 | 29.14 | 12.76 | 0 |
| 471 | Phe | 1.22 | 22.9 | 37.55 | Hotspot |
| 472 | Gly | 0.45 | 35.78 | 16.16 | 0 |
| 473 | Tyr | 7.52 | 27.91 | 17.22 | 0 |
Note: (RelComp ASA): Relative ASA of the complex, (RelMonomer ASA): Relative ASA of the monomer. Residues in bold (Arg392, Phe471, Tyr473) are experimentally proven hot spots.
Conclusion and Perspective
Successful identification of hot spots involved in protein interfaces is crucial in determining potential active sites, and the corresponding druggability of a protein target. It is only after the completion of this step that rational, structural based drug design can begin. Systematic mutagenesis of protein-protein interactions has yielded a wealth of information on the hot spots themselves, but there are significant inroads that can be made as to the general nature of these hot spots. Unfortunately, no general patterns of shape, charge or hydrophobicity exist that can be used to predict which residues form hot spots [6, 10]. Additionally, residue conservation is rarely sufficient for accurate prediction of protein interfaces [43]. Further potential pitfalls become apparent when considering the inherent plasticity and expansive diversity of PPIs.
Despite these challenges, the increasing use of computational methods holds high potential to provide accurate analysis in prediction of hot spots at a fraction of the time and cost for conventional, experimental techniques. Advancement in both hardware processing power as well as software predictive models will increase the speed and the accuracy of hot spot predictions. The increasing rate of both crystallographically resolved protein-protein complexes as well as experimental alanine mutagenesis studies will provide a more comprehensive dataset from which to further increase the accuracy of computational prediction of hot spots. Composite approaches that incorporate initial computational predictions, and are then validated against experimental means provide the most comprehensive understanding of the nature of hot spots. These validations will vastly improve the predictive power of in silico techniques by continually evolving from the increasing pool of data from which they are built upon.
Acknowledgments
This work was supported in part by the US Department of Defense Concept Awards (BC085871), Grant # IRG-08-061-01 from the American Cancer Society and MDACC-UT Austin CTT-TI3D grants.
Footnotes
Competing Interest Statement
The authors declare that they have no competing interests.
References
- 1.Gavin AC, Bosche M, Krause R, et al. Functional organization of the yeast proteome by systematic analysis of protein complexes. Nature. 2002;415:141–7. doi: 10.1038/415141a. [DOI] [PubMed] [Google Scholar]
- 2.Johnson JE. Functional implications of protein-protein interactions in icosahedral viruses. Proc Natl Acad Sci U S A. 1996;93:27–33. doi: 10.1073/pnas.93.1.27. [DOI] [PMC free article] [PubMed] [Google Scholar]
- 3.Chothia C, Janin J. Principles of protein-protein recognition. Nature. 1975;256:705–8. doi: 10.1038/256705a0. [DOI] [PubMed] [Google Scholar]
- 4.Lawrence MC, Colman PM. Shape complementarity at protein/protein interfaces. J Mol Biol. 1993;234:946–50. doi: 10.1006/jmbi.1993.1648. [DOI] [PubMed] [Google Scholar]
- 5.Norel R, Lin SL, Wolfson HJ, Nussinov R. Shape complementarity at protein-protein interfaces. Biopolymers. 1994;34:933–40. doi: 10.1002/bip.360340711. [DOI] [PubMed] [Google Scholar]
- 6.Lo Conte L, Chothia C, Janin J. The atomic structure of protein-protein recognition sites. J Mol Biol. 1999;285:2177–98. doi: 10.1006/jmbi.1998.2439. [DOI] [PubMed] [Google Scholar]
- 7.Keskin O, Ma B, Nussinov R. Hot regions in protein--protein interactions: the organization and contribution of structurally conserved hot spot residues. J Mol Biol. 2005;345:1281–94. doi: 10.1016/j.jmb.2004.10.077. [DOI] [PubMed] [Google Scholar]
- 8.Janin J. Elusive affinities. Proteins. 1995;21:30–9. doi: 10.1002/prot.340210105. [DOI] [PubMed] [Google Scholar]
- 9.Janin J. Protein-protein recognition. Prog Biophys Mol Biol. 1995;64:145–66. doi: 10.1016/s0079-6107(96)00001-6. [DOI] [PubMed] [Google Scholar]
- 10.Jones S, Thornton JM. Principles of protein-protein interactions. Proc Natl Acad Sci U S A. 1996;93:13–20. doi: 10.1073/pnas.93.1.13. [DOI] [PMC free article] [PubMed] [Google Scholar]
- 11.Janin J, Chothia C. The structure of protein-protein recognition sites. J Biol Chem. 1990;265:16027–30. [PubMed] [Google Scholar]
- 12.Tsai CJ, Nussinov R. Hydrophobic folding units at protein-protein interfaces: implications to protein folding and to protein-protein association. Protein Sci. 1997;6:1426–37. doi: 10.1002/pro.5560060707. [DOI] [PMC free article] [PubMed] [Google Scholar]
- 13.Horton N, Lewis M. Calculation of the free energy of association for protein complexes. Protein Sci. 1992;1:169–81. doi: 10.1002/pro.5560010117. [DOI] [PMC free article] [PubMed] [Google Scholar]
- 14.Verkhivker GM, Bouzida D, Gehlhaar DK, et al. Computational detection of the binding-site hot spot at the remodeled human growth hormone-receptor interface. Proteins. 2003;53:201–19. doi: 10.1002/prot.10456. [DOI] [PubMed] [Google Scholar]
- 15.Aqvist J, Luzhkov VB, Brandsdal BO. Ligand binding affinities from MD simulations. Acc Chem Res. 2002;35:358–65. doi: 10.1021/ar010014p. [DOI] [PubMed] [Google Scholar]
- 16.Marcotte EM, Pellegrini M, Ng HL, et al. Detecting protein function and protein-protein interactions from genome sequences. Science. 1999;285:751–3. doi: 10.1126/science.285.5428.751. [DOI] [PubMed] [Google Scholar]
- 17.Blazer LL, Neubig RR. Small molecule protein-protein interaction inhibitors as CNS therapeutic agents: current progress and future hurdles. Neuropsychopharmacology. 2009;34:126–41. doi: 10.1038/npp.2008.151. [DOI] [PubMed] [Google Scholar]
- 18.White AW, Westwell AD, Brahemi G. Protein-protein interactions as targets for small-molecule therapeutics in cancer. Expert Rev Mol Med. 2008;10:e8. doi: 10.1017/S1462399408000641. [DOI] [PubMed] [Google Scholar]
- 19.Ajay A, Walters WP, Murcko MA. Can we learn to distinguish between “drug-like” and “nondrug-like” molecules? J Med Chem. 1998;41:3314–24. doi: 10.1021/jm970666c. [DOI] [PubMed] [Google Scholar]
- 20.Lipinski CA, Lombardo F, Dominy BW, Feeney PJ. Experimental and computational approaches to estimate solubility and permeability in drug discovery and development settings. Adv Drug Deliv Rev. 2001;46:3–26. doi: 10.1016/s0169-409x(00)00129-0. [DOI] [PubMed] [Google Scholar]
- 21.Siehler S. Cell-based assays in GPCR drug discovery. Biotechnol J. 2008;3:471–83. doi: 10.1002/biot.200800001. [DOI] [PubMed] [Google Scholar]
- 22.Hopkins AL, Groom CR. The druggable genome. Nat Rev Drug Discov. 2002;1:727–30. doi: 10.1038/nrd892. [DOI] [PubMed] [Google Scholar]
- 23.Ofran Y, Punta M, Schneider R, Rost B. Beyond annotation transfer by homology: novel protein-function prediction methods to assist drug discovery. Drug Discov Today. 2005;10:1475–82. doi: 10.1016/S1359-6446(05)03621-4. [DOI] [PubMed] [Google Scholar]
- 24.Keskin O, Gursoy A, Ma B, Nussinov R. Towards drugs targeting multiple proteins in a systems biology approach. Curr Top Med Chem. 2007;7:943–51. doi: 10.2174/156802607780906690. [DOI] [PubMed] [Google Scholar]
- 25.Sharma SK, Ramsey TM, Bair KW. Protein-protein interactions: lessons learned. Curr Med Chem Anticancer Agents. 2002;2:311–30. doi: 10.2174/1568011023354191. [DOI] [PubMed] [Google Scholar]
- 26.The PyMOL Molecular Graphics System, Version 1.3. Schrödinger, LLC; [Google Scholar]
- 27.Clackson T, Wells JA. A hot spot of binding energy in a hormone-receptor interface. Science. 1995;267:383–6. doi: 10.1126/science.7529940. [DOI] [PubMed] [Google Scholar]
- 28.Bogan AA, Thorn KS. Anatomy of hot spots in protein interfaces. J Mol Biol. 1998;280:1–9. doi: 10.1006/jmbi.1998.1843. [DOI] [PubMed] [Google Scholar]
- 29.Wells JA. Systematic mutational analyses of protein-protein interfaces. Methods Enzymol. 1991;202:390–411. doi: 10.1016/0076-6879(91)02020-a. [DOI] [PubMed] [Google Scholar]
- 30.Schreiber G, Fersht AR. Energetics of protein-protein interactions: analysis of the barnase-barstar interface by single mutations and double mutant cycles. J Mol Biol. 1995;248:478–86. doi: 10.1016/s0022-2836(95)80064-6. [DOI] [PubMed] [Google Scholar]
- 31.Stites WE. Proteinminus signProtein Interactions: Interface Structure, Binding Thermodynamics, and Mutational Analysis. Chem Rev. 1997;97:1233–1250. doi: 10.1021/cr960387h. [DOI] [PubMed] [Google Scholar]
- 32.Clackson T, Ultsch MH, Wells JA, de Vos AM. Structural and functional analysis of the 1:1 growth hormone:receptor complex reveals the molecular basis for receptor affinity. J Mol Biol. 1998;277:1111–28. doi: 10.1006/jmbi.1998.1669. [DOI] [PubMed] [Google Scholar]
- 33.Hu Z, Ma B, Wolfson H, Nussinov R. Conservation of polar residues as hot spots at protein interfaces. Proteins. 2000;39:331–42. [PubMed] [Google Scholar]
- 34.Kouadio JL, Horn JR, Pal G, Kossiakoff AA. Shotgun alanine scanning shows that growth hormone can bind productively to its receptor through a drastically minimized interface. J Biol Chem. 2005;280:25524–32. doi: 10.1074/jbc.M502167200. [DOI] [PubMed] [Google Scholar]
- 35.Thorn KS, Bogan AA. ASEdb: a database of alanine mutations and their effects on the free energy of binding in protein interactions. Bioinformatics. 2001;17:284–5. doi: 10.1093/bioinformatics/17.3.284. [DOI] [PubMed] [Google Scholar]
- 36.Moreira IS, Fernandes PA, Ramos MJ. Hot spots--a review of the protein-protein interface determinant amino-acid residues. Proteins. 2007;68:803–12. doi: 10.1002/prot.21396. [DOI] [PubMed] [Google Scholar]
- 37.Lichtarge O, Bourne HR, Cohen FE. An evolutionary trace method defines binding surfaces common to protein families. J Mol Biol. 1996;257:342–58. doi: 10.1006/jmbi.1996.0167. [DOI] [PubMed] [Google Scholar]
- 38.Samanta U, Pal D, Chakrabarti P. Environment of tryptophan side chains in proteins. Proteins. 2000;38:288–300. [PubMed] [Google Scholar]
- 39.Fernandez A. Desolvation shell of hydrogen bonds in folded proteins, protein complexes and folding pathways. FEBS Lett. 2002;527:166–70. doi: 10.1016/s0014-5793(02)03204-0. [DOI] [PubMed] [Google Scholar]
- 40.Li X, Keskin O, Ma B, Nussinov R, Liang J. Protein-protein interactions: hot spots and structurally conserved residues often locate in complemented pockets that pre-organized in the unbound states: implications for docking. J Mol Biol. 2004;344:781–95. doi: 10.1016/j.jmb.2004.09.051. [DOI] [PubMed] [Google Scholar]
- 41.Ma B, Elkayam T, Wolfson H, Nussinov R. Protein-protein interactions: structurally conserved residues distinguish between binding sites and exposed protein surfaces. Proc Natl Acad Sci U S A. 2003;100:5772–7. doi: 10.1073/pnas.1030237100. [DOI] [PMC free article] [PubMed] [Google Scholar]
- 42.Lockless SW, Ranganathan R. Evolutionarily conserved pathways of energetic connectivity in protein families. Science. 1999;286:295–9. doi: 10.1126/science.286.5438.295. [DOI] [PubMed] [Google Scholar]
- 43.Caffrey DR, Somaroo S, Hughes JD, Mintseris J, Huang ES. Are protein-protein interfaces more conserved in sequence than the rest of the protein surface? Protein Sci. 2004;13:190–202. doi: 10.1110/ps.03323604. [DOI] [PMC free article] [PubMed] [Google Scholar]
- 44.Fraser HB, Hirsh AE, Steinmetz LM, Scharfe C, Feldman MW. Evolutionary rate in the protein interaction network. Science. 2002;296:750–2. doi: 10.1126/science.1068696. [DOI] [PubMed] [Google Scholar]
- 45.Panchenko AR, Kondrashov F, Bryant S. Prediction of functional sites by analysis of sequence and structure conservation. Protein Sci. 2004;13:884–92. doi: 10.1110/ps.03465504. [DOI] [PMC free article] [PubMed] [Google Scholar]
- 46.DeLano WL. Unraveling hot spots in binding interfaces: progress and challenges. Curr Opin Struct Biol. 2002;12:14–20. doi: 10.1016/s0959-440x(02)00283-x. [DOI] [PubMed] [Google Scholar]
- 47.Wells JA. Binding in the growth hormone receptor complex. Proc Natl Acad Sci U S A. 1996;93:1–6. doi: 10.1073/pnas.93.1.1. [DOI] [PMC free article] [PubMed] [Google Scholar]
- 48.Wells JA, de Vos AM. Structure and function of human growth hormone: implications for the hematopoietins. Annu Rev Biophys Biomol Struct. 1993;22:329–51. doi: 10.1146/annurev.bb.22.060193.001553. [DOI] [PubMed] [Google Scholar]
- 49.Thanos CD, DeLano WL, Wells JA. Hot-spot mimicry of a cytokine receptor by a small molecule. Proc Natl Acad Sci U S A. 2006;103:15422–7. doi: 10.1073/pnas.0607058103. [DOI] [PMC free article] [PubMed] [Google Scholar]
- 50.Arkin MR, Wells JA. Small-molecule inhibitors of protein-protein interactions: progressing towards the dream. Nat Rev Drug Discov. 2004;3:301–17. doi: 10.1038/nrd1343. [DOI] [PubMed] [Google Scholar]
- 51.Wells JA, McClendon CL. Reaching for high-hanging fruit in drug discovery at protein-protein interfaces. Nature. 2007;450:1001–9. doi: 10.1038/nature06526. [DOI] [PubMed] [Google Scholar]
- 52.Wrighton NC, Farrell FX, Chang R, et al. Small peptides as potent mimetics of the protein hormone erythropoietin. Science. 1996;273:458–64. doi: 10.1126/science.273.5274.458. [DOI] [PubMed] [Google Scholar]
- 53.Sidhu SS, Lowman HB, Cunningham BC, Wells JA. Phage display for selection of novel binding peptides. Methods Enzymol. 2000;328:333–63. doi: 10.1016/s0076-6879(00)28406-1. [DOI] [PubMed] [Google Scholar]
- 54.Livnah O, Stura EA, Johnson DL, et al. Functional mimicry of a protein hormone by a peptide agonist: the EPO receptor complex at 2.8 A. Science. 1996;273:464–71. doi: 10.1126/science.273.5274.464. [DOI] [PubMed] [Google Scholar]
- 55.DeLano WL, Ultsch MH, de Vos AM, Wells JA. Convergent solutions to binding at a protein-protein interface. Science. 2000;287:1279–83. doi: 10.1126/science.287.5456.1279. [DOI] [PubMed] [Google Scholar]
- 56.Li R, Dowd V, Stewart DJ, Burton SJ, Lowe CR. Design, synthesis, and application of a protein A mimetic. Nat Biotechnol. 1998;16:190–5. doi: 10.1038/nbt0298-190. [DOI] [PubMed] [Google Scholar]
- 57.Tilley JW, Chen L, Fry DC, et al. Identification of a small molecule inhibitor of the IL-2/IL-2R alpha receptor interaction which binds to IL-2. Journal of the American Chemical Society. 1997;119:7589–7590. [Google Scholar]
- 58.Gonzalez-Ruiz D, Gohlke H. Targeting protein-protein interactions with small molecules: challenges and perspectives for computational binding epitope detection and ligand finding. Curr Med Chem. 2006;13:2607–25. doi: 10.2174/092986706778201530. [DOI] [PubMed] [Google Scholar]
- 59.Rajamani D, Thiel S, Vajda S, Camacho CJ. Anchor residues in protein-protein interactions. Proc Natl Acad Sci U S A. 2004;101:11287–92. doi: 10.1073/pnas.0401942101. [DOI] [PMC free article] [PubMed] [Google Scholar]
- 60.Acuner Ozbabacan SE, Gursoy A, Keskin O, Nussinov R. Conformational ensembles, signal transduction and residue hot spots: application to drug discovery. Curr Opin Drug Discov Devel. 2010;13:527–37. [PubMed] [Google Scholar]
- 61.Wells JA. Additivity of mutational effects in proteins. Biochemistry. 1990;29:8509–17. doi: 10.1021/bi00489a001. [DOI] [PubMed] [Google Scholar]
- 62.Cunningham BC, Wells JA. High-resolution epitope mapping of hGH-receptor interactions by alanine-scanning mutagenesis. Science. 1989;244:1081–5. doi: 10.1126/science.2471267. [DOI] [PubMed] [Google Scholar]
- 63.Skolnick J, Fetrow JS, Kolinski A. Structural genomics and its importance for gene function analysis. Nat Biotechnol. 2000;18:283–7. doi: 10.1038/73723. [DOI] [PubMed] [Google Scholar]
- 64.Morrison KL, Weiss GA. Combinatorial alanine-scanning. Curr Opin Chem Biol. 2001;5:302–7. doi: 10.1016/s1367-5931(00)00206-4. [DOI] [PubMed] [Google Scholar]
- 65.Dinner AR, Sali A, Smith LJ, Dobson CM, Karplus M. Understanding protein folding via free-energy surfaces from theory and experiment. Trends Biochem Sci. 2000;25:331–9. doi: 10.1016/s0968-0004(00)01610-8. [DOI] [PubMed] [Google Scholar]
- 66.Kumar S, Ma B, Tsai CJ, Sinha N, Nussinov R. Folding and binding cascades: dynamic landscapes and population shifts. Protein Sci. 2000;9:10–9. doi: 10.1110/ps.9.1.10. [DOI] [PMC free article] [PubMed] [Google Scholar]
- 67.Fischer TB, Arunachalam KV, Bailey D, et al. The binding interface database (BID): a compilation of amino acid hot spots in protein interfaces. Bioinformatics. 2003;19:1453–4. doi: 10.1093/bioinformatics/btg163. [DOI] [PubMed] [Google Scholar]
- 68.Piehler J, Schreiber G. Fast transient cytokine-receptor interactions monitored in real time by reflectometric interference spectroscopy. Anal Biochem. 2001;289:173–86. doi: 10.1006/abio.2000.4920. [DOI] [PubMed] [Google Scholar]
- 69.Weiss GA, Watanabe CK, Zhong A, Goddard A, Sidhu SS. Rapid mapping of protein functional epitopes by combinatorial alanine scanning. Proc Natl Acad Sci U S A. 2000;97:8950–4. doi: 10.1073/pnas.160252097. [DOI] [PMC free article] [PubMed] [Google Scholar]
- 70.Schymkowitz J, Borg J, Stricher F, et al. The FoldX web server: an online force field. Nucleic Acids Res. 2005;33:W382–8. doi: 10.1093/nar/gki387. [DOI] [PMC free article] [PubMed] [Google Scholar]
- 71.Kim DE, Chivian D, Baker D. Protein structure prediction and analysis using the Robetta server. Nucleic Acids Res. 2004;32:W526–31. doi: 10.1093/nar/gkh468. [DOI] [PMC free article] [PubMed] [Google Scholar]
- 72.Gao Y, Wang R, Lai L. Structure-based method for analyzing protein-protein interfaces. J Mol Model. 2004;10:44–54. doi: 10.1007/s00894-003-0168-3. [DOI] [PubMed] [Google Scholar]
- 73.Brenke R, Kozakov D, Chuang GY, et al. Fragment-based identification of druggable ‘hot spots’ of proteins using Fourier domain correlation techniques. Bioinformatics. 2009;25:621–7. doi: 10.1093/bioinformatics/btp036. [DOI] [PMC free article] [PubMed] [Google Scholar]
- 74.Assi SA, Tanaka T, Rabbitts TH, Fernandez-Fuentes N. PCRPi: Presaging Critical Residues in Protein interfaces, a new computational tool to chart hot spots in protein interfaces. Nucleic Acids Res. 2010;38:e86. doi: 10.1093/nar/gkp1158. [DOI] [PMC free article] [PubMed] [Google Scholar]
- 75.Segura Mora J, Assi SA, Fernandez-Fuentes N. Presaging critical residues in protein interfaces-web server (PCRPi-W): a web server to chart hot spots in protein interfaces. PLoS One. 2010;5:e12352. doi: 10.1371/journal.pone.0012352. [DOI] [PMC free article] [PubMed] [Google Scholar]
- 76.Guharoy M, Chakrabarti P. Empirical estimation of the energetic contribution of individual interface residues in structures of protein-protein complexes. J Comput Aided Mol Des. 2009;23:645–54. doi: 10.1007/s10822-009-9282-3. [DOI] [PubMed] [Google Scholar]
- 77.Zhu X, Mitchell JC. KFC2: A knowledge-based hot spot prediction method based on interface solvation, atomic density, and plasticity features. Proteins. 2011;79:2671–83. doi: 10.1002/prot.23094. [DOI] [PubMed] [Google Scholar]
- 78.Cho KI, Kim D, Lee D. A feature-based approach to modeling protein-protein interaction hot spots. Nucleic Acids Res. 2009;37:2672–87. doi: 10.1093/nar/gkp132. [DOI] [PMC free article] [PubMed] [Google Scholar]
- 79.Lise S, Archambeau C, Pontil M, Jones DT. Prediction of hot spot residues at protein-protein interfaces by combining machine learning and energy-based methods. BMC Bioinformatics. 2009;10:365. doi: 10.1186/1471-2105-10-365. [DOI] [PMC free article] [PubMed] [Google Scholar]
- 80.Lise S, Buchan D, Pontil M, Jones DT. Predictions of hot spot residues at protein-protein interfaces using support vector machines. PLoS One. 2011;6:e16774. doi: 10.1371/journal.pone.0016774. [DOI] [PMC free article] [PubMed] [Google Scholar]
- 81.Higa RH, Tozzi CL. Prediction of binding hot spot residues by using structural and evolutionary parameters. Genet Mol Biol. 2009;32:626–33. doi: 10.1590/S1415-47572009000300029. [DOI] [PMC free article] [PubMed] [Google Scholar]
- 82.Grosdidier S, Fernandez-Recio J. Identification of hot-spot residues in protein-protein interactions by computational docking. BMC Bioinformatics. 2008;9:447. doi: 10.1186/1471-2105-9-447. [DOI] [PMC free article] [PubMed] [Google Scholar]
- 83.Tuncbag N, Keskin O, Gursoy A. HotPoint: hot spot prediction server for protein interfaces. Nucleic Acids Res. 2010;38:W402–6. doi: 10.1093/nar/gkq323. [DOI] [PMC free article] [PubMed] [Google Scholar]
- 84.Guney E, Tuncbag N, Keskin O, Gursoy A. HotSprint: database of computational hot spots in protein interfaces. Nucleic Acids Res. 2008;36:D662–6. doi: 10.1093/nar/gkm813. [DOI] [PMC free article] [PubMed] [Google Scholar]
- 85.Tuncbag N, Kar G, Keskin O, Gursoy A, Nussinov R. A survey of available tools and web servers for analysis of protein-protein interactions and interfaces. Brief Bioinform. 2009;10:217–32. doi: 10.1093/bib/bbp001. [DOI] [PMC free article] [PubMed] [Google Scholar]
- 86.Guerois R, Nielsen JE, Serrano L. Predicting changes in the stability of proteins and protein complexes: a study of more than 1000 mutations. J Mol Biol. 2002;320:369–87. doi: 10.1016/S0022-2836(02)00442-4. [DOI] [PubMed] [Google Scholar]
- 87.Kortemme T, Kim DE, Baker D. Computational alanine scanning of protein-protein interfaces. Sci STKE. 2004;2004:pl2. doi: 10.1126/stke.2192004pl2. [DOI] [PubMed] [Google Scholar]
- 88.Kortemme T, Baker D. A simple physical model for binding energy hot spots in protein-protein complexes. Proc Natl Acad Sci U S A. 2002;99:14116–21. doi: 10.1073/pnas.202485799. [DOI] [PMC free article] [PubMed] [Google Scholar]
- 89.Chen J, Lai L. Pocket v.2: further developments on receptor-based pharmacophore modeling. J Chem Inf Model. 2006;46:2684–91. doi: 10.1021/ci600246s. [DOI] [PubMed] [Google Scholar]
- 90.Mattos C, Ringe D. Locating and characterizing binding sites on proteins. Nat Biotechnol. 1996;14:595–9. doi: 10.1038/nbt0596-595. [DOI] [PubMed] [Google Scholar]
- 91.Tuncbag N, Gursoy A, Keskin O. Identification of computational hot spots in protein interfaces: combining solvent accessibility and inter-residue potentials improves the accuracy. Bioinformatics. 2009;25:1513–20. doi: 10.1093/bioinformatics/btp240. [DOI] [PubMed] [Google Scholar]
- 92.Berman HM, Battistuz T, Bhat TN, et al. The Protein Data Bank. Acta Crystallogr D Biol Crystallogr. 2002;58:899–907. doi: 10.1107/s0907444902003451. [DOI] [PubMed] [Google Scholar]
- 93.Segura J, Fernandez-Fuentes N. PCRPi-DB: a database of computationally annotated hot spots in protein interfaces. Nucleic Acids Res. 2011;39:D755–60. doi: 10.1093/nar/gkq1068. [DOI] [PMC free article] [PubMed] [Google Scholar]
- 94.Yogurtcu ON, Erdemli SB, Nussinov R, Turkay M, Keskin O. Restricted mobility of conserved residues in protein-protein interfaces in molecular simulations. Biophys J. 2008;94:3475–85. doi: 10.1529/biophysj.107.114835. [DOI] [PMC free article] [PubMed] [Google Scholar]
- 95.Kimura SR, Brower RC, Vajda S, Camacho CJ. Dynamical view of the positions of key side chains in protein-protein recognition. Biophys J. 2001;80:635–42. doi: 10.1016/S0006-3495(01)76044-4. [DOI] [PMC free article] [PubMed] [Google Scholar]
- 96.Huo S, Massova I, Kollman PA. Computational alanine scanning of the 1:1 human growth hormone-receptor complex. J Comput Chem. 2002;23:15–27. doi: 10.1002/jcc.1153. [DOI] [PubMed] [Google Scholar]
- 97.Massova I, Kollman PA. Computational Alanine Scanning To Probe Protein-Protein Interactions: A Novel Approach To Evaluate Binding Free Energies. J Am Chem Soc. 1999;121:8133–8143. [Google Scholar]
- 98.Mitchell JC, Kerr R, Ten Eyck LF. Rapid atomic density methods for molecular shape characterization. J Mol Graph Model. 2001;19:325–30. 388–90. doi: 10.1016/s1093-3263(00)00079-6. [DOI] [PubMed] [Google Scholar]
- 99.Darnell SJ, LeGault L, Mitchell JC. KFC Server: interactive forecasting of protein interaction hot spots. Nucleic Acids Res. 2008;36:W265–9. doi: 10.1093/nar/gkn346. [DOI] [PMC free article] [PubMed] [Google Scholar]
- 100.Darnell SJ, Page D, Mitchell JC. An automated decision-tree approach to predicting protein interaction hot spots. Proteins. 2007;68:813–23. doi: 10.1002/prot.21474. [DOI] [PubMed] [Google Scholar]
- 101.Wang YT, Su ZY, Chen CL. Potential of mean force of the hepatitis C virus core protein-monoclonal 19D9D6 antibody interaction. Biophys Chem. 2009;145:86–90. doi: 10.1016/j.bpc.2009.09.004. [DOI] [PubMed] [Google Scholar]
- 102.Noble WS. What is a support vector machine? Nat Biotechnol. 2006;24:1565–7. doi: 10.1038/nbt1206-1565. [DOI] [PubMed] [Google Scholar]
- 103.Halperin I, Wolfson H, Nussinov R. Protein-protein interactions; coupling of structurally conserved residues of hot spots across interfaces Implications for docking. Structure. 2004;12:1027–38. doi: 10.1016/j.str.2004.04.009. [DOI] [PubMed] [Google Scholar]
- 104.Fernandez-Recio J, Totrov M, Abagyan R. Identification of protein-protein interaction sites from docking energy landscapes. J Mol Biol. 2004;335:843–65. doi: 10.1016/j.jmb.2003.10.069. [DOI] [PubMed] [Google Scholar]
- 105.Keskin O, Bahar I, Badretdinov AY, Ptitsyn OB, Jernigan RL. Empirical solvent-mediated potentials hold for both intra-molecular and inter-molecular inter-residue interactions. Protein Sci. 1998;7:2578–86. doi: 10.1002/pro.5560071211. [DOI] [PMC free article] [PubMed] [Google Scholar]
- 106.Eisenberg D, McLachlan AD. Solvation energy in protein folding and binding. Nature. 1986;319:199–203. doi: 10.1038/319199a0. [DOI] [PubMed] [Google Scholar]
- 107.Cao Z, Xiong J, Takeuchi M, Kurama T, Goeddel DV. TRAF6 is a signal transducer for interleukin-1. Nature. 1996;383:443–446. doi: 10.1038/383443a0. [DOI] [PubMed] [Google Scholar]
- 108.Zapata JM, Martinez-Garcia V, Lefebvre S. Phylogeny of the TRAF/MATH domain. Adv ExpMed Biol. 2007;597:1–24. doi: 10.1007/978-0-387-70630-6_1. [DOI] [PubMed] [Google Scholar]
- 109.Muzio M, Natoli G, Saccani S, Levrero M, Mantovani A. The human toll signaling pathway: divergence of nuclear factor kappaB and JNK/SAPK activation upstream of tumor necrosis factor receptor-associated factor 6 (TRAF6) J ExpMed. 1998;187:2097–2101. doi: 10.1084/jem.187.12.2097. [DOI] [PMC free article] [PubMed] [Google Scholar]
- 110.Chung JY, Park YC, Ye H, Wu H. All TRAFs are not created equal: common and distinct molecular mechanisms of TRAF-mediated signal transduction. J Cell Sci. 2002;115:679–688. doi: 10.1242/jcs.115.4.679. [DOI] [PubMed] [Google Scholar]
- 111.Darnay BG, Besse A, Poblenz AT, Lamothe B, Jacoby JJ. TRAFs in RANK signaling. Adv ExpMed Biol. 2007;597:152–159. doi: 10.1007/978-0-387-70630-6_12. [DOI] [PubMed] [Google Scholar]
- 112.Wu H, Arron JR. TRAF6, a molecular bridge spanning adaptive immunity, innate immunity and osteoimmunology. Bioessays. 2003;25:1096–1105. doi: 10.1002/bies.10352. [DOI] [PubMed] [Google Scholar]
- 113.Ye H, Arron JR, Lamothe B, et al. Distinct molecular mechanism for initiating TRAF6 signalling. Nature. 2002;418:443–447. doi: 10.1038/nature00888. [DOI] [PubMed] [Google Scholar]