

Abstract
The nuclear factor of activated T cells 5 (NFAT5 or TonEBP) is a Rel family transcriptional activator and is activated by hypertonic conditions. Several studies point to a possible connection between nuclear translocation and DNA binding; however, the mechanism of NFAT5 nuclear translocation and the effect of DNA binding on retaining NFAT5 in the nucleus are largely unknown. Recent experiments showed that different mutations introduced in the DNA-binding loop and dimerization interface were important for DNA binding and some of them decreased the nuclear–cytoplasm ratio of NFAT5. To understand the mechanisms of these mutations, we model their effect on protein dynamics and DNA binding. We show that the NFAT5 complex without DNA is much more flexible than the complex with DNA. Moreover, DNA binding considerably stabilizes the overall dimeric complex and the NFAT5 dimer is only marginally stable in the absence of DNA. Two sets of NFAT5 mutations from the same DNA-binding loop are found to have different mechanisms of specific and nonspecific binding to DNA. The R217A/E223A/R226A (R293A/E299A/R302A using isoform c numbering) mutant is characterized by significantly compromised binding to DNA and higher complex flexibility. On the contrary, the T222D (T298D in isoform c) mutation, a potential phosphomimetic mutation, makes the overall complex more rigid and does not significantly affect the DNA binding. Therefore, the reduced nuclear–cytoplasm ratio of NFAT5 can be attributed to reduced binding to DNA for the triple mutant, while the T222D mutant suggests an additional mechanism at work.
Introduction
The nuclear factor of activated T cells 5 (NFAT5, also known as TonEBP or OREBP) is a Rel family transcriptional activator. NFAT5 is among the very few mammalian transcription factors activated by hypertonic conditions. It regulates the transcription of membrane transporters and synthetic enzymes, and its activation causes the adaptive accumulation of organic osmolytes in the cell.1 In addition, NFAT5 also can regulate other important cellular processes including the migration of carcinoma cells2 and atherosclerotic lesion formation.3 NFAT5 belongs to the NFAT family of transcription factors and its DNA binding domain shares a high sequence identity with the NFAT1–4 proteins. However, unlike other NFAT1–4 proteins which can bind DNA as monomers, NFAT5 binds to DNA as a dimer. Experimental data shows that it likely forms a dimer in solution even in the absence of DNA and dimerization is necessary for DNA binding and transcriptional activity.4 The DNA affinity of NFAT5 is much lower than that of NFAT1–4;5 however, it has a slower dissociation rate than another Rel dimeric transcription factor, NF-kB.5
The nfat5 gene encodes multiple isoforms of which NFAT5a and c have been most extensively studied. NFATa and c have identical sequences, but NFATc has an additional 76 amino acids at the N-terminus. In this work, we use the amino acid numbering of the NFAT5 isoform a but include notation of the corresponding amino acids in isoform c. The crystal structure of an NFAT5 region containing amino acids 170–470 (246–546 isoform c) in complex with DNA was resolved about 10 years ago.5 This region of NFAT5 has two domains: an N-terminal Rel homology domain (RHD) which makes most of the contacts with DNA and a C-terminal IPT domain which mediates interactions between the two monomers and has limited contacts with DNA.6 The crystal structure of the NFAT5 complex with DNA remains the only available structure of this protein.5 According to this structure, one monomer of NFAT5 makes specific contacts with the conserved DNA “consensus” nucleotides (TGGAAA) of the NFAT5 cognate DNA element, ORE (osmotic response element). The other monomer binds to other, nonconserved nucleotides of OREs5 which differ among NFAT5 target genes. The detailed comparative analysis of NFAT5 and NFκB structures showed that dimerization interfaces formed by the RHR-C domains of NFAT5 are very similar to those observed in NFκB. However, the NFAT5 dimer–DNA complex has a second dimer interface which is formed by the E′F loop of the RHR-N domain.
Nuclear translocation of NFAT5 in response to change in tonicity has been studied and several regions have been identified. A nuclear export sequence (NES) is unique to isoform c, whereas a nuclear localization sequence (NLS) and an auxiliary export domain (AED) are common to all NFAT5 isoforms.7 Moreover, several studies point to a possible connection between nuclear translocation and DNA binding. Namely, different mutations introduced in the DNA-binding loop and dimerization interface of the C-terminal domain were found to be important for DNA binding and some of them greatly decreased the NFAT5 nuclear–cytoplasm ratio.4,8 However, the mechanism of NFAT5 nuclear translocation and the effect of other protein or DNA binding on retaining NFAT5 in the nucleus are largely unknown. Mutations represent a convenient way to decouple DNA-binding specific events from other effects, and here we model the effect of different mutations in the DNA-binding loop on protein dynamics and binding.
We find that the specifically bound chain makes more contacts with the DNA molecule and its binding affinity is higher compared to the nonspecifically bound chain. These contacts, coming from the DNA-binding loop and a few other regions, confer binding specificity. Moreover, the nonspecific chain is characterized by higher flexibility than the specifically bound chain. We show that the NFAT5 complex without DNA is much more flexible than the complex with DNA and the binding energy to DNA significantly exceeds the energy of stabilization of the dimer without DNA. In other words, DNA binding considerably stabilizes the dimeric complex. We investigate the effects of two sets of mutations from the DNA-binding loop experimentally analyzed previously,8 and observe that different NFAT5 mutants have different mechanisms of specific and nonspecific binding to DNA. The R217A/E223A/R226A (R293A/E299A/R302A in isoform c) mutant is characterized by significantly compromised binding to DNA and higher complex flexibility, whereas the T222D (T298D in isoform c) mutation, on the contrary, makes the overall complex more rigid and does not affect DNA binding much. Our analysis also suggests that it is unlikely that a fully formed NFAT5 dimer can form prior to nuclear binding to DNA without significant structural rearrangements.
Methods
Model Preparation
We used the only available X-ray structure of the NFAT5 homodimer/DNA complex (PDB code: 1IMH).5 By removing the DNA molecule coordinates, we also produced a model system of the dimer in the absence of DNA (“Native_withDNA”, “Native_noDNA”). Altogether we created six systems for further molecular dynamics (MD) simulation analysis. We introduced a T222D mutation (T298 in isoform c) in both chains (Chain C and Chain D) with and without DNA (“T222D_withDNA”, “T222D_noDNA”). Separately, we created a triple mutant in each chain by substituting residues R217, E223, and R226 (R293, E299, and R302 in isoform c) into alanine (“3M_withDNA” and “3M_noDNA”). The mutants were made using the “mutator” plugin of the VMD molecular dynamics software, and the hydrogen atoms were added with the VMD program.9 All models were immersed into rectangular boxes of water molecules extending up to 10 Å from the protein in each direction. To ensure an ionic concentration of 150 mM (concentration reported in the original paper of the NFAT5 structure5) and zero net charge, Na+ and Cl– ions were added by VMD. The effect of salt concentration on protein binding was analyzed previously.10
MD Simulation Protocol
Six systems mentioned in the previous section were optimized and equilibrated using energy minimization and the MD simulation protocol. First, a 4000-step energy minimization was carried out using the steepest descent method, with harmonic restraints (force constant = 10 kcal/mol/Å2) applied on the backbone atoms of all residues, followed by an 8000-step energy minimization on the whole system. The systems were then heated to 300 K over 300 ps with harmonic constraints applied on protein backbone atoms. Consequently, the systems were subject to a 25 ns unconstrained MD simulation performed in the NPT ensemble. The Langevin piston Nosé–Hoover method11 was used to control temperature and pressure with temperature T = 300 K and pressure P = 1 atm. Periodic boundary conditions and a 12 Å cutoff distance for nonbonded interactions were applied to the systems. The particle mesh Ewald (PME) method12 was used to calculate the long-range electrostatic interactions. Lengths of hydrogen-containing bonds were constrained by the SHAKE algorithm,13 and the coordinates of the systems were saved every 2 ps during MD simulations. The energy minimization and MD simulation were carried out with NAMD program version 2.914 using the CHARMM27 force field15 and the TIP3P water model.16 Analyses of the trajectories were performed with the VMD software.
Principal Component and Contact Analyses
Principal component analysis (PCA) was applied to extract the dominant modes corresponding to the collective motions of atomic groups.17,18 To eliminate translational and rotational motions and isolate only the internal motions of the system, each frame of the trajectory was superimposed on the starting structure. The PCA analysis was applied to the Cartesian covariance matrix which was diagonalized to obtain a set of eigenvectors and corresponding eigenvalues. Hydrogen bonds and salt bridges were identified using the CHARMM program. To define a salt bridge, the maximum distance between charged heavy atoms was set to 4.0 Å.
Binding Energy Calculation
Binding energies were calculated using the MMPBSA method that combines the molecular mechanical energies with the Poisson–Boltzmann continuum representation of the solvent calculated using the Charmm force field. We extracted 60 snapshots of the last 6 ns of all MD trajectories for six systems (after stripping all water molecules and ions) to calculate the protein and protein–DNA binding energy. The binding energy ΔG was expressed as ΔG = ΔGVDW + ΔGELEC + ΔGSA. Here ΔGVDW corresponds to the van der Waals interaction energy in the gas phase and ΔGELEC and ΔGSA are polar and nonpolar solvation energies, respectively. All energy terms were calculated as the difference between the complex and each monomer (protein or DNA) in a solvent. ΔGELEC was estimated using the Poisson–Boltzmann (PB) method,19,20 while ΔGSA was approximated according to the formula GSA = 0.00542*SA + 0.92, where SA stands for the area of the molecular surface.21 In addition to an unweighted binding energy expression, we also used a weight of 0.5 on the van der Waals interaction energy term, as it was found to be more suitable to describe the experimentally measured pH dependency of the effect of mutations on the dissociation constants.22
For the PB calculation, dielectric constants of ε = 1, 2, and 4 were used for the protein interior23,24 and the dielectric constant for the exterior aqueous environment was set to ε = 80. Dielectric constant ε = 4 produced the smallest energy fluctuations among 6 ns snapshots and was applied in further analysis. All PB calculations were performed with the PBEQ module20,25 of the CHARMM program.26 The atomic Born radii were previously calibrated and optimized to reproduce the electrostatic free energy of the 20 amino acids in MD simulations with explicit water molecules.25 We also used a simplified binding energy calculation implemented in the FoldX method27 which calculates the effect of mutations using an empirical force field. FoldX optimizes the side chain configurations but does not estimate the effects produced by backbone conformational movements.
Results
Dynamics of NFAT5 Complex with and without DNA
The native complex of NFAT5 with DNA represents a dimer with two identical chains of 281 residues long each. Chain C makes specific contacts with the DNA molecule through the conserved nucleotides of the ORE, its DNA binding site. Chain D binds DNA less specifically mostly through contacts with the phosphate backbone of the non-consensus nucleotides of OREs.5 We performed MD simulations for six systems for 25 ns (Native_withDNA, Native_noDNA, 3M_withDNA, 3M_noDNA, T222D_withDNA, and T222D_noDNA). The time dependence of root-mean-square deviation (RMSD) of the main chain atoms from the minimized structure is shown in Figure 1. As one can see from comparing parts A and B of Figure 1, complexes without DNA deviate from the initial minimized NFAT5 structure considerably more than complexes with the DNA. All systems with DNA seem to reach equilibrium after 25 ns of simulation. To ensure convergence, we ran additional MD simulations for the native with DNA and T222D mutation systems. Although the systems without DNA have relatively large fluctuations, the RMSD does not increase any further after about 15 ns for these systems. We used the time-averaged coordinates within the last 6 ns as a representative of the final equilibrated structures (the native average NFAT5 structure for the first MD trajectory will be referred to as “native” hereafter), and calculated the binding energy between protein and DNA, between chains C and D within the last 6 ns.
Figure 1.
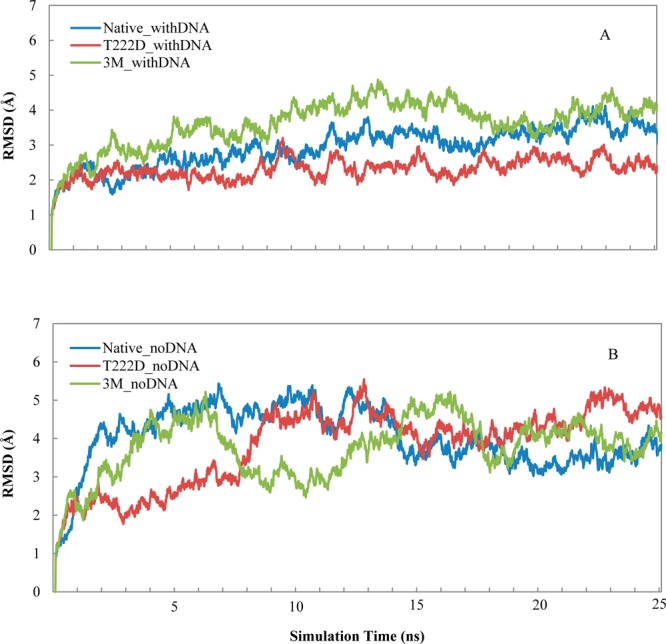
Backbone RMSD (with respect to the minimized structure) for six systems as a function of simulation time for (A) systems with DNA and (B) systems without DNA.
To identify the most flexible regions, next we analyzed the root-mean-square fluctuations (RMSFs) per residue. Figures 2A and 3B show the RMSF values calculated for c-alpha atoms based on the superposition of the whole protein complexes. These RMSF values correspond to the whole complex movements including the relative movements between chains. Figures 2B, 3B, and S4 (Supporting Information) depict RMSF values based on the superpositions of chains C and D separately, which allows us to compare the flexibilities of the two chains. As one can see from these figures, chain D (RMSF of 1.35 ± 0.05 Å, mean value and 95% confidence intervals are listed, standard deviation is 0.47 Å) in the native complex with DNA is more flexible than chain C (RMSF of 1.25 ± 0.06 Å, standard deviation is 0.51 Å, Wilcoxon test p-value <0.01). This observation is supported by the larger number of hydrogen bonds and salt bridges formed between chain C and DNA (Figure 3A and Table S1 (Supporting Information)) and its higher DNA binding affinity (Tables 1 and S3 (Supporting Information)). The DNA binding AB loop in the N-terminal domain (residues 217–227) is particularly rigid in both chains.
Figure 2.

RMSF per residue for the NFAT5 complex with DNA. (A) Frame alignments are based on the whole protein complex. (B) Frame alignments are based separately on chains C and D.
Figure 3.
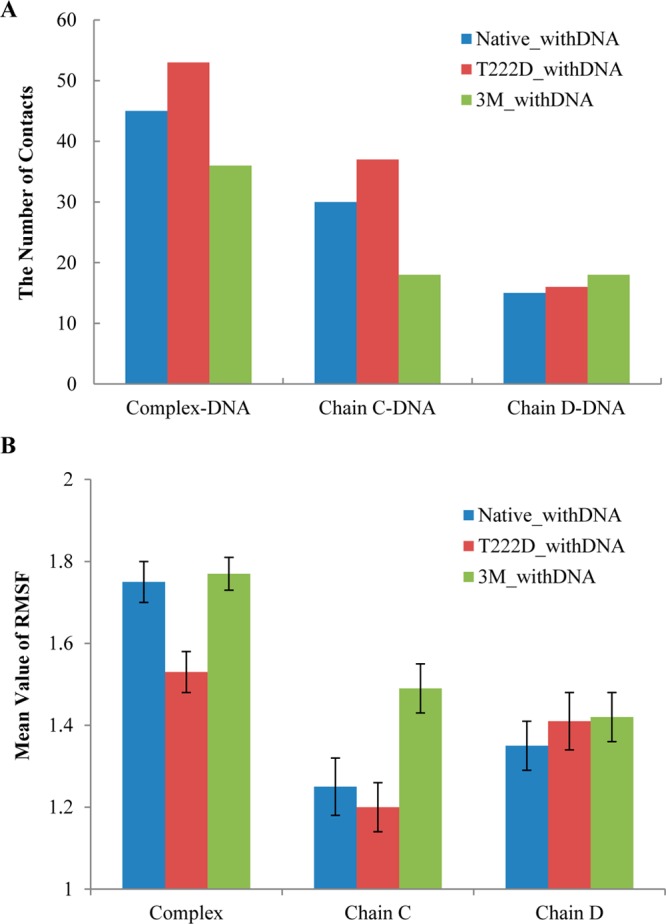
(A) The number of contacts (hydrogen bonds and salt bridges) between the protein complex and DNA, chain C and DNA, and chain D and DNA for the three systems with DNA. (B) Mean values and 95% confidence intervals (error bars) of RMSF. For “complex”, the alignment is based on the whole protein complex, and for “chain C” and “chain D”, the alignments are performed separately for each chain.
Table 1. Binding Energy between Protein and DNA (First Three Columns) and between Two Monomers (Last Column) in kcal/mola.
| complex–DNA | chain C–DNA | chain D–DNA | chain C–chain D | |
|---|---|---|---|---|
| ω = 1 | ||||
| native | 10.00 (0.39) | 3.50 (0.23) | 2.83 (0.23) | 2.97 (0.23) |
| T222D | 9.84 (0.46) | 3.77 (0.23) | 2.79 (0.23) | 3.37 (0.23) |
| R217, E223, R226 | 6.79 (0.46) | 2.82 (0.23) | 2.29 (0.15) | 2.97 (0.31) |
| ω = 0.5 | ||||
| native | 10.00 (0.62) | 3.61 (0.39) | 2.89 (0.39) | 2.73 (0.23) |
| T222D | 9.24 (0.54) | 3.79 (0.23) | 2.76 (0.23) | 2.92 (0.23) |
| R217, E223, R226 | 6.47 (0.62) | 3.13 (0.23) | 2.36 (0.23) | 2.78 (0.31) |
The binding energy of the native complex was scaled to 10 kcal/mol, the experimental value obtained previously.5 Standard deviations are listed in parentheses for energies calculated within 60 frames of the last 6 ns. Binding free energy decomposition at the atomic level was made using Charmm software. Different weights (ω = 1 and ω = 5) are used for the van der Waals term of the binding energy expression.
The NFAT5 dimer without DNA is characterized by much higher flexibility than the complex with DNA (Figure S1 (Supporting Information), Wilcoxon test p-value ≪0.01). This difference is especially pronounced for the RHD domain of chain C and can be explained by chain C making specific contacts with the DNA molecule. The large difference between complexes with and without DNA is also evident from the PCA analysis (Figures 4 and S5 (Supporting Information)) and is consistent with the binding energy calculations, according to which the binding affinity of two monomers in the dimer is considerably lower than the binding energy between protein and DNA (Table 1). When we compare actual native dimer structures with and without DNA after MD simulations (structures are averaged over the last 6 ns), we found that the dimer structure without DNA has changed compared to the native structure with DNA (only 149 residues on one chain could be structurally superimposed within 0.5 Å on the 562-residue dimer). As can be judged from the structural superposition, almost half of all contacts (hydrogen bonds and salt bridges) with the DNA molecule which are present in the DNA complex are lost in a dimer without DNA. Therefore, even if a dimer can be formed prior to DNA binding, significant conformational adjustments may take place when it binds to DNA.
Figure 4.
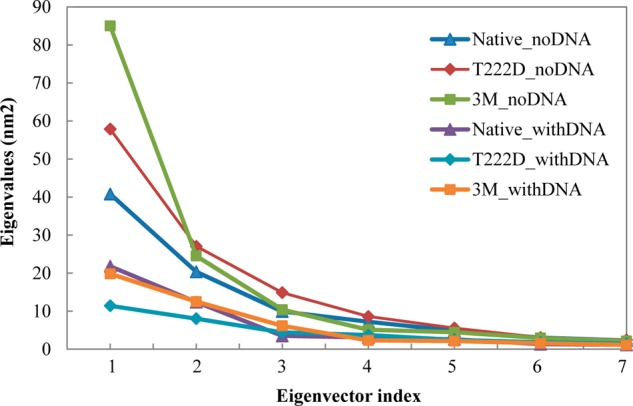
Eigenvalues for all six systems plotted for each eigenvector index.
Next we analyzed the effects of two series of mutations on NFAT5 dynamics which revealed two different outcomes produced by mutations from the same DNA-binding loop.
Effect of R217A, E223A, and R226A Mutations on NFAT5 Dynamics and Binding
Next we investigated the effect of three mutations R217A, E223A, and R226A which were experimentally shown to reduce the nuclear–cytoplasm ratio.8 According to the IBIS database,28 R217 and R226 residues make contacts with the DNA coding strand and these contacts are invariant in many NFAT transcription factors, whereas an invariant E223 residue binds a noncoding DNA strand. A comparison of native and triple mutant complexes with DNA shows that, while three residues in each chain lose their specific and nonspecific contacts with DNA (all three mutations occur in the DNA-binding loop), the structure undergoes local conformational changes to maximize the contacts with DNA and to make new contacts which are not observed in the native complex (Table S1 (Supporting Information)). Overall, the mutant complex loses nine contacts (hydrogen bonds or salt bridges) with the DNA molecule. Namely, it loses 12 contacts in chain C and gains three contacts in chain D, some of which are located far away in sequence and structure from the specific DNA-binding loop (Figures 3A and 6 and Table S1 (Supporting Information)). Interestingly, the loss of specific contacts with DNA by chain C and the gain of contacts by chain D make the mutant complex more symmetric with respect to DNA orientation (Figure 6 and Table S1 (Supporting Information)). This results in a considerable drop in binding energy from 10 to 6.79 kcal/mol for the whole complex with DNA for native compared to the triple mutant (Table 1). FoldX results confirm this observation (Table S2 (Supporting Information)). Although three mutations in the DNA-binding loop are introduced in both chains, they make chain C somewhat more flexible compared to the native complex (1.49 ± 0.06 Å and standard deviation of 0.52 Å compared to1.24 ± 0.06 Å, standard deviation of 0.51 Å, p-value <0.01) and have almost no effect on chain D (Figures 2B and 3B). The DNA-binding energy drops from 3.50 to 2.82 kcal/mol and from 2.83 to 2.29 kcal/mol for chains C and D, respectively. Moreover, loop 322–332 which contains several lysines and makes partial contacts with DNA in the native complex (Figure 6 and Table S1 (Supporting Information)) becomes more flexible and undergoes conformational movements in chain C (RMSF 2.27 Å compared to 1.70 Å in native protein) (Figure 2B).
Figure 6.
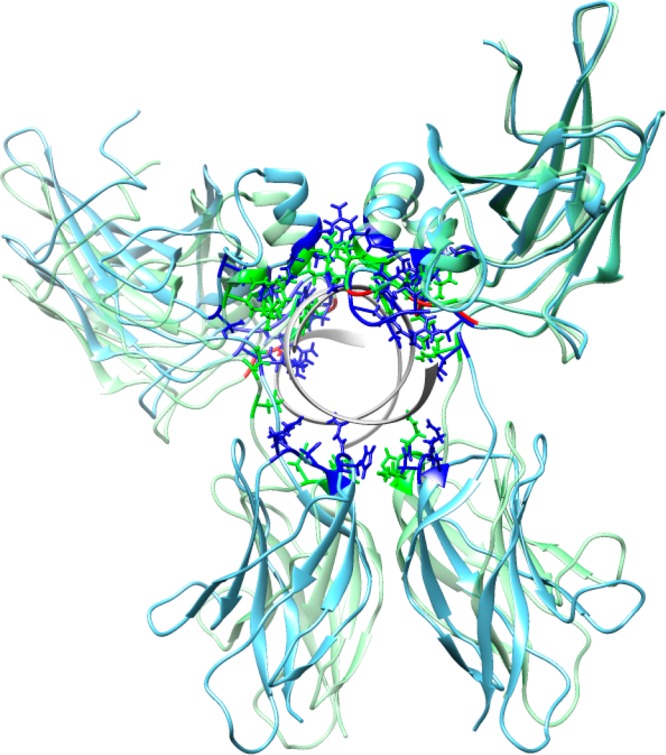
Native (blue) and triple mutant (green) structures are averaged over the last 6 ns and structurally superimposed. Side chains of residues making contacts with DNA are shown in blue and green. Mutated residues are shown in red. Structural superposition was performed using Chimera software.
Effect of T222D Mutation on NFAT5 Dynamics and Binding
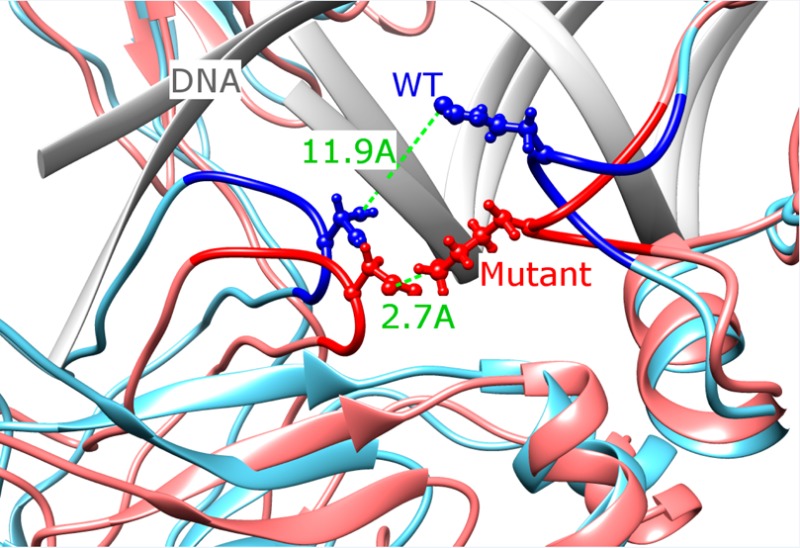
Next we examined the effect of the phosphomimetic mutation T222D on DNA binding in the presence of DNA. Previously, ScanSite29 software was used to predict that phosphorylated T222 site is a potential binding site for 14–3–3 proteins.8 We checked if T222 can be phosphorylated using additional two programs, and it was indeed predicted to be phosphorylated by KinasePhos30 and GPS31 though not with the DISPHOS32 program. According to the IBIS database,28 T222 makes contacts in both chains with the noncoding DNA strand and these contacts are invariant among NFAT family members. The effect of T222D located in the same DNA-binding loop is drastically different from the impact of mutations described in the previous section. As can be seen from Figures 1 and S3 (Supporting Information), the RMSD deviations from the initial structure are constrained for the T222D mutant complex with DNA for two different MD trajectories; in fact, they are even lower than for the native structure almost everywhere along the simulation time. The T222D mutation makes the overall complex more rigid than native (RMSF is 1.53 ± 0.05 Å and standard deviation is 0.55 Å for mutant compared to 1.75 ± 0.05 Å and standard deviation of 0.58 Å for the native complex; p-value <0.01, Figures 2A and 3B). If we compare individual chains, the loss of flexibility is less pronounced, which points to the reduction in relative movement between the two chains in mutant. While the AB loop does not show a noticeable conformational change, other regions undergo movements which lead to the formation of additional contacts with the DNA molecule (Figure 3A and Table S1 (Supporting Information)). For example, Arg276 on chain C makes a contact with the DNA phosphate backbone upon T222D mutation (Table S1 (Supporting Information)). While the loop 322–332 on chain C is more flexible in the 3M_withDNA system, on the contrary, it becomes more rigid in the T222D_withDNA mutant (Figure 2B). Moreover, a new salt bridge is formed between the substituted T → D222 of chain D and Lys329 of chain C, which restrains the motion between the two monomers; the distance between the side-chain nitrogen of Lys329 and the gamma-oxygen of Thr222 was 11.9 Å in the native structure compared to 2.7 Å between the side-chain nitrogen of Lys329 and the side-chain oxygen of Asp222 in the mutant (Figure 7 and Table S1 (Supporting Information)). All these contacts were conserved between structures corresponding to two MD trajectories (Table S1 (Supporting Information)). Although the overall binding affinity to DNA almost does not change upon this mutation using the MMPBSA method, the binding between chain C and DNA seems to be tighter than that of the native structure (Tables 1 and S3 (Supporting Information)).
Figure 7.

Structural superposition of the native (blue), named “WT” and T222D mutated (red) structures. The mutated residue T222D makes a salt bridge with K329 in the mutant while displaced 11.9 Å away in the native structure.
PCA Analysis
PCA is applied to the backbone atoms in our six models. Figure 4 shows eigenvectors with corresponding eigenvalues. The eigenvalue is calculated as the mean-square fluctuation in the direction of the principal mode, and the largest eigenvalue corresponds to the most dominant collective mode. As can be seen from Figure 4, the first two or three eigenvectors contribute the most to the system motion and eigenvalues decrease in the following order: 3M_noDNA > T222D_noDNA > Native_noDNA > Native_withDNA ∼ 3M_withDNA > T222D_withDNA. Similar to previous observations, DNA binding makes the protein complex more rigid, especially for the T222D mutation. Moreover, mutant complexes without DNA are characterized by higher flexibility than the native complexes without DNA. From comparing the eigenvalues of chains C and D (see Figure S2 (Supporting Information)), it is evident that chain C is more rigid than chain D in the Native_withDNA and especially in the T222D_withDNA systems. For the triple mutant, the situation is contrary and chain C is characterized by more extensive motions than chain D. Projection of trajectories on the first two principal components is shown in Figure 5. As apparent from this figure, complexes without DNA, especially 3M_noDNA and T222D_noDNA, sample much larger conformational space than the NFAT5 complexes with DNA. Furthermore, projections for native and mutant complexes with DNA are quite different from each other and the T222D mutant samples much smaller regions of the conformational space.
Figure 5.
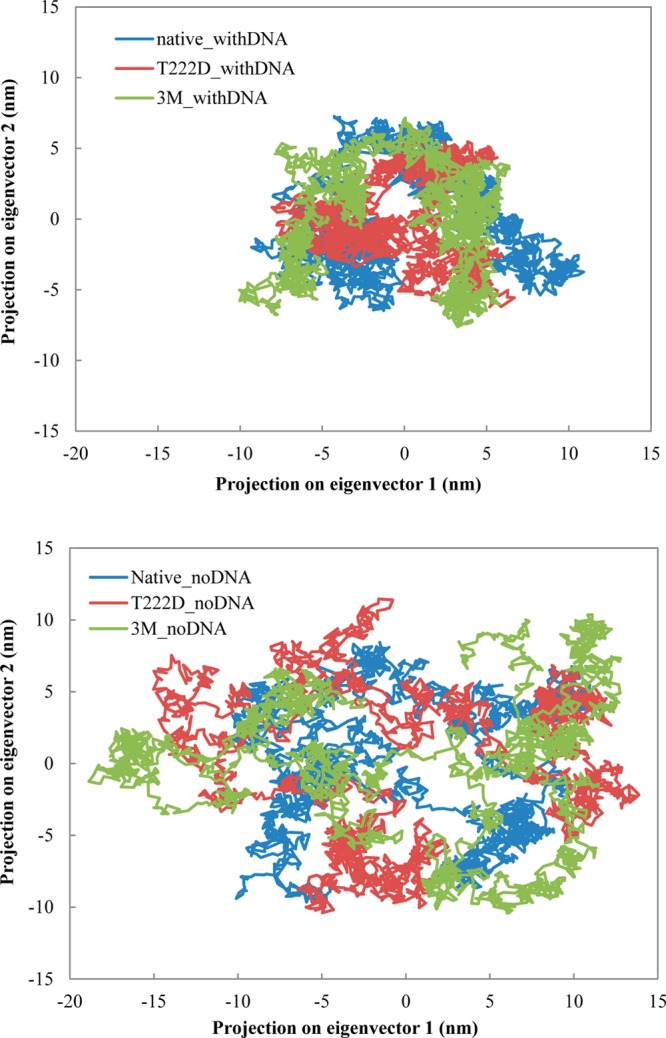
The projection of the first two principal components for all six systems.
Discussion
The specific recognition of DNA sequences by proteins is governed by the formation of hydrogen bonds with specific bases (mostly occurring in the major groove), and by varying the DNA shape and its electrostatic potential (this type of recognition may happen in major as well as minor DNA grooves).33,34 The NFAT5 dimer represents a convenient system to study the difference between specific (maintained by chain C) and less specific or nonspecific DNA binding (maintained by chain D). Structural analysis of the NFAT5 native complex and MD simulations show that the dimer does not significantly change its overall orientation with respect to DNA in specific compared to nonspecific chains, which is consistent with previous experimental results on other DNA-binding proteins.35 The specifically bound chain makes more contacts with DNA, and its binding affinity is found to be higher compared to the nonspecifically bound chain (the energy difference between specific and nonspecific binding is about 2–3 kT). Some of these contacts, coming from the DNA-binding loop and a few other regions, are different between the two chains and therefore may confer binding specificity. Moreover, our results show that the nonspecific chain has a much higher flexibility in the native complex than the specifically bound chain. This can be explained by the extensive sampling of different protein conformations on the DNA surface by the nonspecific chain which might be required before the specific chain binds DNA. Indeed, according to the energy landscape theory of protein–DNA binding, nonspecific protein–DNA complexes might have more rugged energy landscapes, whereas specific complexes can be characterized by the funnel-like energy landscape guiding the search to the native state.35−37 On the other hand, protein flexibility may facilitate binding and provide kinetic advantages via the fly casting mechanism. In the latter scenario, the unfolded flexible chain binds weakly at larger distances and undergoes a disorder-to-order transition as the protein recognizes the DNA through specific binding.37,38
We studied different NFAT5 mutants and found that they had distinctly different effects on specific and nonspecific binding to DNA. The R217A/E223A/R226A mutant was characterized by significantly compromised binding to DNA (by 5–8 kT). This result is consistent with a previous experimental observation of several authors of this paper that these mutations reduce high NaCl-induced nuclear translocation.8 Although all of these mutations were introduced within the same DNA-binding loop on both chains, a different effect on specific and nonspecific chains was obvious. Namely, the triple mutations made the specific chain more flexible with almost no effect on the nonspecifically bound chain. Since the NFAT5 dimer forms a complete circle around the DNA molecule, the loss of specific contacts with DNA by chain C makes the orientation of the mutant dimer more symmetric inside the inner protein ring.
On the contrary, mutation T222D from the same AB loop had a quite different effect. Unlike the three previously mentioned mutations, which enhanced the mobility of the specific chain and decreased the binding to DNA, the T222D mutation made the specific chain/DNA complex less flexible and more tightly bound. The overall effect of this mutation on DNA binding was much less pronounced than the effect of the triple mutations (even if scaled down by the number of mutations). This result points to the possibility that reduced binding to DNA cannot fully explain the reduced nuclear–cytoplasm ratio of NFAT5 reported earlier for T222D.8 T222 is predicted to be phosphorylated by several methods although not yet confirmed by experiments. One might hypothesize that the T222D mutation can prevent the reversible potential phosphorylation which in turn might disrupt the balance between nucleic and cytoplasmic forms of NFAT5. Recently, an energy landscape approach was used to model the effect of multiple phosphorylation in the NFAT1 protein regulatory region.39 The authors showed that phosphorylation increased the helical propensity and rigidified the structure of the phospho-peptides similar to the effect of the T222D mutation studied here. It was suggested that the cytoplasmic form of NFAT1 needed a well-defined structure to perform its function, while the more flexible regulatory region was characteristic for the nuclear form. Further experimental characterization is needed of residue 222’s effect on NFAT5 dynamics and binding.
Overall, the decreased binding of the NFAT5 dimer to DNA for triple mutant might explain its reduced nuclear localization reported earlier.8 However, it was proposed recently that NFAT5 dimerization might be required for the nuclear transport, whereas DNA binding might not.40 We observed a higher flexibility of mutant dimers compared to native dimers without DNA. In addition, our binding energy calculations point to the marginal stability of dimers in the absence of DNA, with the predicted dissociation constant in the mM range. Our results allow us to conclude that DNA binding considerably stabilizes the dimer complex and certain mutations may destabilize the binding to DNA. All of this appears to contribute to the mechanism of nuclear–cytoplasm transport.
Acknowledgments
We thank Hafumi Nishi for help during the initial stage of this project. This work was supported by the Intramural Research Program of the National Library of Medicine and Intramural Research Program of the National Heart, Lung, and Blood Institute at the U.S. National Institutes of Health.
Supporting Information Available
Table S1: List of contacts between protein and DNA, between different protein chains. “C” and “D” stand for protein chains C and D; “A” and “B” stand for DNA strands A and B. NFAT5 contacting residues found in both MD trajectories are shown in red color. Table S2: Binding energy difference between mutant and native structures for protein–DNA interactions calculated using FoldX. Positive values correspond to decreased protein–DNA binding. “T222-phospho” stands for phosphorylated T222 residue. Table S3: Binding energy between protein and DNA for the second MD trajectory (in kcal/mol). Figure S1: RMSF values for different systems with and without DNA. Figure S2: Eigenvalues for all six systems plotted for each eigenvector index for chains C and D separately. Figure S3: Backbone RMSD for the second MD trajectory. Figure S4: (A) The number of contacts (hydrogen bonds and salt bridges) between the protein complex and DNA, chain C and DNA, and chain D and DNA for the second MD trajectory. (B) Mean values and 95% confidence intervals (error bars) of RMSF for the second MD trajectory. For “complex”, the alignment is based on the whole protein complex, and for “chain C” and “chain D”, the alignments are performed separately for each chain. Figure S5: (A) Eigenvalues for the second MD trajectory plotted for each eigenvector index. (B) The projection of the first two principal components for the second MD trajectory. This material is available free of charge via the Internet at http://pubs.acs.org.
The authors declare no competing financial interest.
Author Present Address
§ Enterprise Science and Computing, 155 Gibbs Street, Suite 420, Rockville, MD 20850.
Funding Statement
National Institutes of Health, United States
Supplementary Material
References
- Burg M. B.; Ferraris J. D.; Dmitrieva N. I. Cellular Response to Hyperosmotic Stresses. Physiol. Rev. 2007, 87, 1441–1474. [DOI] [PubMed] [Google Scholar]
- Chen M.; Sinha M.; Luxon B. A.; Bresnick A. R.; O’Connor K. L. Integrin Alpha6beta4 Controls the Expression of Genes Associated with Cell Motility, Invasion, and Metastasis, Including S100a4/Metastasin. J. Biol. Chem. 2009, 284, 1484–1494. [DOI] [PMC free article] [PubMed] [Google Scholar]
- Halterman J. A.; Kwon H. M.; Zargham R.; Bortz P. D.; Wamhoff B. R. Nuclear Factor of Activated T Cells 5 Regulates Vascular Smooth Muscle Cell Phenotypic Modulation. Arterioscler., Thromb., Vasc. Biol. 2011, 31, 2287–2296. [DOI] [PMC free article] [PubMed] [Google Scholar]
- Lopez-Rodriguez C.; Aramburu J.; Jin L.; Rakeman A. S.; Michino M.; Rao A. Bridging the Nfat and Nf-Kappab Families: Nfat5 Dimerization Regulates Cytokine Gene Transcription in Response to Osmotic Stress. Immunity 2001, 15, 47–58. [DOI] [PubMed] [Google Scholar]
- Stroud J. C.; Lopez-Rodriguez C.; Rao A.; Chen L. Structure of a Tonebp-DNA Complex Reveals DNA Encircled by a Transcription Factor. Nat. Struct. Biol. 2002, 9, 90–94. [DOI] [PubMed] [Google Scholar]
- Marchler-Bauer A.; Lu S.; Anderson J. B.; Chitsaz F.; Derbyshire M. K.; DeWeese-Scott C.; Fong J. H.; Geer L. Y.; Geer R. C.; Gonzales N. R. Cdd: A Conserved Domain Database for the Functional Annotation of Proteins. Nucleic Acids Res. 2011, 39, D225–229. [DOI] [PMC free article] [PubMed] [Google Scholar]
- Tong E. H.; Guo J. J.; Huang A. L.; Liu H.; Hu C. D.; Chung S. S.; Ko B. C. Regulation of Nucleocytoplasmic Trafficking of Transcription Factor Orebp/Tonebp/Nfat5. J. Biol. Chem. 2006, 281, 23870–23879. [DOI] [PubMed] [Google Scholar]
- Izumi Y.; Li J.; Villers C.; Hashimoto K.; Burg M. B.; Ferraris J. D. Mutations That Reduce Its Specific DNA Binding Inhibit High Nacl-Induced Nuclear Localization of the Osmoprotective Transcription Factor Nfat5. Am. J. Physiol.: Cell Physiol. 2012, 303, C1061–1069. [DOI] [PMC free article] [PubMed] [Google Scholar]
- Humphrey W.; Dalke A.; Schulten K. Vmd: Visual Molecular Dynamics. J. Mol. Graphics 1996, 1433–3827–38. [DOI] [PubMed] [Google Scholar]
- Bertonati C.; Honig B.; Alexov E. Poisson-Boltzmann Calculations of Nonspecific Salt Effects on Protein-Protein Binding Free Energies. Biophys. J. 2007, 92, 1891–1899. [DOI] [PMC free article] [PubMed] [Google Scholar]
- Martyna G. J.; Hughes A.; Tuckerman M. E. Molecular Dynamics Algorithms for Path Integrals at Constant Pressure. J. Chem. Phys. 1999, 110, 3275–3291. [Google Scholar]
- Deserno M.; Holm C. How to Mesh up Ewald Sums. I. A Theoretical and Numerical Comparison of Various Particle Mesh Routines. J. Chem. Phys. 1998, 109, 7678–7694. [Google Scholar]
- Hoover W. G. Canonical Dynamics: Equilibrium Phase-Space Distributions. Phys. Rev. A 1985, 31, 1695–1697. [DOI] [PubMed] [Google Scholar]
- Phillips J. C.; Braun R.; Wang W.; Gumbart J.; Tajkhorshid E.; Villa E.; Chipot C.; Skeel R. D.; Kale L.; Schulten K. Scalable Molecular Dynamics with Namd. J. Comput. Chem. 2005, 26, 1781–1802. [DOI] [PMC free article] [PubMed] [Google Scholar]
- MacKerrell A. D. J.; Bashford D.; Dunbrack R. L. J.; Evanseck J. D.; Field M. J.; Fischer S.; Gao J.; Guo H.; Ha S.; Joseph-McCarthy D. All-Atom Empirical Potential for Molecular Modeling and Dynamics Studies of Proteins. J. Phys. Chem. B 1998, 102, 3586–3616. [DOI] [PubMed] [Google Scholar]
- Foloppe N.; MacKerell A. D. J. All-Atom Empirical Force Field for Nucleic Acids: I. Parameter Optimization Based on Small Molecule and Condensed Phase Macromolecular Target Data. J. Comput. Chem. 2000, 21, 86–104. [Google Scholar]
- Amadei A.; Linssen A. B.; Berendsen H. J. Essential Dynamics of Proteins. Proteins 1993, 17, 412–425. [DOI] [PubMed] [Google Scholar]
- Li M. H.; Luo Q.; Li Z. S. Molecular Dynamics Study on the Interactions of Porphyrin with Two Antiparallel Human Telomeric Quadruplexes. J. Phys. Chem. B 2010, 114, 6216–6224. [DOI] [PubMed] [Google Scholar]
- Russell S. T.; Warshel A. Calculations of Electrostatic Energies in Proteins. The Energetics of Ionized Groups in Bovine Pancreatic Trypsin Inhibitor. J. Mol. Biol. 1985, 185, 389–404. [DOI] [PubMed] [Google Scholar]
- Jo S.; Vargyas M.; Vasko-Szedlar J.; Roux B.; Im W. Pbeq-Solver for Online Visualization of Electrostatic Potential of Biomolecules. Nucleic Acids Res. 2008, 36, W270–275. [DOI] [PMC free article] [PubMed] [Google Scholar]
- Massova I.; P.A. K. Combined Molecular Mechanical and Continuum Solvent Approach (Mm-Pbsa/Gbsa) to Predict Ligand Binding. Perspect. Drug Discovery Des. 2000, 18, 113–135. [Google Scholar]
- Spassov V. Z.; Yan L. Ph-Selective Mutagenesis of Protein-Protein Interfaces: In Silico Design of Therapeutic Antibodies with Prolonged Half-Life. Proteins 2013, 81, 704–714. [DOI] [PMC free article] [PubMed] [Google Scholar]
- Olson M. A.; Reinke L. T. Modeling Implicit Reorganization in Continuum Descriptions of Protein-Protein Interactions. Proteins 2000, 38, 115–119. [DOI] [PubMed] [Google Scholar]
- Li M.; Zheng W. Probing the Structural and Energetic Basis of Kinesin-Microtubule Binding Using Computational Alanine-Scanning Mutagenesis. Biochemistry 2011, 50, 8645–8655. [DOI] [PubMed] [Google Scholar]
- Nina M.; Beglov D.; Roux B. Atomic Radii for Continuum Electrostatics Calculations Based on Molecular Dynamics Free Energy Simulations. J. Phys. Chem. B 1997, 101, 5239–5248. [Google Scholar]
- Brooks B. R.; Bruccoleri R. E.; Olafson B. D.; States D. J.; Swaminathan S.; Karplus M. Charmm: A Program for Macromolecular Energy, Minimization, and Dynamics Calculations. J. Comput. Chem. 1983, 4, 187–217. [Google Scholar]
- Guerois R.; Nielsen J. E.; Serrano L. Predicting Changes in the Stability of Proteins and Protein Complexes: A Study of More Than 1000 Mutations. J. Mol. Biol. 2002, 320, 369–387. [DOI] [PubMed] [Google Scholar]
- Shoemaker B. A.; Zhang D.; Tyagi M.; Thangudu R. R.; Fong J. H.; Marchler-Bauer A.; Bryant S. H.; Madej T.; Panchenko A. R. Ibis (Inferred Biomolecular Interaction Server) Reports, Predicts and Integrates Multiple Types of Conserved Interactions for Proteins. Nucleic Acids Res. 2012, 40, D834–840. [DOI] [PMC free article] [PubMed] [Google Scholar]
- Obenauer J. C.; Cantley L. C.; Yaffe M. B. Scansite 2.0: Proteome-Wide Prediction of Cell Signaling Interactions Using Short Sequence Motifs. Nucleic Acids Res. 2003, 31, 3635–3641. [DOI] [PMC free article] [PubMed] [Google Scholar]
- Wong Y. H.; Lee T. Y.; Liang H. K.; Huang C. M.; Wang T. Y.; Yang Y. H.; Chu C. H.; Huang H. D.; Ko M. T.; Hwang J. K. Kinasephos 2.0: A Web Server for Identifying Protein Kinase-Specific Phosphorylation Sites Based on Sequences and Coupling Patterns. Nucleic Acids Res. 2007, 35, W588–594. [DOI] [PMC free article] [PubMed] [Google Scholar]
- Xue Y.; Liu Z.; Cao J.; Ma Q.; Gao X.; Wang Q.; Jin C.; Zhou Y.; Wen L.; Ren J. Gps 2.1: Enhanced Prediction of Kinase-Specific Phosphorylation Sites with an Algorithm of Motif Length Selection. Protein Eng., Des. Sel. 2011, 24, 255–260. [DOI] [PubMed] [Google Scholar]
- Iakoucheva L. M.; Radivojac P.; Brown C. J.; O’Connor T. R.; Sikes J. G.; Obradovic Z.; Dunker A. K. The Importance of Intrinsic Disorder for Protein Phosphorylation. Nucleic Acids Res. 2004, 32, 1037–1049. [DOI] [PMC free article] [PubMed] [Google Scholar]
- Rohs R.; West S. M.; Sosinsky A.; Liu P.; Mann R. S.; Honig B. The Role of DNA Shape in Protein-DNA Recognition. Nature 2009, 461, 1248–1253. [DOI] [PMC free article] [PubMed] [Google Scholar]
- Chirgadze Y. N.; Sivozhelezov V. S.; Polozov R. V.; Stepanenko V. A.; Ivanov V. V. Recognition Rules for Binding of Homeodomains to Operator DNA. J. Biomol. Struct. Dyn. 2012, 29, 715–731. [DOI] [PubMed] [Google Scholar]
- Kalodimos C. G.; Biris N.; Bonvin A. M.; Levandoski M. M.; Guennuegues M.; Boelens R.; Kaptein R. Structure and Flexibility Adaptation in Nonspecific and Specific Protein-DNA Complexes. Science 2004, 305, 386–389. [DOI] [PubMed] [Google Scholar]
- Bryngelson J. D.; Onuchic J. N.; Socci N. D.; Wolynes P. G. Funnels, Pathways, and the Energy Landscape of Protein Folding: A Synthesis. Proteins 1995, 21, 167–195. [DOI] [PubMed] [Google Scholar]
- Levy Y.; Onuchic J. N.; Wolynes P. G. Fly-Casting in Protein-DNA Binding: Frustration between Protein Folding and Electrostatics Facilitates Target Recognition. J. Am. Chem. Soc. 2007, 129, 738–739. [DOI] [PubMed] [Google Scholar]
- Shoemaker B. A.; Portman J. J.; Wolynes P. G. Speeding Molecular Recognition by Using the Folding Funnel: The Fly-Casting Mechanism. Proc. Natl. Acad. Sci. U.S.A. 2000, 97, 8868–8873. [DOI] [PMC free article] [PubMed] [Google Scholar]
- Shen T.; Zong C.; Hamelberg D.; McCammon J. A.; Wolynes P. G. The Folding Energy Landscape and Phosphorylation: Modeling the Conformational Switch of the Nfat Regulatory Domain. FASEB J. 2005, 19, 1389–1395. [DOI] [PubMed] [Google Scholar]
- Kwon M. S.; Lee S. D.; Kim J. A.; Colla E.; Choi Y. J.; Suh P. G.; Kwon H. M. Novel Nuclear Localization Signal Regulated by Ambient Tonicity in Vertebrates. J. Biol. Chem. 2008, 283, 22400–22409. [DOI] [PMC free article] [PubMed] [Google Scholar]
Associated Data
This section collects any data citations, data availability statements, or supplementary materials included in this article.