Abstract
Quantitative analysis of site-specific glycosylation of proteins is a challenging part of glycoproteomic research. Multiple enrichment steps are typically required in the analytical workflows to achieve adequate characterization of the site specific glycoforms. In spite of recent advances, quantitative workflows need further development. Here we report a selective and sensitive MRM3 mass spectrometric method for direct analysis of O-glycopeptides in difficult matrix such as serum. Method optimization was performed using two serum glycoproteins, hemopexin (HPX) and sex hormone binding globulin (SHBG). With the optimized MS3 workflow, we were able to analyze major glycoforms of HPX directly in human serum. Quantification of the minor glycoforms of HPX and glycoforms of SHBG required enrichment of the protein because these analytes were below the sensitivity of the 4000 QTRAP in the complex serum background. In conclusion, we present a quantitative method for site-specific analysis of O-glycosylation with general applicability to mucin-type glycoproteins. Our results document reliable application of the optimized MRM3 workflow to the relative quantification of O-glycosylation microheterogeneity of HPX in human serum. Introduction of isotopically labeled standards would be desirable to achieve absolute quantification of the analytes. The possibility to analyze serum samples directly represents a significant improvement of the quantitative glycopeptide workflows with the potential for use in clinical applications.
1 Introduction
Glycosylation is a common protein modification growing in its impact on physiology with the complexity of the organism [1]. N- and mucin type O- glycosylation of proteins, two types of glycoconjugates studied extensively in the disease context, are co/post-translational processes carried out in the endoplasmic reticulum and Golgi compartments by a complex enzymatic machinery [2]. Many enzymes in the glycosylation pathways orchestrate the site-specific addition of various glycans to proteins and studies of the impact of glycosylation on protein function have rapidly grown in recent years [3, 4]. Aberrations in the glycosylation pathways have been associated with multiple diseases, including cancer and inflammatory diseases [5, 6]. In addition, determination of protein glycoforms can be important for functional characterization of a growing number of biopharmaceuticals [7]. While the micro-heterogeneity of glycoforms provides important clues to protein function, it presents substantial analytical challenges [8, 9]. This is one of the reasons why analytical methods for quantification of changes in site-specific protein glycoforms are not developed to a degree comparable with their projected impact on human biology.
N-glycoforms of proteins are more extensively studied thanks to the use of enzyme PNGase F which releases N-linked glycans comprehensively from the protein/peptide backbone [10]. Because enzymes comprehensively releasing O-glycans from proteins are not available, analysis of O-linked glycans relies on chemical methods of cleavage [11]. (Non)-reductive beta-eliminations are the most common approaches to release the O-linked glycans but the lesser degree of standardization of these methods is a source of higher measurement variability compared to the enzymatic N-glycan release [12, 11]. These analytical challenges limit quantitative studies of site-specific O-glycoforms even though the mucin–type O-glycosylation received considerable attention especially in the context of cancer diseases [5] [13]. Mucins dominate the surface of cancer cells; changes in their glycoforms have profound impact on the biology of cancer cells [14, 15]. These important changes in protein O-glycoforms are typically measured by immunoaffinity reagents, when available, or by descriptive mass spectrometric methods [5, 16], [17]. In this paper, we present an LC-MS-MRM workflow intended to improve the quantitative comparison of O-glycopeptides in biologically relevant conditions.
2 Materials and Methods
2.1 Isolation of hemopexin from human serum
Hemopexin (HPX) was purified from human serum according to a previously described method [18] with some modifications. Briefly, 200 μl of hemin-agarose suspension (Sigma-Aldrich, St. Louis, MO) was loaded on a Pierce spin column (Thermo Scientific, Rockford, IL) and washed three times with 500 μl of PBS, pH 7.4. One hundred microliters of serum was diluted five times with PBS, loaded onto a hemin-agarose column and incubated overnight at 4°C with continuous end-to-end rotation. The flow-through was discarded and the column was subsequently washed ten times at room temperature with 500 μl PBS containing 0.5 M NaCl. HPX was eluted with 3 x 300 μl 0.2 M citric acid, pH 2.0 followed by immediate neutralization with 200 μl of 1 M Tris-HCl, pH 9.5. All three elutions were combined, concentrated in a vacuum concentrator (SpeedVac, Savant Instruments, Farmingdale, NY) to a final volume of approximately 300 μl and separated by reversed phase C18 chromatography using an Agilent 1100 Series HPLC system (Agilent Technologies, Santa Clara, CA). We used mRP Hi-Recovery Protein 4.6 X 50mm C18 column (Agilent Technologies) heated to 40°C at a flow rate of 0.5 ml/min. The concentrated eluate from hemin-agarose was injected in solvent A (2% ACN, 0.1% TFA) and separation of HPX was achieved by a linear gradient of solvent B (98% ACN, 0.08% TFA) from 35–45% in 35 min. The chromatogram was monitored at 214 nm and the area of the peak corresponding to HPX was used to estimate the protein quantity by comparison to human HPX standard (H9291, Sigma-Aldrich) of known concentration. The yield of HPX using this procedure was 20–25 μg per 100 μl of serum. The eluate corresponding to the HPX peak was collected, dried in a vacuum concentrator, and stored at −80°C for further analysis [18].
2.3 Analysis of O-glycopeptides
HPX and sex hormone binding globulin (SHBG) (10-789-430068, Genway Biotech, San Diego, CA) was analyzed as described previously with some modifications [19]. Briefly, 2 μg of HPX standard was reduced with 5 mM DTT for 60 min at 60°C, alkylated with 15 mM iodoacetamide (IAA) for 30 min in the dark, excess IAA was quenched with 5mM DTT and dried. The dried reaction mixture was dissolved in 50mM NH4HCO3 containing 0.05% RapiGest (Waters, Milford, MA) and digested 60 mins with Trypsin Gold (Promega, Madison, WI, 1:20 wt:wt) using Barocycler NEP2320 (Pressure BioSciences, South Easton, MA) at 37°C. The tryptic digest was analyzed using an LC-MS/MS workflow with Q-TOF mass spectrometric detection. The workflow for the analysis of SHBG was identical except chymotrypsin (Thermo Scientific) was used to prepare the digest at 50°C for 90 mins. Glycopeptide identification was achieved by RP chromatography (Tempo Capillary Chromatography, Eksigent, Framingham, MA) on Symmetry C18 (3μm, 180μm, 20mm) trap column (Waters) and Acclaim Pepmap C18, 300Å, 3μm, 150mm x 0.75μm capillary column (Dionex, Sunnyvale, CA) interfaced with a 5600 TripleTOF mass spectrometer (AB Sciex, Framingham, MA). Tryptic/chymotryptic digest was separated with a 3 min trapping/washing step using 2% ACN, 0.1% formic acid at a 15 μl/min flow rate followed by a 60 min elution gradient of 0.1% formic acid in ACN. For all runs, we have injected 1 μl (cca 2 pmols) of sample directly after enzymatic digestion. Analysis used an Information Dependent Acquisition workflow with one full scan (400–1800 m/z) followed by three MS/MS fragmentation experiments of major multiply-charged precursor ions with collision energy 35eV. Mass spectra were recorded with accuracy up to 2ppm in high resolution mode. The experimental parameters were set as follows: declustering potential 80V, curtain gas 15, ion spray voltage 2400V, ion source gas1 20, interface heater 180°C, entrance potential 10V, collision exit potential 10V. Glycoforms of the SHBG and HPX O-glycopeptides were identified based on their precursor mass, characteristic oxonium ions, and fragments of the peptide backbone.
2.4 MS2 collision energy optimization
Tryptic and chymotryptic digests (2 pmoles on column) of HPX and SHBG, respectively, were used for optimization of the MS2 fragmentation. Optimization of collision energy was achieved by RP chromatography (NanoAcquity, Waters) on a Symmetry C18 (3um, 180um, 20mm) trap column and UPLC capillary column (BEH 300Å, 1.7um, 150mm x 0.75um) (Waters) interfaced with a 4000 Q-TRAP mass analyzer (AB Sciex). Glycopeptides were separated by a 3 minute trapping/washing step using 2% ACN, 0.1% formic acid at a 15 μl/min flow rate followed by a 40 min elution gradient of 0.1% formic acid in ACN at a flow of 0.4 μl/min. The gradient was set as follows: 3% ACN, 0.1% formic acid 0–5 min; 3–50% ACN, 0.1% formic acid 5–30 min; 50–98% ACN, 0.1% formic acid 30–35 min; 98% ACN, 0.1% formic acid 35–40 min. The multiple reaction monitoring (MRM) workflow was used for optimization of all collision energies in one run. Transition list used for optimization of MS2 fragmentation was created using MS EXCEL. All collision energies were optimized to achieve the highest intensity of the glycopeptide fragment consisting of the multiply charged whole peptide backbone fragment, HPX 905.8 (3+) and SHBG 612.3 (2+) respectively.
2.5 MS3 method optimization
MS2 and MS3 (LIT) fragmentations were optimized by injection of 1 pmole of the tryptic digest of HPX standard on column. Optimized parameters from the MS2 were used for optimization of MS3 (LIT) collision energy under the same chromatographic conditions as described above. MS3 full scan mode was used as the first step to obtain the MS3 fragmentation spectra. Three ions were chosen for analysis and collision energy was optimized in LIT for maximum intensity of selective peptide fragment ions with 3Da width, y61+ 716.3, y233+ 802.05, b222+ 1000.5 for HPX and y61+633.4, b152+783.9 and b91+950.6 for SHBG. We have chosen collision energy for each glycopeptide with the maximum intensity of the sum of all three fragment ions. All parameters were tested for selectivity and sensitivity in full MS3 spectra and for focused detection of specific MS3 fragments from MS2 precursor/fragment ions. MS3 mass spectrometry methods were optimized as single methods for analysis of each O-glycopeptide, and included MRM of normalization peptides using three major fragments as the transitions for each. (GGYTLVSGYPK, SGAQATWTELPWPHEK in the case of HPX and NLRDIPQPHAEPW, LDKQAEISASAPTin the case of SHBG).
2.6 Glycopeptide quantification in a complex matrix
Human serum (0.2μl) was diluted in 20μl of 25mM NH4HCO3 with 0.1% RapiGest (Waters), reduced by 5mM DTT for one hour at 60°C, and alkylated with 15mM IAA for 20 mins at room temperature in the dark and excess IAA was neutralized with 5mM DTT. The samples were digested with 0.2 μg of Trypsin Gold for MS (Promega) for 60 mins at 37°C or 0.5 μg of Chymotrypsin (ThermoScientific) using barocycler (Pressure BioSciences) for 90 mins at 50°C. Separation of glycopeptides in the digest was achieved by using a 60 min gradient elution with ACN containing 0.1% formic acid (B) starting from 2%ACN with 0.1% formic acid (A) (0–3min 98% A, 3–25min 98–50%A, 25–29min 50–10%A, 29–33min 10%A, 33–33.5min 10–98%A, 33.5–60min 98%A). Samples were measured in duplicates and data analysis was carried out using MultiQuant software 2.0 (AB Sciex). Results were exported as text files for data normalization using MS EXCEL software. Quantitative results represent average of normalized duplicate measurements.
3 RESULTS AND DISCUSSION
3.1 Fragmentation of HPX and SHBG O-glycopeptides
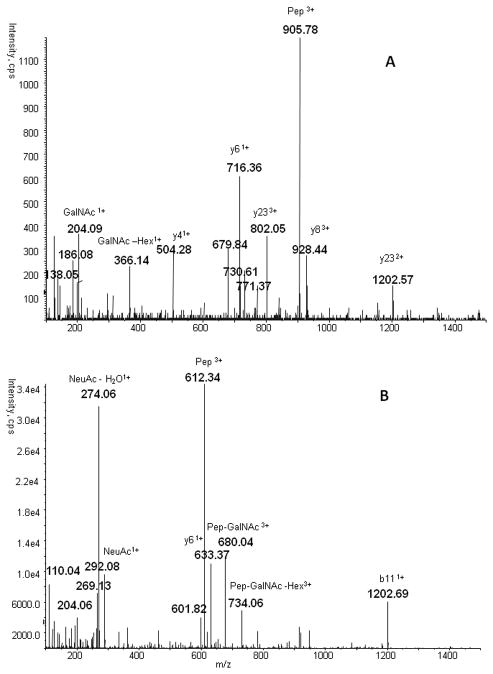
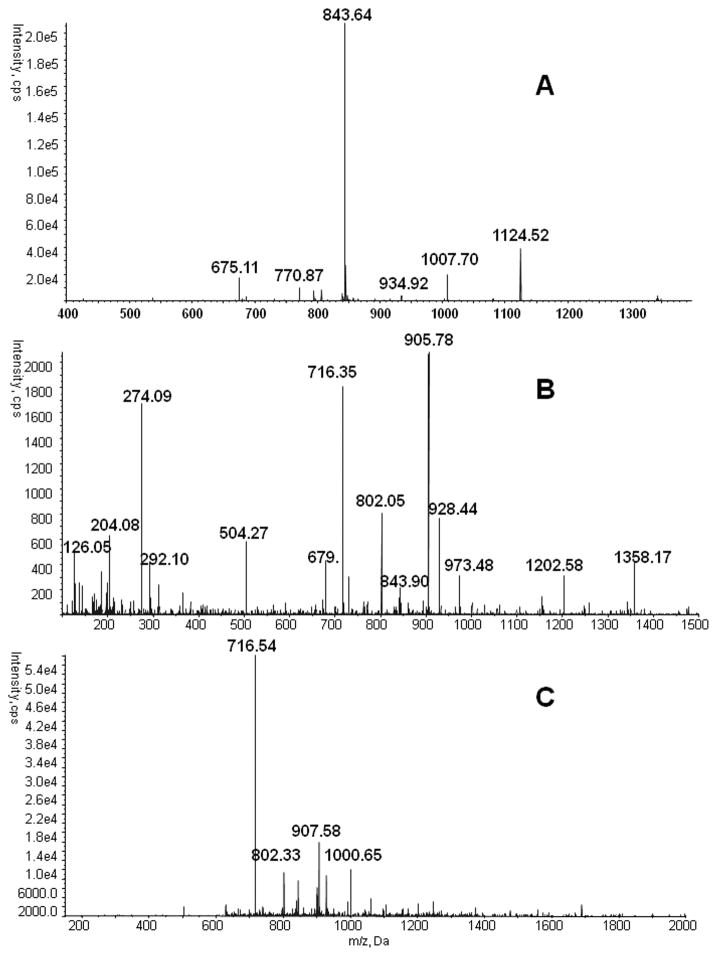
We have selected for analysis seven O-glycoforms of the TPLPPTSAHGNVAEGETKPDPDVTER tryptic peptide of HPX and two dominant O-glycoforms of the RPVLPTQSAHDPPAVHL chymotryptic peptide of SHBG (Table 1). These peptides were selected based on previously published results [20] and additional analysis of the SHBG and HPX on the 5600 QTOF. Presence of these glycoforms was verified manually on the basis of glycopeptide precursor mass, the presence of characteristic oxonium ion fragments, as well as b and y peptide fragment ions. A typical spectrum of HPX glycoform Neu5Ac-Hex- GalNAc and SHBG glycoform Neu5Ac-Hex-GalNAc is presented in Figure 1. The MS2 fragmentation spectra on the 5600 Triple TOF mass spectrometer were acquired using the default collision energy of 35eV. The spectra show that, contrary to complex N-glycopeptides, the fragmentation of O-glycopeptides produces well detectable fragments of the peptide backbone and contains the de-glycosylated peptide as a major fragment. This fragment was selected for MS3 fragmentation in the LIT of the Q-TRAP mass analyzer using default MS2 collision energy of 100eV (Figure 2).
Table 1.
List of glycopeptide of HPX and SHBG used for optimization of the MS3 analytical method including selected masses of the precursor and fragment ions.
| Table of MS2/MS3 transition | ||||
|---|---|---|---|---|
| O glycoprotein | Glycan | MS2 Precursor ions/charge state | MS3 Precursor ions | MS3 fragment ions |
| HPX | GalNAc | 973.1/3 | 905.8 | 716.3, 802.1, 1000.5 |
| Hex-GalNAc | 770.6/4 | 905.8 | 716.3, 802.1, 1000.5 | |
| Neu5Ac-Hex-GalNAc | 843.7/4 | 905.8 | 716.3, 802.1, 1000.5 | |
| 2Neu5Ac-HexNAc-2Hex-GalNAc | 1007.7/4 | 905.8 | 716.3, 802.1, 1000.5 | |
| 3Neu5Ac-HexNAc-2Hex-GalNAc | 1080.5/4 | 905.8 | 716.3, 802.1, 1000.5 | |
| Neu5Ac-HexNAc-2Hex-GalNAc | 934.9/4 | 905.8 | 716.3, 802.1, 1000.5 | |
| 3Neu5Ac-2HexNAc-3Hex-GalNAc | 937.6/5 | 905.8 | 716.3, 802.1, 1000.5 | |
| SHBG | Neu5Ac-Hex-GalNAc | 623.6/4 | 612.3 | 633.4,784.1,950.6 |
| 2Neu5Ac-Hex-GalNAc | 696.4/4 | 612.3 | 633.4,784.1,950.6 | |
Figure 1.
Typical MS2 spectra of O-glycopeptides: A. MS2 spectrum of HPX glycopeptide Hex-GalNAc (m/z 770.8, +4) with dominant de-glycosylated peptide fragment ion (m/z 906.12, +3) and subdominant y and b peptide fragment ions; B. MS2 spectrum of SHBG glycopeptide Neu5Ac-Hex-GalNAc (m/z 623.4, +3) with dominant de-glycosylated peptide fragment ion (m/z 612.3, +2), neuraminic acid oxonium ion (m/z 274.06), subdominant peptide fragment ion and peptide-attached glycan fragment ions.
Figure 2.
CID and LIT fragmentation of the Neu5Ac-Hex-GalNAc O-glycopeptide of HPX: A. MS1 spectrum of O-glycopeptide precursor ions of tryptic HPX digest; B. MS2 CID spectrum of major glycoform NeuAc-Hex-GalNAc (m/z 843.7, +4) with major de-glycosylated peptide ion (905.8) and peptide fragment ions (716.3 and 802.1); C. MS3 LIT spectrum of the de-glycosylated fragment (m/z 905.8, +3) with dominant and subdominant specific peptide fragmentsused for quantification.
3.2 Optimization of collision energy in MS/MS (MRM) and LIT
Because of its favorable intensity and larger number of quantifiable LIT fragments, we have selected the above de-glycosylated peptide fragment as our target for MS2 collision energy optimization. We have used an MRM workflow for the optimization. The optimized collision energy for different precursor masses of HPX shows a linear trend summarized by the equation CE = 0.0685 * (m/z) – 21.557 (Figure 3). This equation was used to predict optimal collision energy for the fragmentation of SHBG glycopeptides. We have found the optimum at 23 eV for 623m/z which is within 2eV of the predicted value of 21 eV. This equation should be generally applicable to the prediction of optimal O-glycopeptide collision energies on the Q-Trap mass analyzers.
Figure 3.
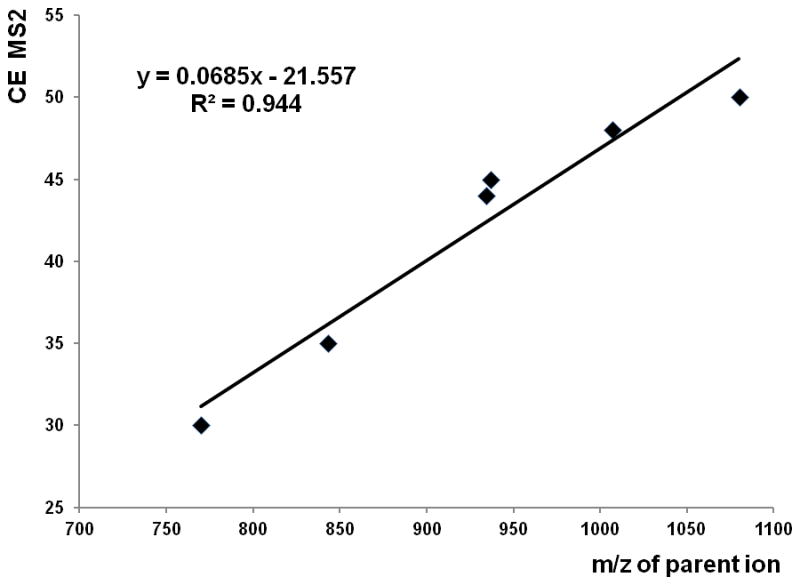
Optimized MS2 collision energies of HPX O-glycopeptides with linear equation for prediction of collision energy based on precursor mass.
MS3 collision energy in the LIT was optimized for maximum intensity of 3 major HPX fragment ions of the peptide backbone (Figure 4). Fragment 907.58 was excluded because of the proximity to the precursor mass. Maximum intensity of the sum of these fragment ions was used as the optimization criterion, independent of the precursor intensity in product spectra; all the monitored ions are greater than 1/3 m/z of the precursor due to the cutoff of the ion trap. This workflow allows MRM3 monitoring of three fragments for each of seven glycopeptides of hemopexin plus MRM quantification of two normalization peptides (three transitions each) with at least 7 points per peak in one chromatographic run.
Figure 4.
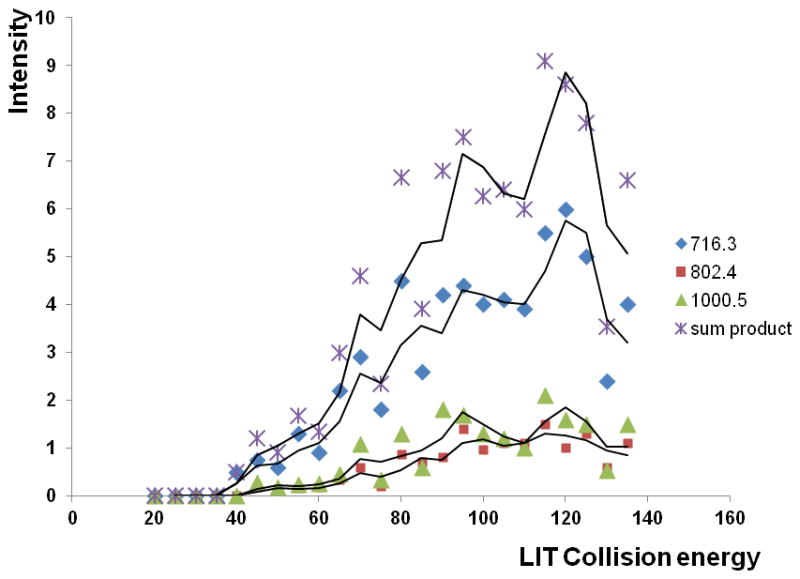
Optimized MS3 LIT collision energies of the HPX O-glycopeptide de-glycosylated by MS2 fragmentation. Intensity of the sum of the de-glycosylated peptide MS3 fragments (716.3, 802.1, 1000.7) was used for quantification.
3.3 Comparison of full scan from MS2 and MS3
MS2 fragmentation is commonly used for MRM quantification of proteins, including quantification in complex mixtures [21]. The broad dynamic range of protein concentrations typical in biological samples, serum in particular, limits the applicability of MRM methods to low concentration analytes. This limitation was addressed by enrichment strategies using multidimensional fractionation or immunoafinity enrichment [22, 23]. As a simpler alternative, the MRM3 workflow was shown to be more selective and more sensitive compared to MRM in the case of peptides in complex background [24]. Prostate specific antigen (PSA) was quantified using the MRM3 method in serum with a limit of detection of 1.5 ng/ml; this workflow included mixed mode cation exchange enrichment on a solid-phase cartridge [24]. MS3 ion trap mass spectrometry was used for structural analysis of O-glycopeptides by several groups [25, 26]. The O-glycopeptide fragmentation was elegantly summarized in recent reviews [11] but we are not aware of any MRM3 applications for O-glycopeptide quantification. Our analysis confirms that the series of b and y fragment ions of the peptide backbone is typically quantifiable in the MS2 spectra of O-glycopeptides (Figures 1 and 2). Because the optimized fragmentation generates de-glycosylated peptide as the major product ion in the MS2, we have also explored the option to proceed with the MS3 fragmentation in the Q-trap which is expected to improve sensitivity and specificity of detection in the complex background [27]. This expectation was evaluated in our MRM and MRM3 quantification of the O-glycopeptidesof HPX in human serum (see below).
3.4 Comparison of MRM and MRM3 workflow in human serum
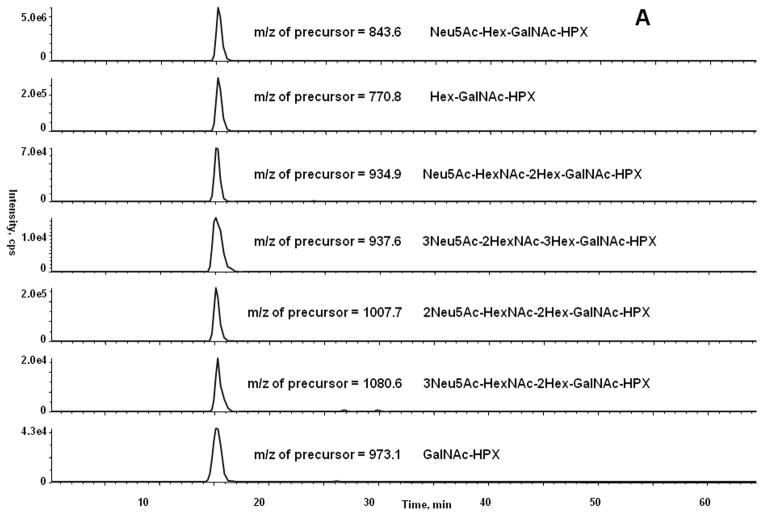
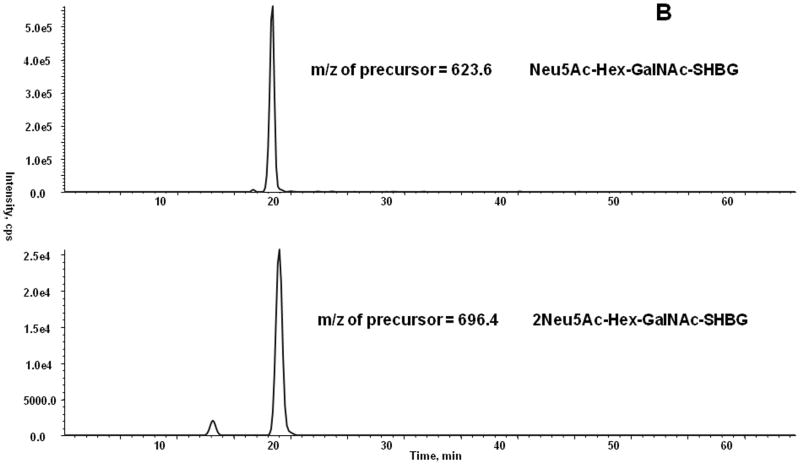
We have compared the methods for quantification of HPX in either unfractionated serum or using HPX isolated from serum as described in methods. The O-glycopeptides of HPX were quantified in serum of 4 healthy volunteers. We have determined by the analysis of the major glycoforms of HPX isolated from serum that the response is linear over 3 logs of HPX concentration. The limit of detection or quantification for all glycoforms cannot be accurately determined because we do not have synthetic isotopically labeled standards of the microheterogeneous peptide glycoforms. The isotopic standards would be useful for the determination of absolute concentration of the glycopeptide; however, we can estimate, based on the XIC of the precursor glycopeptide ion of the major O-glycoform of HPX (Neu5Ac-Hex-GalNAc), that its proportion is higher than 80%. We have estimated the detection limit as 3 times the value of signal intensity of a blank (y-intercept) determined from a “calibration curve” consisting of injection of 5 HPX concentrations; this was done by addition of different amounts of isolated HPX to human serum. Our results show that limit of detection for the major HPX O-glycopeptide in human serum, as measured by the MRM3 workflow, is approximately 3 ng/μl. Sensitivity of the workflow for quantification of O-glycopeptides is therefore comparable to the sensitivity of the previously reported MRM3 workflow for the detection of peptides [24]. Using the optimized MRM3 workflow, we have quantified seven glycoforms of HPX (Figure 5a) and two glycoforms of SHBG (Figure 5b). These measurements were carried out on the proteins isolated from serum. XIC intensities of the precursor ions correlated with peak intensities of the MS3 chromatography shown in Figure 5 (data not shown). The minor glycoforms of HPX were not detectable directly in serum samples. We have therefore compared the MRM and MRM3 workflows on three HPX glycoforms detectable directly in serum (Figure 6). The most intense glycoform (precursor m/z 843) can be detected reliably by both the MRM and MRM3 workflow; the two less abundant glycoforms, especially the glycoform with precursor m/z 1007, is detected reliably only by the MRM3 workflow (Figure 6). This indicates that MRM3 analysis of O-glycopeptides improves sensitivity compared to MRM analysis and should be the preferred workflow in complex samples like serum.
Figure 5.
MRM3 chromatogram of all monitored glycoforms of HPX (A) and SHBG (B).
Figure 6.
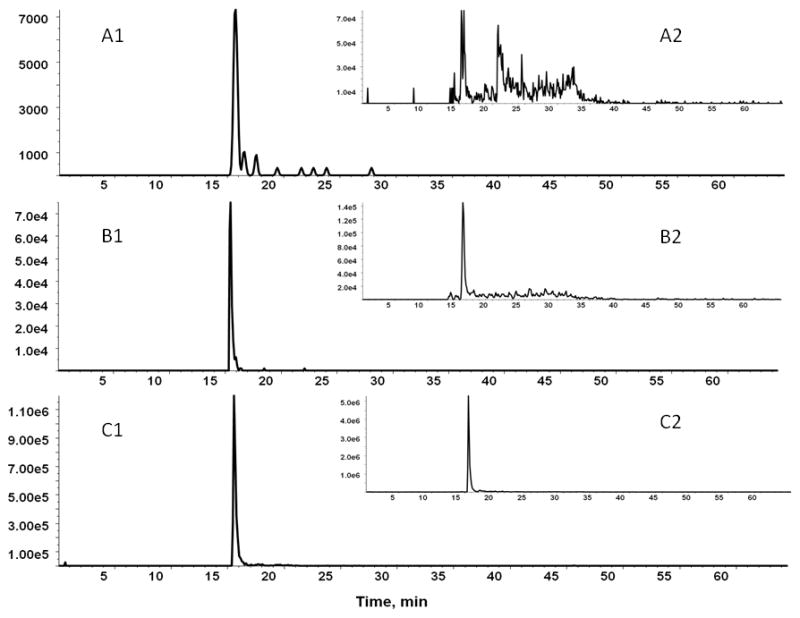
Comparison of the sensitivity of MS3 (A1, B1, C1) and MS2 (A2, B2, C2) analysis of the HPX O-glycopeptide for 3 major glycoforms 1007 (A), 770 (B), 843 (C) directly in serum.
3.5 Quantification of HPX glycoforms in crude serum and after affinity purification
We have purified HPX by hemin-agarose [18] followed by reverse phase protein chromatography [19]. This purification protocol is expected to recover all the HPX glycoforms because neither hemin affinity nor interaction of the protein with C18 stationary phase depend on the glycosylation status of the protein [28]. The purification yields >90% pure HPX with up to 50% recovery based on estimated 50 μg of HPX per 100 μl of serum. The micro-heterogeneity of glycans associated with the five N- and one O-glycosylation sites creates a complex mixture of forms. Our application of the MRM3 workflow to the analysis of O-glycopeptides focuses on quantitative comparison of the major HPX O-glycoforms between samples, either directly in a digest of serum or using enriched HPX. This is different from the analysis of glycoform distribution which can be only approximated in this workflow due to different analytical behavior (e.g. ionization) and the absence of standards. We have analyzed four different serum samples of healthy volunteers and observed comparable distribution of the glycoforms within 25 % of the average values with RSD up to 10% for precursor 843.7, 7% for precursor 770.9 and 20% for precursor 1007.7 for isolated samples and 13% for precursor 843.7, 7% for precursor 770.9 and 16% for precursor 1007.7 for the direct serum measurement (Table 2). Neu5Ac-Hex-GalNAc represented the major glycoform of HPX with greater than 80% intensity in all samples measured. We have not observed substantial changes in the distribution of the three major glycoforms when we compared results on isolated HPX with direct analysis of serum samples (Table 2). This indicates that the HPX isolation procedure did not substantially distort the distribution of the glycoforms and that appropriate enrichment procedures will be useful for the quantification of minor glycoforms not reachable directly in the complex serum background. The quantitative MRM3 workflow is expected to provide a reliable option for verification studies of patient samples following initial marker discovery. Values of the RSD could be further improved by inclusion of isotopically labeled glycopeptide standards which is highly recommended for implementation to standardized testing in clinical laboratories.
Table 2.
Determination of three O-glycopeptides of HPX in serum samples of four healthy volunteers with and without HPX protein enrichment.
| Average normalized area | RSD of normalized area (%) | |||
|---|---|---|---|---|
| isolated HPX | HPX in serum | isolated HPX | HPX in serum | |
| Sample 1 (843) | 82.71 | 126.93 | 1.79 | 12.45 |
| Sample 2 (843) | 73.83 | 116.76 | 4.19 | 12.97 |
| Sample 3 (843) | 80.15 | 109.50 | 9.87 | 7.17 |
| Sample 4 (843) | 73.23 | 106.39 | 2.07 | 3.95 |
| Sample 1 (770) | 20.58 | 19.06 | 1.57 | 1.29 |
| Sample 2 (770) | 15.16 | 24.81 | 6.91 | 6.38 |
| Sample 3 (770) | 15.94 | 18.00 | 0.15 | 0.63 |
| Sample 4 (770) | 16.74 | 20.88 | 1.79 | 7.11 |
| Sample 1 (1007) | 6.23 | 5.09 | 10.47 | 15.50 |
| Sample 2 (1007) | 5.09 | 3.62 | 5.44 | 1.05 |
| Sample 3 (1007) | 4.29 | 4.15 | 7.30 | 10.12 |
| Sample 4 (1007) | 4.42 | 4.28 | 19.66 | 12.08 |
4. Concluding remarks
We have developed a sensitive analytical method for the quantification of O-glycopeptides in a matrix as complex as human serum. We have optimized the analytical workflow, generalized prediction of collision energy, and validated this quantification method on HPX and SHBG, two serum glycoproteins. Our results, as well as other mass spectrometric studies of O-glycopeptides, suggest that this quantitative workflow will have quite general applicability. The MRM3 method is expected be a useful tool for quantitative mass spectrometric comparison of protein O-glycoforms in biological samples, including clinical applications. We expect that this workflow will be particularly suitable for verification studies providing quantitative comparisons of medium size studies of tens to hundreds of samples. The optimized workflow allowed us to quantify major O-glycoforms of HPX in serum samples without further enrichment. We have shown that the MRM3 workflow is at least 5 times more sensitive than the MRM analysis for the quantification of the less abundant O-glycopeptide glycoforms of HPX. Quantification of the minor glycoforms of HPX and glycoforms of the less abundant (μg/ml) SHBG were achieved by protein enrichment. It is expected that a new generation of mass analyzers will further improve the sensitivity achieved on the 4000 QTRAP.
Acknowledgments
This work was supported by U01 CA168926, UO1 CA171146 and RO1 CA135069 awarded to RG and the CCSG grant NIH P30 CA51008 to the Lombardi Comprehensive Cancer Center supporting the Proteomics and Metabolomics Shared Resource.
ABBREVIATIONS
- CE
collision energy
- CID
collision induced dissociation
- DP
declustering potential
- GalNAc
N-acetylgalactosamine
- HEX
hexose
- Hp
haptoglobin
- HPX
hemopexin
- IAA
iodoacetamide
- LIT
linear ion trap mass spectrometry analysator
- MRM
multiple reaction monitoring
- MRM3
MS3 multiple reaction monitoring workflow
- MS1
precursor ion mass spectrometry
- MS2
CID product ion mass spectrometry
- MS3
MS2 followed by further fragmentation in the LIT
- NeuAc
N-acetylneuraminic acid
- QqQ
triple quadrupole mass spectrometer
- QTRAP
quadrupoleion trap hybrid mass spectrometer
- SHBG
sex hormone binding globulin
- SRM
selected reaction monitoring
- UPLC
ultra performance liquid chromatography
- XIC
extracted ion chromatogram
Footnotes
The authors of the study declare no conflict of interest.
Contributor Information
Miloslav Sanda, Department of Oncology, Georgetown University, LCCC Room S184, 3800 Reservoir Rd NW, Washington, DC 20057.
Petr Pompach, Department of Oncology, Georgetown University, LCCC Room S184, 3800 Reservoir Rd NW, Washington, DC 20057.
Julius Benicky, Department of Oncology, Georgetown University, LCCC Room S184, 3800 Reservoir Rd NW, Washington, DC 20057.
Radoslav Goldman, Department of Oncology and Department of Biochemistry and Molecular & Cellular Biology, Georgetown University, LCCC Room S180, 3800 Reservoir Rd NW, Washington, DC 20057.
References
- 1.Dennis JW, Nabi IR, Demetriou M. Cell. 2009;139:1229–1241. doi: 10.1016/j.cell.2009.12.008. [DOI] [PMC free article] [PubMed] [Google Scholar]
- 2.Ju T, Otto VI, Cummings RD. Angew Chem Int Ed Engl. 2011;50:1770–1791. doi: 10.1002/anie.201002313. [DOI] [PMC free article] [PubMed] [Google Scholar]
- 3.Lauc G, Rudan I, Campbell H, Rudd PM. Mol Biosyst. 2010;6:329–335. doi: 10.1039/b910377e. [DOI] [PubMed] [Google Scholar]
- 4.Marth JD, Grewal PK. Nat Rev Immunol. 2008;8:874–887. doi: 10.1038/nri2417. [DOI] [PMC free article] [PubMed] [Google Scholar]
- 5.Ju T, Otto VI, Cummings RD. Angew Chem Int Ed Engl. 2011;50:1770–1791. doi: 10.1002/anie.201002313. [DOI] [PMC free article] [PubMed] [Google Scholar]
- 6.Arnold JN, Saldova R, Hamid UM, Rudd PM. Proteomics. 2008;8:3284–3293. doi: 10.1002/pmic.200800163. [DOI] [PubMed] [Google Scholar]
- 7.Jefferis R. Nat Rev Drug Discov. 2009;8:226–234. doi: 10.1038/nrd2804. [DOI] [PubMed] [Google Scholar]
- 8.Ruhaak LR, Zauner G, Huhn C, Bruggink C, et al. Anal Bioanal Chem. 2010;397:3457–3481. doi: 10.1007/s00216-010-3532-z. [DOI] [PMC free article] [PubMed] [Google Scholar]
- 9.Kolarich D, Jensen PH, Altmann F, Packer NH. Nat Protoc. 2012;7:1285–1298. doi: 10.1038/nprot.2012.062. [DOI] [PubMed] [Google Scholar]
- 10.Lazar IM, Lazar AC, Cortes DF, Kabulski JL. Electrophoresis. 2011;32:3–13. doi: 10.1002/elps.201000393. [DOI] [PMC free article] [PubMed] [Google Scholar]
- 11.Zauner G, Kozak RP, Gardner RA, Fernandes DL, et al. Biological Chemistry. 2012;393:687–708. doi: 10.1515/hsz-2012-0144. [DOI] [PubMed] [Google Scholar]
- 12.Cooper CA, Packer NH, Redmond JW. Glycoconjugate Journal. 1994;11:163–167. doi: 10.1007/BF00731156. [DOI] [PubMed] [Google Scholar]
- 13.Pinto R, Carvalho AS, Conze T, Magalhaes A, et al. Journal of Cellular and Molecular Medicine. 2012;16:1474–1484. doi: 10.1111/j.1582-4934.2011.01436.x. [DOI] [PMC free article] [PubMed] [Google Scholar]
- 14.Bafna S, Kaur S, Batra SK. Oncogene. 2010;29:2893–2904. doi: 10.1038/onc.2010.87. [DOI] [PMC free article] [PubMed] [Google Scholar]
- 15.Hollingsworth MA, Swanson BJ. Nature Reviews Cancer. 2004;4:45–60. doi: 10.1038/nrc1251. [DOI] [PubMed] [Google Scholar]
- 16.Steentoft C, Vakhrushev SY, Vester-Christensen MB, Schjoldager KTBG, et al. Nature Methods. 2011;8:977–982. doi: 10.1038/nmeth.1731. [DOI] [PubMed] [Google Scholar]
- 17.Wandall HH, Blixt O, Tarp MA, Pedersen JW, et al. Cancer Research. 2010;70:1306–1313. doi: 10.1158/0008-5472.CAN-09-2893. [DOI] [PMC free article] [PubMed] [Google Scholar]
- 18.Muller-Eberhard U. Methods Enzymol. 1988;163:536–565. doi: 10.1016/0076-6879(88)63049-7. [DOI] [PubMed] [Google Scholar]
- 19.Pompach P, Chandler KB, Lan R, Edwards N, Goldman R. J Proteome Res. 2012 doi: 10.1021/pr201183w. [DOI] [PMC free article] [PubMed] [Google Scholar]
- 20.Sumer-Bayraktar Z, Nguyen-Khuong T, Jayo R, Chen DD, et al. Proteomics. 2012 doi: 10.1002/pmic.201200354. [DOI] [PubMed] [Google Scholar]
- 21.Anderson NL, Anderson NG, Pearson TW, Borchers CH, et al. Mol Cell Proteomics. 2009;8:883–886. doi: 10.1074/mcp.R800015-MCP200. [DOI] [PMC free article] [PubMed] [Google Scholar]
- 22.Anderson NL, Jackson A, Smith D, Hardie D, et al. Mol Cell Proteomics. 2009;8:995–1005. doi: 10.1074/mcp.M800446-MCP200. [DOI] [PMC free article] [PubMed] [Google Scholar]
- 23.Shi T, Fillmore TL, Sun X, Zhao R, et al. Proc Natl Acad Sci U S A. 2012;109:15395–15400. doi: 10.1073/pnas.1204366109. [DOI] [PMC free article] [PubMed] [Google Scholar]
- 24.Fortin T, Salvador A, Charrier JP, Lenz C, et al. Anal Chem. 2009;81:9343–9352. doi: 10.1021/ac901447h. [DOI] [PubMed] [Google Scholar]
- 25.Pacchiarotta T, Hensbergen PJ, Wuhrer M, van Nieuwkoop C, et al. Journal of Proteomics. 2012;75:1067–1073. doi: 10.1016/j.jprot.2011.10.021. [DOI] [PubMed] [Google Scholar]
- 26.Zauner G, Koeleman CAM, Deelder AM, Wuhrer M. Journal of Separation Science. 2010;33:903–910. doi: 10.1002/jssc.200900850. [DOI] [PubMed] [Google Scholar]
- 27.Lemoine J, Fortin T, Salvador A, Jaffuel A, et al. Expert Review of Molecular Diagnostics. 2012;12:333–342. doi: 10.1586/erm.12.32. [DOI] [PubMed] [Google Scholar]
- 28.Smith A. Biochemical Journal. 1985;231:663–669. doi: 10.1042/bj2310663. [DOI] [PMC free article] [PubMed] [Google Scholar]


