

Abstract
The QFlu prototype bioluminescence-based neuraminidase (NA) inhibition (NI) assay kit was designed to detect NA inhibitor (NAI)-resistant influenza viruses at point of care. Here, we evaluated its suitability for drug susceptibility assessment at a surveillance laboratory. A comprehensive panel of reference viruses (n = 14) and a set of 90 seasonal influenza virus A and B isolates were included for testing with oseltamivir and/or zanamivir in the QFlu assay using the manufacturer-recommended protocol and a modified version attuned to surveillance requirements. The 50% inhibitory concentrations (IC50s) generated were compared with those of NI assays currently used for monitoring influenza drug susceptibility, the fluorescent (FL) and chemiluminescent (CL) assays. To provide proof of principle, clinical specimens (n = 235) confirmed by real-time reverse transcription (RT)-PCR to contain influenza virus A(H1N1)pdm09 and prescreened for the oseltamivir resistance marker H275Y using pyrosequencing were subsequently tested in the QFlu assay. All three NI assays were able to discriminate the reference NA variants and their matching wild-type viruses based on the difference in their IC50s. Unless the antigenic types were first identified, certain NA variants (e.g., H3N2 with E119V) could be detected among seasonal viruses using the FL assays only. Notably, the QFlu assay identified oseltamivir-resistant A(H1N1)pdm09 viruses carrying the H275Y marker directly in clinical specimens, which is not feasible with the other two phenotypic assays, which required prior virus culturing in cells. Furthermore, The QFlu assay allows detection of the influenza virus A and B isolates carrying established and potential NA inhibitor resistance markers and may become a useful tool for monitoring drug resistance in clinical specimens.
INTRODUCTION
Monitoring influenza resistance to antiviral drugs is an essential component of the WHO Global Influenza Surveillance and Response System (GISRS). The M2 blockers amantadine and rimantadine have lost their usefulness in recent years due to widespread resistance (1, 2), leaving neuraminidase (NA) inhibitors as the only available treatment option. Two NA inhibitors, zanamivir (inhaled) and oseltamivir (oral) are FDA approved, while other drugs in the same class are undergoing clinical development. A long-acting NA inhibitor, laninamivir (inhaled), is available in Japan (3), and peramivir (intravenous) is marketed in two countries, South Korea and Japan (4). Assessment of influenza virus susceptibility to the NA inhibitor class of drugs has been a challenge due to insufficient knowledge of molecular markers of resistance and a lack of reliable cell culture-based assays (5). Surveillance laboratories use the two recommended NA inhibition (NI) assays, fluorescent (FL) and chemiluminescent (CL), supplemented with NA sequence analysis, to assess the susceptibility of influenza viruses A and B to NA inhibitors. Both assays utilize small synthetic substrates, 4-methylumbelliferyl N-acetyl-α-d-neuraminic acid (MUNANA) and 1,2-dioxetane (NA-Star), which produce fluorescent (6) and luminescent (7) signals, respectively. The NA cleaves N-acetyl neuraminic acid (NeuAc) from a substrate, thus liberating a signal-generating product. The enzyme activity is measured at various drug concentrations to determine 50% inhibitory concentration (IC50) values. Type B viruses tend to require higher concentrations of NA inhibitor to achieve the same levels of inhibition as type A viruses (8–10) and therefore have higher baseline IC50s in the NI assay. In clinical settings, type B viruses have been shown to be less susceptible to oseltamivir and/or zanamivir than influenza A viruses, although supporting data are sparse (11–14).
A growing inventory of influenza viruses with NA changes recovered after treatment with NA inhibitor(s) has been reported, with markers such as H275Y in seasonal A(H1N1) and A(H1N1)pdm09 viruses and E119V and R292K in A(H3N2) viruses being detected more commonly. NI assays typically detect NA variants that either emerged after treatment or occurred spontaneously, e.g., D197E and I221V in influenza virus B (15, 16). There are no established laboratory correlates (i.e., cutoff IC50s) of clinically relevant resistance; therefore, interpreting NI assay data is not straightforward. To improve consistency in reporting of NI surveillance data, the WHO Antiviral Working Group established a set of criteria for NI data interpretation based on fold change in IC50s (17). The fold change is determined by comparing the IC50 of a test virus with the IC50 of a control/reference virus of the same type or with a median IC50 for the respective drug and virus type. Specifically, for type A influenza viruses, a fold difference of <10 is reported as normal inhibition, 10 to 100 as reduced inhibition, and >100 as highly reduced inhibition. To account for the greater baseline IC50s for type B viruses, the intervals were set at a lower level: a fold difference of <5 is reported as normal inhibition, 5 to 50 as reduced inhibition, and >50 as highly reduced inhibition.
Each NI assay has its own advantages and limitations (18). One limitation shared by FL and CL assays is the requirement for virus propagation prior to testing. Besides longer turnaround time, virus culturing can introduce changes that alter susceptibility to NA inhibitors (19, 20). Recent advances in the development of new and more-sensitive methods for measuring NA activity, intended for detection of drug resistance at point of care (POC) (21), prompted the present study. Here, we assessed a prototype of the bioluminescence-based NI assay kit (QFlu) as a potential tool for monitoring drug susceptibility in influenza viruses. We first conducted a side-by-side comparison of the QFlu assay with the FL and CL assays using a comprehensive panel of reference viruses. Subsequently, baseline IC50s for oseltamivir and zanamivir were determined for contemporary influenza viruses A and B using the three NI assays in parallel. Finally, we provided proof of principle by testing a set of original clinical specimens containing A(H1N1)pdm09 viruses with and without the oseltamivir resistance marker H275Y.
MATERIALS AND METHODS
Viruses.
Seasonal influenza viruses (clinical specimens and matching virus isolates) were submitted to the WHO Collaborating Center for Surveillance, Epidemiology and Control of Influenza at the Centers for Disease Control and Prevention (CDC) for virological surveillance, which includes antigenic characterization and antiviral susceptibility testing. Surveillance is considered a public health practice and therefore exempt from review by the CDC internal review board. Prior to antiviral testing, viruses were propagated in Madin-Darby canine kidney cells and antigenically characterized in the hemagglutinin inhibition (HI) assay to confirm virus type/subtype. Test viruses included NA variants with various substitution(s) that were identified in previous years through surveillance, as well as representative seasonal viruses collected during the 2010-2011 influenza season. Reference viruses from the CDC Influenza Reagent Resource (https://www.influenzareagentresource.org) and the International Society for Influenza and other Respiratory Virus Diseases (isirv; http://www.isirv.org) Antiviral Group panels were included in the study. In this paper, straight amino acid numbering for NA substitutions is used throughout the text.
NI assays.
Oseltamivir (carboxylate) (Hoffmann-La Roche, Switzerland) and zanamivir (GlaxoSmithKline, United Kingdom) obtained through a Material Transfer Agreement were dissolved in sterile distilled water and stored at −30°C. Reaction conditions of the three NI assays reflect the surveillance requirements (see Table S1 in the supplemental material). The NA activity of each virus was measured to determine the optimal virus dilution. Half-log dilutions of NAIs were prepared with final concentrations ranging from 0.03 to 1,000 nM. In each assay, diluted viruses were preincubated with an NAI and subsequently incubated with the corresponding substrate. The generated signals were read on a Victor 3V instrument (Perkin-Elmer, MA). IC50 values were calculated using the JASPR (v1.2) curve fitting software (22). At least three independent experiments were conducted for each virus unless specified otherwise. Descriptive data analyses were performed using Microsoft Office Excel 2010 (Microsoft Corporation, WA).
(i) QFlu NI assay.
The QFlu NI assay (Cellex, MD) is intended for detection of drug resistance in clinical specimens in a single-step procedure, without virus propagation and determination of optimal NA activity (Fig. 1, protocol A). The prototype QFlu kit used in this study contained a master mix including the NA substrate, luciferyl N-acetylneuraminic acid (21), and luciferase. NeuAc cleavage from the substrate releases luciferin, the substrate for luciferase. The luminescent signal is directly proportional to the NA activity in the sample and is reduced when the sample is mixed with an NAI. The use of protocol A was limited to testing of the reference virus set (Table 1) and the set of clinical specimens containing virus A(H1N1)pdm09 isolates collected in July and August, 2009. In other experiments, protocol B was used, whereby virus and NAI were preincubated at room temperature for 30 min prior to substrate addition (Fig. 1; see Table S1 in the supplemental material). Working virus dilutions were made to provide a signal ∼40-fold above background. The set of clinical specimens collected in January and February 2012 was tested only once and without determining the working virus dilution. The NA-Star buffer (Applied Biosystems, CA) was used to dilute the viruses and NA inhibitors, whereas the substrate was reconstituted in the reaction buffer provided with the QFlu kit. Luminescence was read for 0.1 s at a single point in 96-well plates after 30 min.
Fig 1.
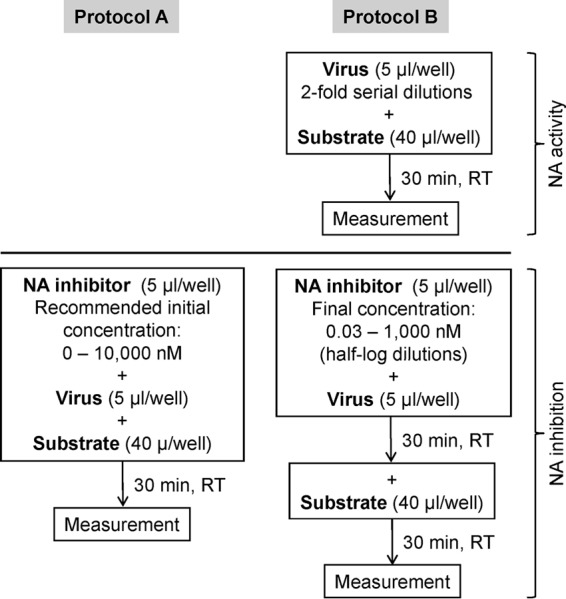
Diagrams depicting succession of the NI test performed under protocol A (according to instructions provided with the QFlu NI assay kit and intended for point of care use) and protocol B (commonly used in surveillance laboratories/protocols).
Table 1.
Determination of oseltamivir IC50s of reference viruses using the QFlu NI assaya
| Virus type/subtype | Strain designation | NA changeb | Mean IC50 (nM)c ± SD (fold change)d |
|
|---|---|---|---|---|
| Protocol A | Protocol B | |||
| A(H1N1) | A/Washington/10/2008 | 0.54 ± 0.05 | 0.07 ± 0.01 | |
| A/Florida/21/2008 | H275Y | 83.65 ± 26.69 (155) | 70.69 ± 2.98 (1,010) | |
| A(H3N2) | A/Washington/01/2007 | 0.50 ± 0.07 | 0.06 ± 0.01 | |
| A/Texas/12/2007 | E119V | 4.95 ± 0.75 (10) | 3.50 ± 0.58 (58) | |
| B | B/Memphis/20/1996 | 2.96 ± 0.42 | 0.51 ± 0.06 | |
| B/Memphis/20/1996 | R150K | 79.76 ± 27.33 (27) | 45.33 ± 6.40 (89) | |
See also Fig. 1 for details.
The NA amino acid sequence of the respective wild-type (WT) virus is identical except for the change indicated.
Derived from at least three independent experiments.
Fold change (in boldface for clarity) compared to the mean IC50 of the corresponding reference WT virus.
(ii) FL NI assay.
The FL NI assay was performed using the NA-Fluor kit (Applied Biosystems) as described previously (23, 24), with some modifications (see Table S1 in the supplemental material). The substrate, virus dilutions, and NA inhibitors were prepared using the assay buffer provided in the NA-Fluor kit. Stop solution was added 1 h after substrate addition. The end product of the reaction, 4-methylumbelliferone, produces fluorescence, which was read for 0.1 s on a Victor 3V instrument using filters with excitation and emission wavelengths of 365 nm and 450 nm, respectively.
(iii) CL NI assay.
The CL NI assay was performed utilizing the NA-Star kit (Applied Biosystems, CA) as described previously (25), with minor modifications. Virus dilutions were made to provide a signal ∼40-fold above background. Luminescence was read for 0.1 s at a single point on a Victor 3V instrument.
Real-time RT-PCR.
Virus content in clinical specimens (denoted by threshold cycle [CT] values) was determined according to the CDC protocol for real-time reverse transcription (RT)-PCR as previously described (26). Briefly, viral RNA was extracted from 100 μl of collected specimen using the MagNA Pure Compact Nucleic Acid Isolation kit and MagNA Pure Compact instrument (Roche Applied Science, IN), with a 100-μl elution volume, according to the manufacturer's instructions. Real-time RT-PCRs were performed on the Stratagene Mx3005P qPCR instrument (Agilent Technologies, Inc., CA) in a final volume of 25 μl using the Invitrogen Super Script III platinum One-Step quantitative RT-PCR kit (Life Technologies, NY).
Pyrosequencing.
The presence and proportion of the H275Y substitution in the NA of A(H1N1)pdm09 were analyzed by the pyrosequencing assay performed on the PyroMark Q96 ID platform (Qiagen, Hilden, Germany), as previously described (27, 28). Briefly, biotinylated PCR product was bound to streptavidin-coated beads (GE Biosciences, Uppsala, Sweden). A single-stranded biotinylated nucleic acid template was prepared through a series of washes and then hybridized with the sequencing primer (final concentration, 0.45 μM). The pyrosequencing reaction was performed in allele quantification (AQ) mode to generate quantitative single nucleotide polymorphism (SNP) analyses. Nucleotide dispensation for pyrosequencing reactions was generated automatically by PyroMark Q96 software (v2.5.8; Qiagen, Hilden, Germany).
RESULTS
Selection of conditions for the QFlu NI assay.
The testing procedure provided with the QFlu NI kit aims at a rapid detection of drug resistance (protocol A [Fig. 1]), so that the information gained could be used to guide treatment decision for a patient. Virologic surveillance requires a thorough drug susceptibility assessment for various groups of influenza viruses circulating in communities. For this purpose, the QFlu assay was modified (protocol B [Fig. 1]) to attune to the needs of surveillance. For the side-by-side comparison of protocols A and B, three pairs of reference viruses (Table 1) were tested with oseltamivir. Each pair comprised a well-characterized NA variant with amino acid substitution in the NA active site and a wild-type (WT) virus lacking the respective NA substitution. When tested according to protocols A and B, the IC50s of the three NA variants were greater than those of their respective WT, indicating that the conditions used in either protocol were applicable for their distinction (Table 1). Of note, the IC50 of the influenza B WT virus, generated using protocol A, was less than 2-fold above that of the A(H3N2) E119V NA variant, which would make it difficult to discriminate between those two viruses without first knowing the antigenic type. Despite differences in conditions between the two protocols, the IC50s of the three NA variants tested were comparable (<2-fold). However, a clear difference was seen in IC50s of the WT viruses, which were much lower when determined using protocol B. As a result, protocol B produced greater fold differences (6 to 8 times) and, overall, offered better distinction between the WT viruses and their NA variants. Therefore, protocol B was used in all subsequent experiments performed on virus isolates with the QFlu assay.
Comparison of the QFlu, FL, and CL NI assays.
To compare the three NI assays, an expanded panel of seven pairs of reference viruses were tested with oseltamivir and zanamivir (see Table S2 in the supplemental material). The oseltamivir IC50s generated in the QFlu assay for the same viruses were somewhat lower than those from the FL assay (1- to 7-fold for WT viruses; 5- to 14-fold for NA variants). Depending on the substitution, the QFlu assay produced fold increases in oseltamivir IC50 between the WT and the respective NA variant that were either greater than or similar to those of the CL assay. The FL assay, however, delivered the clearest distinction between the NA variant and the corresponding WT. When the WHO criteria were applied to interpret the IC50s, the reference viruses fell into the same category, regardless of the NI assay used for their testing (see Table S3 in the supplemental material), with a notable exception: the E119V NA variants exhibited reduced inhibition when tested in QFlu and CL assays but highly reduced inhibition in the FL assay.
The zanamivir IC50s determined for each reference virus in all three NI assays were similar (≤2-fold), except the type B NA variants, which exhibited 3- to 17-fold-lower zanamivir-IC50s in the QFlu assay (see Table S2 in the supplemental material). For example, the fold difference in zanamivir IC50s for the B/Memphis/20/1996 pair was only 4-fold when determined in the QFlu assay, while in the other two assays the difference was 27- to 45-fold. Because the R150K NA variant was recovered from a patient after zanamivir treatment, the ability to detect such a variant would be desirable. While some NA variants exhibited reduced zanamivir inhibition in the FL NI assay (see Table S3 in the supplemental material), they would be qualified as showing normal inhibition if tested in QFlu or CL assays.
To extend our analysis, an additional group of NA variants was tested (see Table S4 in the supplemental material). They fell within the same respective criteria of inhibition by oseltamivir and zanamivir (see Table S5 in the supplemental material) when tested in either the QFlu or the FL assay. The results demonstrated that the QFlu assay has the ability to detect a majority of previously identified NA variants.
Baseline IC50s of seasonal influenza viruses.
A set of seasonal viruses, comprising A(H1N1)pdm09, A(H3N2), and type B viruses (n = 30 for each type/subtype), were tested. Compared to the FL assay, the median oseltamivir IC50s obtained in the QFlu assay were similar for A(H3N2) viruses but 4-fold lower for A(H1N1)pdm09 and 10-fold lower for type B viruses (see Table S6 in the supplemental material). In contrast, the median zanamivir IC50s were similar for A(H1N1)pdm09 and type B viruses but 3-fold greater for A(H3N2) when tested using the QFlu assay. The difference between median IC50s generated by the QFlu and the CL assays was ≤2-fold, with the exception of oseltamivir IC50s for A(H1N1)pdm09 and type B viruses, which were almost 4-fold and 3-fold greater in the CL assay. Regardless of the assay used, the median oseltamivir IC50s were highest for type B viruses. The differences between influenza viruses A and B were more pronounced in the FL assay (55- to 98-fold) than in the QFlu (8- to 20-fold) or the CL (∼14-fold) assay. No substantial differences in median zanamivir IC50s were observed across all three NI assays. The median zanamivir IC50s of the type A viruses were 7- to 9-fold lower than those of type B viruses when assessed in the FL assay, <2- to 8-fold lower in the QFlu assay, and 3- to 9-fold in the CL assay.
Susceptibility assessment to NA inhibitors in clinical specimens.
Since the QFlu NI assay was intended by the manufacturer for use at point of care, we first tested clinical samples under the conditions described in the kit's insert (protocol A, one step). A set of 215 clinical specimens (nasal swabs and nasal washes) collected at the beginning of the 2009 pandemic were tested using the QFlu assay, protocol A. These specimens were confirmed to contain the A(H1N1)pdm09 virus and prescreened by the pyrosequencing assay to detect the oseltamivir resistance marker H275Y. Three of the samples contained this marker, while the rest had the WT sequence. Of this panel, 136 samples exhibited sufficient NA activity. The enzyme activity of the remaining samples (n = 79), including one with the H275Y marker, was too low to allow the IC50 determination. Among 136 clinical samples with sufficient NA activity, two samples with the H275Y marker exhibited notably elevated oseltamivir IC50s, 11.02 nM and 19.09 nM, which were 53-fold and 91-fold greater (reduced inhibition) than the mean oseltamivir IC50 (0.21 ± 0.14 nM; median, 0.19 nM) of the viruses without H275Y. The oseltamivir IC50s of the viruses lacking H275Y fell in a wide range, 0.01 to 0.88 nM, whereas their zanamivir IC50s were much less variable: 0.11 to 1.88 nM (mean, 0.75 ± 0.41 nM; median, 0.67 nM).
Next, a smaller (n = 20) set of clinical specimens collected in 2012 were tested using protocol B. The specimens met several requirements: they were identified as A(H1N1)pdm09 with a wide range of CT values, had adequate volume, and had a matching isolate (Table 2). Four clinical specimens and their corresponding isolates contained the H275Y marker (>80% by SNP analysis). First, we tested all virus isolates with or without the H275Y substitution. As expected, the four H275Y isolates exhibited “highly reduced inhibition” by oseltamivir (samples 11, 12, 18, and 20), while those without H275Y exhibited normal inhibition. All 20 isolates exhibited normal inhibition by zanamivir. When the clinical specimens were tested, only 12 (including two with the H275Y substitution) had sufficient NA activity for assessment of IC50s. Their signal/background ratios ranged from 10 to 100, and their CT values ranged from 17.39 to 28.44. The CT values of the clinical specimens (n = 8) with insufficient NA activity were above 29, indicating an overall lower virus load.
Table 2.
Testing of clinical specimens containing influenza virus A(H1N1)pdm09 and their matching isolates in the QFlu (protocol B) NI assaya
| Sample no. | Clinical specimens |
Isolates |
|||||
|---|---|---|---|---|---|---|---|
| CT value | % with H275Y | IC50b (fold)d |
% with H275Y | Mean IC50c ± SD (fold)d |
|||
| Oseltamivir | Zanamivir | Oseltamivir | Zanamivir | ||||
| 1 | 17.39 | — | 0.06 (1) | 0.13 (1) | — | 0.09 ± 0.01 (1) | 0.20 ± 0.03 (1) |
| 2 | 22.95 | — | 0.10 (1) | 0.18 (1) | — | 0.07 ± 0.02 (1) | 0.15 ± 0.04 (1) |
| 3 | 23.78 | — | 0.07 (1) | 0.15 (1) | — | 0.06 ± 0.03 (1) | 0.13 ± 0.02 (1) |
| 4 | 23.85 | — | 0.06 (1) | 0.12 (1) | — | 0.06 ± 0.02 (1) | 0.19 ± 0.03 (1) |
| 5 | 24.99 | — | 0.19 (2) | 0.33 (2) | — | 0.07 ± 0.02 (1) | 0.18 ± 0.02 (1) |
| 6 | 25.28 | — | 0.10 (1) | 0.12 (1) | — | 0.08 ± 0.01 (1) | 0.17 ± 0.04 (1) |
| 7 | 25.80 | — | 0.01 (1) | 0.07 (1) | — | 0.08 ± 0.01 (1) | 0.14 ± 0.00 (1) |
| 8 | 26.03 | — | 0.09 (1) | 0.08 (1) | — | 0.10 ± 0.03 (1) | 0.16 ± 0.04 (1) |
| 9 | 26.29 | — | 0.04 (1) | 0.14 (1) | — | 0.07 ± 0.01 (1) | 0.20 ± 0.05 (1) |
| 10 | 27.74 | — | — | — | 0.07 ± 0.02 (1) | 0.17 ± 0.01 (1) | |
| 11 | 28.33 | 86.4 | 368.18 (4,091) (HRI) | 1,448.52 (10,347) (HRI) | 81.0 | 16.57 ± 1.83 (207) (HRI) | 0.22 ± 0.01 (1) |
| 12 | 28.40 | 89.7 | 9.96 (111) (HRI) | 0.12 (1) | 90.8 | 26.89 ± 3.54 (336) (HRI) | 0.24 ± 0.04 (1) |
| 13 | 28.44 | — | 0.19 (2) | 0.12 (1) | — | 0.08 ± 0.02 (1) | 0.17 ± 0.06 (1) |
| 14 | 29.21 | — | — | — | 0.09 ± 0.01 (1) | 0.18 ± 0.03 (1) | |
| 15 | 29.24 | — | — | — | 0.06 ± 0.02 (1) | 0.12 ± 0.02 (1) | |
| 16 | 31.15 | — | — | — | 0.08 ± 0.01 (1) | 0.17 ± 0.07 (1) | |
| 17 | 31.58 | — | — | — | 0.09 ± 0.01 (1) | 0.20 ± 0.01 (1) | |
| 18 | 31.95 | 82.1 | — | — | 93.6 | 23.53 ± 3.51 (294) (HRI) | 0.22 ± 0.05 (1) |
| 19 | 32.06 | — | — | — | 0.09 ± 0.01 (1) | 0.16 ± 0.03 (1) | |
| 20 | 32.58 | 83.8 | — | — | 83.8 | 24.54 ± 4.46 (307) (HRI) | 0.26 ± 0.03 (1) |
Type and subtype of the clinical samples were confirmed as A(H1N1)pdm09 by real-time RT-PCR. —, not detected; HRI, highly reduced inhibition. IC50 and fold change values are according to the WHO criteria.
IC50 (nM) based on a single measurement due to a limited volume of clinical specimens available for testing.
Mean IC50 (nM) ± SD derived from at least three independent experiments for virus isolates.
Fold increase (in boldface for clarity) compared to the mean IC50 of the respective clinical specimen (0.09 nM for oseltamivir; 0.14 nM for zanamivir) or matching isolates (0.08 nM for oseltamivir; 0.17 nM for zanamivir) without the H275Y substitution.
Compared to the matching virus isolates, the clinical specimens lacking the H275Y marker showed more-variable oseltamivir IC50s, ranging from 0.01 to 0.19 nM (Table 2). Of note, this range was much narrower than that generated using protocol A (see above), although more data are needed. The oseltamivir IC50s of clinical samples with the H275Y variant (samples 11 and 12; 368.18 nM and 9.96 nM, respectively) were at least 52-fold greater than the highest oseltamivir IC50 for the clinical sample lacking this substitution (samples 5 and 13; 0.19 nM). Despite similar H275Y content (∼90%), the oseltamivir IC50 of the clinical sample possessing this substitution (sample 12) was ∼3-fold lower than that of its matching isolate (9.96 nM versus 26.89 nM). Of note, both clinical sample 12 and its matching isolate exhibited highly reduced inhibition by oseltamivir (>100-fold increase) when their IC50s were compared to the mean IC50 (0.09 nM) of the viruses without H275Y. The zanamivir IC50s were within a much narrower range for both clinical samples (0.07 to 0.33 nM) and their matching isolates (0.12 to 0.26 nM), with the exception of clinical sample 11. This sample, with H275Y, displayed very high IC50s for zanamivir, most likely due to an exogenous source of NA activity. In contrast, its matching isolate showed IC50s that were similar to those of the other three H275Y isolates: highly reduced inhibition by oseltamivir and normal inhibition by zanamivir.
DISCUSSION
The ability to measure influenza virus NA activity directly in clinical samples presents a crucial opportunity for improvement of drug resistance detection in both clinical settings and surveillance laboratories. The QFlu NI kit, which is under development (21), was designed with the aim to detect NA inhibitor-resistant viruses in clinical samples at point of care. In this study, we focused on the applicability of the QFlu assay kit to perform assessment of susceptibility to NA inhibitors as part of virological surveillance. Using the prototype version of QFlu substrate, we were able to detect the oseltamivir-resistant H275Y NA variants directly in clinical specimens containing A(H1N1)pdm09 viruses. This was done using both protocol A, suggested by the kit's manufacturer, and protocol B, modified to better address requirements specific to virological surveillance (e.g., determination of IC50). We observed that although testing under protocol A is faster, protocol B provided a more reliable detection of NA variants. In certain regards, requirements of virological surveillance are more demanding, requiring the generation of accurate and consistent IC50s, whereas in clinical settings it is limited to the detection of drug-resistant viruses, which will trigger adjustment of patient treatment. Surveillance laboratories are better equipped to provide comprehensive analysis of drug susceptibility, which includes knowledge of the virus's genetic makeup and antigenic type/subtype of circulating viruses.
One critical limitation of our study was the use of residual clinical specimens that underwent multiple freeze-thaw cycles prior to testing for antiviral susceptibility. Of note, it was shown that the N1 NA is less stable than the enzyme of N2 viruses (29); thus, it is more sensitive to environmental changes such as freeze-thawing. Another limitation was inadequate sample volume, which hindered repeated testing. The use of undiluted freshly collected clinical specimens (i.e., nasal wash) would likely improve the QFlu assay performance. Clinical trials of a related kit, the QFlu combo test, have been ongoing to evaluate the assay's sensitivity and specificity for influenza diagnosis and drug resistance detection (www.ClinicalTrials.gov) using much larger sample sizes. Although not exactly the same, the QFlu combo test kit (modified substrate; luciferyl 4,7-di-O-methyl-N-acetylneuraminic acid) and the substrate tested in this study (prototype substrate; luciferyl N-acetylneuraminic acid) offer a similar detection principle. Other than specificity, the performance characteristics for the QFlu combo test kit formulated with specific substrate are not expected to differ from those of the assay with nonspecific substrate.
Under protocol B, the QFlu NI assay was found to perform best on samples with CT values of <29. Specimens with CT values of >29 had undetectable or low NA activity, which was reflected in the unsatisfactory inhibition curves. Of the 4 clinical samples confirmed by pyrosequencing to contain the H275Y substitution, 2 displayed high oseltamivir IC50s in the QFlu NI assay. No NA activity was detected in the remaining 2 specimens (CT value, >29), most likely due to the small amounts of virus particles. Unexpectedly, one specimen (sample 11) showed highly reduced inhibition by both oseltamivir and zanamivir. This was an unusual finding because H275Y variants are resistant only to oseltamivir and not to zanamivir. All four respective H275Y isolates propagated from the above clinical specimens revealed highly reduced inhibition by oseltamivir and normal inhibition by zanamivir. The elevated zanamivir IC50 suggests the presence of an exogenous source of NA (e.g., bacteria) in clinical sample 11, similarly to previous reports (30). To avoid such false positives that may arise from bacterial contamination, a second generation of the QFlu substrate (mentioned above) with a modified chemical structure (21) specific to influenza NA has recently been developed. On the other hand, despite similar H275Y content (∼90%), clinical sample 12 had a 3-fold-lower oseltamivir IC50 than that of its matching isolate. The lack of sufficient volume of the clinical material precluded further analysis of this discrepancy. Nevertheless, the fold increase in oseltamivir IC50 of clinical sample 12 and its matching isolate fell into the same WHO criteria for highly reduced inhibition.
There is no established cutoff IC50 that would allow identification (a direct judgment) of viruses whose replication in patients is not inhibited by a drug. The NI assay detects viruses whose NA activity is not effectively inhibited by one or more NA inhibitor(s) compared to the reference WT viruses, thus indicating potentially reduced drug susceptibility. At this time, the capacity to detect viruses carrying H275Y is of particular importance. Although the clinically relevant resistance of A(H1N1)pdm09 viruses with the H275Y substitution has not been definitively demonstrated, the presence of this substitution in seasonal A(H1N1) viruses was correlated with an impaired response to oseltamivir treatment (31–35). It is beneficial to monitor the emergence and spread of other NA variants (e.g., E119V in A(H3N2) or I223R/K in A(H1N1)pdm09) among viruses circulating in communities as well as to detect new NA variants conferring potential resistance to NA inhibitor(s). The ability to discriminate between WT and corresponding NA variants using the QFlu assay was comparable to that using the CL assay but inferior to that of the FL assay. Of note, H275Y variants of A(H1N1) and A(H1N1)pdm09 virus isolates can be detected using the QFlu assay, as well as other NA variants such as R292K in A(H3N2) and R374K in type B, which produce high oseltamivir IC50s across all three NI assays. In this study, we had the advantage of knowing the virus types and subtypes based on real-time PCR and antigenic analysis, which aided in the interpretation of IC50 data.
To be useful for drug susceptibility monitoring, an NI assay should possess desirable features that include but are not limited to (i) a substrate specific for influenza NA, (ii) reliable discrimination between the reference WT viruses and their respective NA variants, and (iii) consistency in the category according to the WHO criteria. As discussed above, the presence of exogenous NA could interfere with the test outcome, which is especially relevant for clinical specimens (30). In terms of IC50 reproducibility when testing virus isolates, protocol B produced the most desirable outcome, as opposed to the one-step reaction under manufacturer recommendations (protocol A). Testing under protocol A led to substantially less discriminative IC50s. Our observations using the QFlu assay (see Table S7 in the supplemental material) were in accordance with a recently published study in which the FL assay was used to assess IC50s without preincubation (36). It was shown that IC50s for WT viruses start high and although they decrease continuously over the reaction time, the final IC50s remain substantially higher than that for preincubated viruses. Protocol A may be beneficial in clinical settings since it offers a rapid result. However, for laboratory surveillance purposes, where there is a need to see subtle differences among and within cocirculating groups (antigenic subtypes), protocol B provided better discrimination. Furthermore, certain discrepancies in the interpretation of IC50s were observed. For instance, the FL assay provided better discrimination between the A(H3N2) virus and its E119V variant (37), which was interpreted as “highly reduced” inhibition by oseltamivir while only as “reduced inhibition” in QFlu and CL assays. Further investigations are also required to evaluate the assay's ability to detect mixtures of NA variants, which was not addressed in this study. Although QFlu is intended by the manufacturer for determination of the virus type in the POC setting, it is recommended to ascertain the virus type/subtype concurrently.
Established and potential markers of reduced NA inhibitor susceptibility in clinical samples are currently detected using genotypic methods, e.g., pyrosequencing or real-time RT-PCR. However, unlike phenotypic assays, these technologies cannot detect drug-resistant viruses carrying novel substitutions or viruses with altered NA sequence. The data presented here depict the advantages and disadvantages of testing clinical specimens using the QFlu NI assay. Based on our current results, QFlu was able to detect viral NA activity in up to 60% of all clinical samples tested. The probability of the assay to produce false-positive results as seen with clinical sample 11 would most likely be overcome by using the influenza-specific substrate, although larger quantities of data will be needed for further justification.
Supplementary Material
ACKNOWLEDGMENTS
We thank our collaborators within the WHO Global Influenza Network, including the U.S. Public Health Laboratories, for submission of viruses to the CDC. We thank the members of the Molecular Epidemiology Team in the Influenza Division, particularly Marnie Levine and Kristina Ballenger, for their excellent technical assistance.
The findings and conclusions of this report are those of the authors and do not necessarily represent the views of CDC. We declare that we have no conflicts of interest.
Footnotes
Published ahead of print 5 August 2013
Supplemental material for this article may be found at http://dx.doi.org/10.1128/AAC.01086-13.
REFERENCES
- 1.Shiraishi K, Mitamura K, Sakai-Tagawa Y, Goto H, Sugaya N, Kawaoka Y. 2003. High frequency of resistant viruses harboring different mutations in amantadine-treated children with influenza. J. Infect. Dis. 188:57–61 [DOI] [PubMed] [Google Scholar]
- 2.Suzuki H, Saito R, Masuda H, Oshitani H, Sato M, Sato I. 2003. Emergence of amantadine-resistant influenza A viruses: epidemiological study. J. Infect. Chemother. 9:195–200 [DOI] [PubMed] [Google Scholar]
- 3.Sugaya N, Ohashi Y. 2010. Long-acting neuraminidase inhibitor laninamivir octanoate (CS-8958) versus oseltamivir as treatment for children with influenza virus infection. Antimicrob. Agents Chemother. 54:2575–2582 [DOI] [PMC free article] [PubMed] [Google Scholar]
- 4.Shetty AK, Peek LA. 2012. Peramivir for the treatment of influenza. Expert Rev. Anti Infect. Ther. 10:123–143 [DOI] [PubMed] [Google Scholar]
- 5.Tisdale M. 2000. Monitoring of viral susceptibility: new challenges with the development of influenza NA inhibitors. Rev. Med. Virol. 10:45–55 [DOI] [PubMed] [Google Scholar]
- 6.Hurt AC, Okomo-Adhiambo M, Gubareva LV. 2012. The fluorescence neuraminidase inhibition assay: a functional method for detection of influenza virus resistance to the neuraminidase inhibitors. Methods Mol. Biol. 865:115–125 [DOI] [PubMed] [Google Scholar]
- 7.Okomo-Adhiambo M, Hurt AC, Gubareva LV. 2012. The chemiluminescent neuraminidase inhibition assay: a functional method for detection of influenza virus resistance to the neuraminidase inhibitors. Methods Mol. Biol. 865:95–113 [DOI] [PubMed] [Google Scholar]
- 8.Carr S, Ilyushina NA, Franks J, Adderson EE, Caniza M, Govorkova EA, Webster RG. 2011. Oseltamivir-resistant influenza A and B viruses pre- and postantiviral therapy in children and young adults with cancer. Pediatr. Infect. Dis. J. 30:284–288 [DOI] [PMC free article] [PubMed] [Google Scholar]
- 9.Mohr PG, Geyer H, McKimm-Breschkin JL. 2011. Mixed influenza A and B infections complicate the detection of influenza viruses with altered sensitivities to neuraminidase inhibitors. Antiviral Res. 91:20–22 [DOI] [PubMed] [Google Scholar]
- 10.Monto AS, McKimm-Breschkin JL, Macken C, Hampson AW, Hay A, Klimov A, Tashiro M, Webster RG, Aymard M, Hayden FG, Zambon M. 2006. Detection of influenza viruses resistant to neuraminidase inhibitors in global surveillance during the first 3 years of their use. Antimicrob. Agents Chemother. 50:2395–2402 [DOI] [PMC free article] [PubMed] [Google Scholar]
- 11.Gubareva LV, Matrosovich MN, Brenner MK, Bethell RC, Webster RG. 1998. Evidence for zanamivir resistance in an immunocompromised child infected with influenza B virus. J. Infect. Dis. 178:1257–1262 [DOI] [PubMed] [Google Scholar]
- 12.Hatakeyama S, Sugaya N, Ito M, Yamazaki M, Ichikawa M, Kimura K, Kiso M, Shimizu H, Kawakami C, Koike K, Mitamura K, Kawaoka Y. 2007. Emergence of influenza B viruses with reduced sensitivity to neuraminidase inhibitors. JAMA 297:1435–1442 [DOI] [PubMed] [Google Scholar]
- 13.Kawai N, Ikematsu H, Iwaki N, Maeda T, Satoh I, Hirotsu N, Kashiwagi S. 2006. A comparison of the effectiveness of oseltamivir for the treatment of influenza A and influenza B: a Japanese multicenter study of the 2003-2004 and 2004-2005 influenza seasons. Clin. Infect. Dis. 43:439–444 [DOI] [PubMed] [Google Scholar]
- 14.Sugaya N, Tamura D, Yamazaki M, Ichikawa M, Kawakami C, Kawaoka Y, Mitamura K. 2008. Comparison of the clinical effectiveness of oseltamivir and zanamivir against influenza virus infection in children. Clin. Infect. Dis. 47:339–345 [DOI] [PubMed] [Google Scholar]
- 15.Hurt AC, Iannello P, Jachno K, Komadina N, Hampson AW, Barr IG, McKimm-Breschkin JL. 2006. Neuraminidase inhibitor-resistant and -sensitive influenza B viruses isolated from an untreated human patient. Antimicrob. Agents Chemother. 50:1872–1874 [DOI] [PMC free article] [PubMed] [Google Scholar]
- 16.Sleeman K, Sheu TG, Moore Z, Kilpatrick S, Garg S, Fry AM, Gubareva LV. 2011. Influenza B viruses with mutation in the neuraminidase active site, North Carolina, U. S. A., 2010-11. Emerg. Infect. Dis. 17:2043–2046 [DOI] [PMC free article] [PubMed] [Google Scholar]
- 17.WHO 2012. WHO working group on surveillance of influenza antiviral susceptibility. Wkly. Epidemiol. Rec. 87(39):369–374 [PubMed] [Google Scholar]
- 18.Nguyen HT, Sheu TG, Mishin VP, Klimov AI, Gubareva LV. 2010. Assessment of pandemic and seasonal influenza A (H1N1) virus susceptibility to neuraminidase inhibitors in three enzyme activity inhibition assays. Antimicrob. Agents Chemother. 54:3671–3677 [DOI] [PMC free article] [PubMed] [Google Scholar]
- 19.Lin YP, Gregory V, Collins P, Kloess J, Wharton S, Cattle N, Lackenby A, Daniels R, Hay A. 2010. Neuraminidase receptor binding variants of human influenza A(H3N2) viruses resulting from substitution of aspartic acid 151 in the catalytic site: a role in virus attachment? J. Virol. 84:6769–6781 [DOI] [PMC free article] [PubMed] [Google Scholar]
- 20.Okomo-Adhiambo M, Nguyen HT, Sleeman K, Sheu TG, Deyde VM, Garten RJ, Xu X, Shaw MW, Klimov AI, Gubareva LV. 2010. Host cell selection of influenza neuraminidase variants: implications for drug resistance monitoring in A(H1N1) viruses. Antiviral Res. 85:381–388 [DOI] [PubMed] [Google Scholar]
- 21.Yang W, Liu X, Peng X, Li P, Wang T, Tai G, James Li X, Zhou Y. 2012. Synthesis of novel N-acetylneuraminic acid derivatives as substrates for rapid detection of influenza virus neuraminidase. Carbohydr. Res. 359:92–96 [DOI] [PMC free article] [PubMed] [Google Scholar]
- 22.Okomo-Adhiambo M, Sleeman K, Ballenger K, Nguyen HT, Mishin VP, Sheu TG, Smagala J, Li Y, Klimov AI, Gubareva LV. 2010. Neuraminidase inhibitor susceptibility testing in human influenza viruses: a laboratory surveillance perspective. Viruses 2:2269–2289 [DOI] [PMC free article] [PubMed] [Google Scholar]
- 23.Gubareva LV, Webster RG, Hayden FG. 2002. Detection of influenza virus resistance to neuraminidase inhibitors by an enzyme inhibition assay. Antiviral Res. 53:47–61 [DOI] [PubMed] [Google Scholar]
- 24.Nguyen HT, Trujillo AA, Sheu TG, Levine M, Mishin VP, Shaw M, Ades EW, Klimov AI, Fry AM, Gubareva LV. 2012. Analysis of influenza viruses from patients clinically suspected of infection with an oseltamivir resistant virus during the 2009 pandemic in the United States. Antiviral Res. 93:381–386 [DOI] [PubMed] [Google Scholar]
- 25.Sheu TG, Deyde VM, Okomo-Adhiambo M, Garten RJ, Xu X, Bright RA, Butler EN, Wallis TR, Klimov AI, Gubareva LV. 2008. Surveillance for neuraminidase inhibitor resistance among human influenza A and B viruses circulating worldwide from 2004 to 2008. Antimicrob. Agents Chemother. 52:3284–3292 [DOI] [PMC free article] [PubMed] [Google Scholar]
- 26.Shu B, Wu KH, Emery S, Villanueva J, Johnson R, Guthrie E, Berman L, Warnes C, Barnes N, Klimov A, Lindstrom S. 2011. Design and performance of the CDC real-time reverse transcriptase PCR swine flu panel for detection of 2009 A (H1N1) pandemic influenza virus. J. Clin. Microbiol. 49:2614–2619 [DOI] [PMC free article] [PubMed] [Google Scholar]
- 27.Bright RA, Shay DK, Shu B, Cox NJ, Klimov AI. 2006. Adamantane resistance among influenza A viruses isolated early during the 2005-2006 influenza season in the United States. JAMA 295:891–894 [DOI] [PubMed] [Google Scholar]
- 28.Deyde VM, Sheu TG, Trujillo AA, Okomo-Adhiambo M, Garten R, Klimov AI, Gubareva LV. 2010. Detection of molecular markers of drug resistance in 2009 pandemic influenza A (H1N1) viruses by pyrosequencing. Antimicrob. Agents Chemother. 54:1102–1110 [DOI] [PMC free article] [PubMed] [Google Scholar]
- 29.Baker NJ, Gandhi SS. 1976. Effect of Ca++ on the stability of influenza virus neuraminidase. Arch. Virol. 52:7–18 [DOI] [PubMed] [Google Scholar]
- 30.Souza TM, Salluh JI, Bozza FA, Mesquita M, Soares M, Motta FC, Pitrowsky MT, de Lourdes Oliveira M, Mishin VP, Gubareva LV, Whitney A, Rocco SA, Goncalves VM, Marques VP, Velasco E, Siqueira MM. 2010. H1N1pdm influenza infection in hospitalized cancer patients: clinical evolution and viral analysis. PLoS One 5:e14158. 10.1371/journal.pone.0014158 [DOI] [PMC free article] [PubMed] [Google Scholar]
- 31.Dharan NJ, Gubareva LV, Meyer JJ, Okomo-Adhiambo M, McClinton RC, Marshall SA, St George K, Epperson S, Brammer L, Klimov AI, Bresee JS, Fry AM, Oseltamivir-Resistance Working Group 2009. Infections with oseltamivir-resistant influenza A(H1N1) virus in the United States. JAMA 301:1034–1041 [DOI] [PubMed] [Google Scholar]
- 32.Hurt AC, Ernest J, Deng YM, Iannello P, Besselaar TG, Birch C, Buchy P, Chittaganpitch M, Chiu SC, Dwyer D, Guigon A, Harrower B, Kei IP, Kok T, Lin C, McPhie K, Mohd A, Olveda R, Panayotou T, Rawlinson W, Scott L, Smith D, D'Souza H, Komadina N, Shaw R, Kelso A, Barr IG. 2009. Emergence and spread of oseltamivir-resistant A(H1N1) influenza viruses in Oceania, South East Asia and South Africa. Antiviral Res. 83:90–93 [DOI] [PubMed] [Google Scholar]
- 33.Meijer A, Lackenby A, Hungnes O, Lina B, van-der Werf S, Schweiger B, Opp M, Paget J, van de-Kassteele J, Hay A, Zambon M. 2009. Oseltamivir-resistant influenza virus A (H1N1), Europe, 2007-08 season. Emerg. Infect. Dis. 15:552–560 [DOI] [PMC free article] [PubMed] [Google Scholar]
- 34.Kawai N, Ikematsu H, Hirotsu N, Maeda T, Kawashima T, Tanaka O, Yamauchi S, Kawamura K, Matsuura S, Nishimura M, Iwaki N, Kashiwagi S. 2009. Clinical effectiveness of oseltamivir and zanamivir for treatment of influenza A virus subtype H1N1 with the H274Y mutation: a Japanese, multicenter study of the 2007-2008 and 2008-2009 influenza seasons. Clin. Infect. Dis. 49:1828–1835 [DOI] [PubMed] [Google Scholar]
- 35.Kawai N, Ikematsu H, Iwaki N, Kondou K, Hirotsu N, Kawashima T, Maeda T, Tanaka O, Doniwa K, Kashiwagi S. 2009. Clinical effectiveness of oseltamivir for influenza A(H1N1) virus with H274Y neuraminidase mutation. J. Infect. 59:207–212 [DOI] [PubMed] [Google Scholar]
- 36.Barrett S, Mohr PG, Schmidt PM, McKimm-Breschkin JL. 2011. Real time enzyme inhibition assays provide insights into differences in binding of neuraminidase inhibitors to wild type and mutant influenza viruses. PLoS One 6:e23627. 10.1371/journal.pone.0023627 [DOI] [PMC free article] [PubMed] [Google Scholar]
- 37.Okomo-Adhiambo M, Demmler-Harrison GJ, Deyde VM, Sheu TG, Xu X, Klimov AI, Gubareva LV. 2010. Detection of E119V and E119I mutations in influenza A (H3N2) viruses isolated from an immunocompromised patient: challenges in diagnosis of oseltamivir resistance. Antimicrob. Agents Chemother. 54:1834–1841 [DOI] [PMC free article] [PubMed] [Google Scholar]
Associated Data
This section collects any data citations, data availability statements, or supplementary materials included in this article.