

Abstract
Clostridium beijerinckii is a well-known solvent-producing microorganism with great potential for biofuel and biochemical production. To better understand and improve the biochemical pathway to solvents, the development of genetic tools for engineering C. beijerinckii is highly desired. Based on mobile group II intron technology, a targetron gene knockout system was developed for C. beijerinckii in this study. This system was successfully employed to disrupt acid production pathways in C. beijerinckii, leading to pta (encoding phosphotransacetylase)- and buk (encoding butyrate kinase)-negative mutants. In addition to experimental characterization, the mutant phenotypes were analyzed in the context of our C. beijerinckii genome-scale model. Compared to those of the parental strain (C. beijerinckii 8052), acetate production in the pta mutant was substantially reduced and butyrate production was remarkably increased, while solvent production was dependent on the growth medium. The pta mutant also produced much higher levels of lactate, suggesting that disrupting pta influenced the energy generation and electron flow pathways. In contrast, acetate and butyrate production in the buk mutant was generally similar to that of the wild type, but solvent production was consistently 20 to 30% higher and glucose consumption was more rapid and complete. Our results suggest that the acid and solvent production of C. beijerinckii can be effectively altered by disrupting the acid production pathways. As the gene disruption method developed in this study does not leave any antibiotic marker in a disrupted allele, multiple and high-throughput gene disruption is feasible for elucidating genotype and phenotype relationships in C. beijerinckii.
INTRODUCTION
The finite nature of fossil fuel resources, as well as the associated environmental implications of releasing excess carbon dioxide into the atmosphere, provides an impetus for alternative bio-based fuels and chemicals from renewable sources. Solvents such as acetone, butanol, and ethanol (ABE) are important chemicals and potential fuels that can be produced by microbial fermentation of biomass. Biobutanol has been of particular interest because of its various advantages as a biofuel and considerable value as an industrial chemical feedstock (1). Clostridium beijerinckii is a well-suited microorganism for solvent production, as it grows on and utilizes a broad range of substrates, including simultaneous utilization of five- and six-carbon sugars formed during the breakdown of cellulosic materials. Importantly, C. beijerinckii has also demonstrated one of the highest reported butanol production capabilities (2, 3). Metabolic engineering is a powerful strategy for investigating the complex metabolism of solventogenic clostridia and building strains with improved solvent production. Genetic engineering tools for the manipulation of solventogenic clostridia are improving (4, 5); however, the lack of highly efficient transformation protocols and amenable genetic engineering systems for C. beijerinckii has been a major bottleneck in the construction of mutant strains for this species.
The mobile group II intron Ll.LtrB from Lactococcus lactis is a site-specific retroelement that can invade its cognate intron-minus gene (6). Through a retrohoming mechanism, the excised intron lariat RNA can be inserted into a DNA target site in a site-specific manner, after which it is reverse transcribed by the associated intron-encoded enzyme protein (IEP) (7). TargeTron (Sigma-Aldrich) is a gene knockout system developed for rapid and specific disruption of bacterial genes by insertion of the mobile group II introns. The DNA target site is recognized primarily by base-pairing of easily modified intron RNA sequences, so the intron can be inserted into virtually any specific DNA target sites (8). Targetron gene knockout systems have been successfully employed in many Gram-positive and Gram-negative bacteria, including several clostridial species (4–6, 8–12).
It is well known that ABE are produced in the solventogenic clostridia through a biphasic fermentation process: acetate and butyrate are produced first during the acidogenic phase, after which these acids are reassimilated and solvents are produced during the solventogenic phase. Acid production in the acidogenic phase is significant and has been shown to play important roles in the switch to solventogenesis (13–16). The inactivation of acetate and butyrate formation pathways in Clostridium acetobutylicum ATCC 824 has been shown to lead to modified product patterns and different cell physiology (4, 12, 17–19).
Therefore, the objectives of the present study were to (i) develop a highly efficient gene knockout system for C. beijerinckii using the mobile group II intron technology and (ii) use the C. beijerinckii-specific system to investigate changes to solvent production in strains lacking the primary acetate- and butyrate-producing genes. The functionality of the new genetic toolbox and the characterization of the developed pta- and buk-negative mutants presented herein are expected to serve as an important foundation for understanding the solvent production mechanisms and to further engineer C. beijerinckii strains.
MATERIALS AND METHODS
Strains, growth conditions, plasmids, and oligonucleotides.
Turbo competent Escherichia coli cells (New England BioLabs Inc., Ipswich, MA) and TOP10 competent E. coli cells (Invitrogen, Grand Island, NY) were used for cloning and were grown aerobically at 37°C in LB medium supplemented with 100 μg/ml of ampicillin or 50 μg/ml of kanamycin as appropriate. C. beijerinckii 8052 was grown anaerobically at 35°C in tryptone-glucose-yeast extract (TGY) medium containing 30 g/liter of tryptone, 20 g/liter of glucose, 10 g/liter of yeast extract, and 1 g/liter of l-cysteine (20), supplemented with 25 μg/ml of erythromycin as needed. All bacterial cultures, plasmids, and oligonucleotides used in this study are listed in Table S1 in the supplemental material.
Plasmid construction.
A schematic diagram for construction of the targetron plasmid is described in Fig. S1 in the supplemental material. The L1.LtrB intron with its IEP gene (ltrA) was first amplified from pJIR750ai (8) (Sigma-Aldrich, St. Louis, MO) by PCR using primers Intron-F (an XmaI site was introduced for later intron retargeting) and Intron-R (see Table S1 in the supplemental material); it was then integrated into the cloning site of the TOPO XL PCR cloning vector (Invitrogen, Grand Island, NY). To successfully transcribe the intron DNA into C. beijerinckii, a promoter region of the phosphate butyryltransferase gene (ptb) was amplified from C. beijerinckii 8052 genomic DNA using the primers ptb-p-F and ptb-p-R. This was then inserted upstream of the intron fragment into the TOPO XL PCR cloning vector between the HindIII and SpeI cloning sites. Finally, the intron fragment along with the ptb promoter was cloned from the cloning vector into the NsiI site of the E. coli-C. beijerinckii shuttle vector pTJ1, which was modified from plasmid pYL102E as described previously (21, 22). The direction of the intron fragment was verified by Sanger DNA sequencing, and a desirable construct (as indicated in Fig. S1), named pYW1, was used for following intron retargeting and gene manipulation.
The LtrB intron insertion sites for pta (Cbei_1164) and buk (Cbei_0204) were predicted using online intron design software (TargeTron gene knockout system; Sigma-Aldrich, St. Louis, MO), and the primer sequences were generated for intron retargeting. To construct plasmid pYW1-pta, PCR was performed to retarget the RNA portion of the intron. The intron PCR template from the TargeTron gene knockout system kit (Sigma-Aldrich) and the following four primers were used for the PCR experiment: pta-17/18a-IBS, pta-17/18a-EBS1d, pta-17/18a-EBS2, and EBS universal primer (see Table S1 in the supplemental material). The XmaI and BsrGI restriction sites were introduced into the 350-bp PCR product during the PCR. The 350-bp DNA fragment was subsequently cloned into the XmaI and BsrGI sites of pYW1. This resulted in a plasmid, pYW1-pta, specific for pta knockout by insertion of the intron fragment between the 17th and 18th base pairs in the antisense direction. By employing the same procedure, another targetron plasmid, pYW1-buk, was generated using primers buk-532/533s-IBS, buk-532/533s-EBS1d, buk-532/533s-EBS2, and EBS universal (see Table S1). This allowed insertion of the intron fragment between the 532nd and 533rd base pairs in the sense direction.
Transformation.
The targetron plasmids were first chemically transformed into Turbo competent E. coli cells (New England BioLabs Inc., Ipswich, MA). Plasmids isolated from the correct clones were then transformed into C. beijerinckii 8052 using electroporation, as described previously (22). Laboratory stocks of C. beijerinckii 8052 spores were heat shocked at 80°C for 10 min, cooled on ice for 5 min, and inoculated into TGY medium with a 1% inoculation ratio as described previously (20). The culture was grown anaerobically overnight at 35°C in an N2-CO2-H2 (volume ratio of 85:10:5) atmosphere. When the optical density (OD) of the culture at 600 nm reached 0.8 to 1.0, the cells were harvested by centrifugation at 3,000 × g for 10 min at 4°C. The cell pellet was washed with 1 volume of ice-cold 10% (wt/vol in H2O) polyethylene glycol 8000 (PEG 8000; Sigma-Aldrich, St. Louis, MO) and spun down, again at 3,000 × g for 10 min at 4°C. The resulting cell pellet was resuspended in 5% volume (compared to the initial volume of cell culture for centrifugation) of ice-cold 10% PEG 8000 and used immediately for electroporation.
For each transformation, 400 μl of electrocompetent C. beijerinckii 8052 cell suspension was mixed with 1.0 μg of plasmid DNA and then added into a 0.2-cm precooled electroporation cuvette and incubated on ice for 10 min. A Gene Pulser Xcell electroporation system (Bio-Rad Laboratories, Hercules, CA) was connected to the anaerobic chamber to enable electroporation within the chamber. Electroporation was carried out using the following conditions: 2,000 V of voltage, 25 μF of capacitance, and 200 Ω of resistance. The cuvette was then placed on ice for 10 min. Afterward, the cells were transferred into 1.6 ml of TGY and incubated at 35°C for 6 h for recovery. The recovered cells were plated onto TGY agar plates containing 25 μg/ml of erythromycin and incubated at 35°C under anaerobic conditions. Erythromycin-resistant colonies were picked for colony PCR to detect the intron insertions, using primers pta-17/18a-F and pta-17/18a-R and primers buk-532/533s-F and buk-532/533s-R (see Table S1 in the supplemental material) to detect pta and buk targetron insertions, respectively. Further confirmation was carried out with junction PCR using one primer flanking the gene site and the other inside the intron.
Plasmid curing.
The donor plasmid in the mutant was cured by subculturing the cells in TGY liquid medium without erythromycin pressure (23). After 7 or 8 cycles of subculturing, the cells were spread onto TGY agar plates without erythromycin and incubated anaerobically at 35°C. Colonies were screened by colony PCR using plasmid-specific primers pYW1-cure-F and pYW1-cure-R (see Table S1). Colonies lacking PCR products were picked and incubated in liquid medium for further characterization.
Southern blotting.
The genomic DNA of wild-type C. beijerinckii 8052 and the knockout mutants (plasmid cured) was extracted using the FastDNA spin kit (MP Biomedicals, Santa Ana, CA) according to the manufacturer's protocol. A total of 10 μg of genomic DNA was digested with HindIII for C. beijerinckii pta::int(17) and doubly digested with AvaI and MscI for C. beijerinckii buk::int(532), neither of which cuts the inserted intron fragment. The digested DNA was separated by electrophoresis on a 1.0% agarose gel. The DNA was then transferred onto a nylon membrane, hybridized, and detected using the DIG High Prime DNA labeling and detection starter kit, according to the instruction manual (Roche Diagnostics, Mannheim, Germany). The detection probe was amplified by PCR using the intron-specific primers Intron-SB-F and Intron-SB-R (see Table S1), with pYW1 plasmid DNA as the template (23). The probe was labeled with digoxigenin (DIG)-dUTP from the DIG-DNA labeling and detection kit by following the specified protocol.
Fermentation experiments.
After the donor plasmid was cured, the positive knockout mutant strains were cultivated anaerobically in P2 medium (24), and spore stocks were harvested as described earlier (25). Spores were heat shocked at 80°C for 10 min, followed by cooling on ice for 5 min. The heat-shocked spores were inoculated at a 1% inoculum level into TGY medium. The TGY culture was incubated at 35 ± 1°C for 12 to 14 h in an anaerobic chamber under an N2-CO2-H2 (volume ratio of 85:10:5) atmosphere. Subsequently, actively growing preculture was inoculated at a 5% ratio (vol/vol) into a model solution containing 60 g/liter of glucose, 1 g/liter of yeast extract, and filter-sterilized P2 or modified P2 (MP2) medium (13, 24) in BioFlo 115 benchtop bioreactors (New Brunswick Scientific Co., Enfield, CT) with a working volume of 1.5 liters. The P2 medium contained the following compounds (in g/liter): KH2PO4, 0.5; K2HPO4, 0.5; CH3COONH4, 2.2; MgSO4·7H2O, 0.2; MnSO4·H2O, 0.01; FeSO4·7H2O, 0.01; NaCl, 0.01; p-aminobenzoic acid, 0.001; thiamine-HCl, 0.001; and biotin, 0.00001. The MP2 medium (a modified P2 medium) matched the P2 medium except that the 2.2 g/liter of CH3COONH4 was replaced with 2 g/liter of (NH4)2SO4, and 2-(N-morpholino)ethanesulfonic acid (MES) (100 mM) (Sigma-Aldrich Co. LLC, St. Louis, MO) was added to prevent overacidification (13). Oxygen-free nitrogen was flushed through the broth to initiate anaerobiosis until the culture initiated its own gas production (CO2 and H2). Temperature and stirring were controlled at 35 ± 1°C and 55 rpm, respectively. Cell density and product concentration were monitored throughout the course of the fermentation. The pH profiles were recorded in real time using the NBS BioCommand software (New Brunswick Scientific Co.). Each fermentation was conducted in duplicate.
Culture growth and fermentation product analysis.
Culture growth was measured by following optical density (OD) in the fermentation broth at 600 nm using a Beckman Coulter DU 640B UV-visible (UV-Vis) spectrophotometer (Beckman Coulter, Inc., Indianapolis, IN). ABE and butyric acid concentrations were quantified using gas chromatography as previously described (20), while glucose, acetic acid, and lactic acid concentrations were quantified using high-performance liquid chromatography (Agilent Technologies 1200 series) equipped with a refractive index (RI) detector using a Rezex ROA-organic acid H+ (8%) column (Phenomenex Inc., Torrance, CA). The column was eluted with 0.005 N H2SO4 at a flow rate of 0.6 ml/min at 50°C (26).
Enzyme assays.
Cells of both the C. beijerinckii wild-type strain and mutant strains grown in P2 medium (60 g/liter of glucose and 1 g/liter of yeast extract) were harvested during late exponential growth phase and stored at −80°C if not analyzed immediately. The cell pellets were resuspended in 0.1 M Tris-HCl buffer (pH 7.6) and disrupted by sonication using a Microson XL-2000 ultrasonic cell disruptor (Misonix, Inc., Farmingdale, NY). The cell extract was centrifuged at 13,000 rpm for 10 min at 4°C. The supernatant was used immediately for enzyme assays. The total protein concentration was determined using the Pierce bicinchoninic acid (BCA) protein assay kit (Thermo Fisher Scientific, Waltham, MA) according to the manufacturer's protocol.
Phosphotransacetylase (Pta) and phosphotransbutyrylase (Ptb) activities were determined by monitoring the rate of coenzyme A (CoA) formation from acetyl-CoA (for Pta) or butyryl-CoA (for Ptb) with 5,5′-dithio-(2-nitro-benzonic acid) (DTNB) (13, 27). The assay mixture contained (in 1 ml) 0.1 M potassium phosphate buffer (PPB) (pH 7.4), 0.2 mM acetyl-CoA (for Pta) or butyryl-CoA (for Ptb), 0.08 mM DTNB, and 0.1 ml of crude cell extract. The change in absorbance was followed at 405 nm. The molar extinction coefficient of DTNB (E405) is 13.6 mM−1 · cm−1 (13). Acetate kinase (Ack) and butyrate kinase (Buk) activities were determined according to the hydroxamate method described by Rose (28), with an end product molar extinction coefficient of 0.691 mM−1 · cm−1 at 540 nm (13).
Model iCM925 simulations.
Our C. beijerinckii genome-scale model was employed to explore the metabolic network of each mutant strain and provide explanations for alternative network routes (29). To aid in defining the metabolic network state of the observed phenotype, uptake and secretion rates were calculated for glucose, acetate, butyrate, acetone, butanol, and ethanol. Rates were calculated for the wild type, pta::int(17), and buk::int(532) strains when grown on MP2 medium according to the following equation (30):
In this equation, [metabolite] is the metabolite concentration in mmol/liter, [biomass] is the cell concentration in grams (dry weight)/liter, and μ is the growth rate. The yield, Δ[metabolite]/Δ[biomass], was determined by plotting metabolite concentration against biomass concentration. Growth rate was found by fitting the biomass production profile to a two-parameter exponential growth equation.
Network states were only analyzed using model iCM925 for growth on MP2 medium because it does not contain acetate, thereby minimizing compounding effects due to simultaneous acetate production and consumption. Production rates from the acidogenesis phase (∼first 25 h of the fermentation) were used to focus the observed acetate and butyrate production in the pta- and buk-negative mutants.
To simulate each mutant, the upper and lower bounds of the model reactions corresponding to the gene knockouts being simulated were set to zero, preventing flux through these reactions. In the model, the Cbei_1164 gene that was knocked out in the pta::int(17) mutant corresponds to the following reaction:
and the Cbei_0204 gene that was knocked out in the buk::int(532) mutant corresponds to
To ensure accurate representation of the observed phenotype for each mutant, the flux through the biomass reaction, glucose uptake reaction, and acetate, butyrate, acetone, butanol, and ethanol secretion reactions were constrained by setting the upper and lower bounds of each reaction to be within 10% of the calculated rate. Flux variability analysis was used to determine the flux range of each reaction in the model (31). Simulations were run in MATLAB using the COBRA Toolbox (32), with GUROBI 5.1.0 as the solver (33).
RESULTS
Construction and verification of C. beijerinckii mutants.
There are three annotated butyrate kinase genes in C. beijerinckii 8052: Cbei_0204 (buk, orthologous to CA_C3075 in C. acetobutylicum [12]), Cbei_4006 (bukII), and Cbei_4609 (bukIII). Based on our previous transcriptional analysis (20), buk was the only actively transcribed butyrate kinase gene, and it is co-operonic with the upstream ptb gene, constituting the canonical ptb-buk pathway for butyrate formation. Thus, buk (but not bukII or bukIII) was selected as the target for disruption in this study. The mobile group II intron-expressing vectors that were retargeted for pta and buk were constructed and introduced into C. beijerinckii 8052 wild-type cells through electroporation. Cells transformed with these vectors produced erythromycin-resistant colonies on TGY agar plates. Colony PCR was performed using targeted gene-specific primers flanking the intron insertion sites to screen positive transformants for the desired gene disruption (Fig. 1). Specifically, two colonies out of seven for pta and six out of seven for buk were identified as positive knockout transformants during the initial screening process. When (in most cases) the screened colony PCR mixture contained both the wild-type PCR fragment and the PCR fragment with the intron insertion (which was 915 bp longer), this colony was restreaked on erythromycin-containing plates; colony PCR was repeated until a pure intron-containing PCR band was identified. In this manner, a homogeneous targeted gene knockout mutant was obtained. Colony PCR was also performed on the positive mutant colonies to confirm the correct insertion sites and intron orientation using one primer flanking in the intron fragment and the other in the opposite strand of the targeted gene (Fig. 1).
Fig 1.

Colony PCR results indicated that group II intron-based vectors efficiently targeted the C. beijerinckii 8052 pta (in the antisense direction) and buk (in the sense direction) genes. (A and B) Introns were inserted in the antisense and sense directions, respectively: PCR products with gene-specific primers from mutants would be 915 bp longer than those from the wild type, while in PCR with a gene-specific primer and an intron-specific primer amplified across gene-intron junctions in mutants, no product was amplified from the wild type (panels A and B are modified from the Sigma-Aldrich TargeTron user manual). (C) PCR with pta gene-specific primers produced a longer product from the mutant (lane 1) than from the wild type (lane 4); PCR with a gene-specific primer and an intron-specific primer obtained PCR products with mutants but not with the wild type (lane 2, PCR product from the mutant with pta-17/18a-F and EBS2 primers; lane 3, PCR product from the mutant with pta-17/18a-R and EBS universal primers; lane 5, control from the wild type for lane 2; lane 6, control from the wild type for lane 3). (D) PCR with buk gene-specific primers produced longer product from the mutant (lane 1) than from the wild type (lane 4); PCR with a gene-specific primer and an intron-specific primer obtained PCR products with mutants but not with the wild type (lane 2, PCR product from mutant with buk-532/533s-F and EBS universal primers; lane 3, PCR product from the mutant with buk-532/533s-R and EBS2 primers; lane 5, control from the wild type for lane 2; lane 6, control from the wild type for lane 3). Lane M, 100-bp DNA marker (New England BioLabs Inc., Ipswich, MA); the numbers on the left are the corresponding marker lengths, in bp.
The donor plasmid was cured from the mutants before further characterization and fermentation experiments by subculturing in TGY medium in the absence of antibiotic pressure. Southern blotting was performed on genomic DNA from the mutant strains after plasmid curing using an intron-specific hybridization probe (Fig. 2; see also Table S1 in the supplemental material). Wild-type genomic DNA and the donor plasmid were used as negative and positive controls, respectively. As illustrated in Fig. 2, the pta and buk mutants both demonstrated single blotting bands with expected sizes of 2.9 and 3.7 kb, respectively. The donor plasmids as the positive controls showed bands with sizes of 6.5 and 1.9 kb, respectively, while the wild-type chromosomal DNA demonstrated no band. The Southern hybridization results further confirmed the specific gene disruption following intron insertion, with donor plasmids successfully cured in the resultant mutants.
Fig 2.
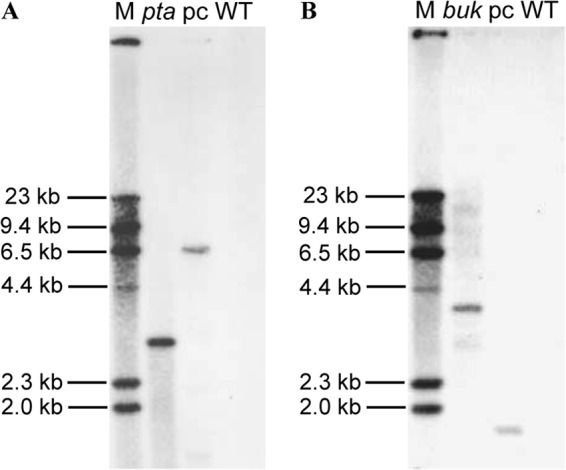
Southern blotting with an intron-specific probe confirmed the intron insertions in the chromosomal DNA of the C. beijerinckii mutants. (A) Digestion with HindIII. A single band of 2.9 kb was detected in C. beijerinckii pta::int(17), a single band of 6.5 kb was detected in pYW1 donor plasmid (positive control), while no band was detected in the wild-type (negative control). (B) Digestion with AvaI and MscI. A single band of 3.7 kb was detected in C. beijerinckii buk::int(532), a single band of 1.9 kb was detected in the pYW1 donor plasmid (positive control), while no band was detected in the wild-type (negative control). Lane M, marker; pta, C. beijerinckii pta::int(17); buk, C. beijerinckii buk::int(532); pc, positive control; WT, wild type.
Fermentation characterization using P2 medium.
Fermentation experiments were carried out using P2 medium. Cell growth (Fig. 3A), glucose consumption (Fig. 3B), pH variation (Fig. 3C), acetate and butyrate profiles (Fig. 3D), lactate profiles (Fig. 3E), and solvent profiles (Fig. 3F) are illustrated in Fig. 3. Both the pta and buk mutants displayed growth kinetics similar to those of the wild-type strain (rapid growth and a short lag phase), and similar growth rates were observed for all three strains (Table 1). C. beijerinckii pta::int(17) consumed only 33 g/liter of glucose within the 80-h fermentation, while the wild-type strain consumed 40 g/liter over the same period. On the other hand, C. beijerinckii buk::int(532) utilized almost all the 60 g/liter of glucose in <45 h. The pH profiles indicated clear breakpoints between 7 and 10 h for all three strains, corresponding to the time points for the initiation of solvent production. It is interesting that, with acid reassimilation occurring in all three strains, the pH first increased to peak values at approximately 20 h and then decreased again to lower levels, after which the pH increased back to above 5.5 for the wild type and C. beijerinckii pta::int(17) but remained at approximately 5.2 for C. beijerinckii buk::int(532).
Fig 3.

Batch fermentation profiles of the C. beijerinckii knockout mutants compared to the wild type using standard P2 medium. Fermentations were performed with 60 g/liter of glucose and 1 g/liter of yeast extract as the carbon sources. (A) Cell growth; (B) glucose consumption; (C) pH profiles; (D) acetate and butyrate profiles; (E) lactate profiles; (F) solvent production profiles.
Table 1.
Summary of fermentation results for the C. beijerinckii knockout mutants compared to the wild-type straina
| Characteristic | Value in: |
|||||
|---|---|---|---|---|---|---|
| P2 medium |
MP2 medium |
|||||
| WT | pta | buk | WT | pta | buk | |
| Growth rate (/h) | 0.13 | 0.11 | 0.12 | 0.11 | 0.06 | 0.07 |
| Butanol (g/liter) | 9.9 | 9.1 | 12.7 | 10.6 | 12.4 | 12.2 |
| Butanol yield (g/g of glucose) | 0.25 | 0.28 | 0.24 | 0.22 | 0.23 | 0.23 |
| Acetone (g/liter) | 4.4 | 3.4 | 5.6 | 4.2 | 5.3 | 4.9 |
| Ethanol (g/liter) | 0.2 | 0.1 | 0.3 | 0.4 | 0.4 | 0.4 |
| Total ABE (g/liter)b | 14.5 | 12.6 | 18.6 | 15.2 | 18.1 | 17.5 |
| ABE yield (g/g of glucose) | 0.37 | 0.38 | 0.35 | 0.32 | 0.34 | 0.33 |
| ABE productivity (g/liter/h) | 0.18 | 0.20 | 0.42 | 0.19 | 0.25 | 0.24 |
| Peak acetic acid (g/liter)c | 1.64 | 1.39 | 1.81 | 1.01 | 0.51 | 1.00 |
| Peak butyric acid (g/liter) | 1.00 | 1.53 | 0.97 | 0.76 | 0.88 | 0.80 |
| Peak lactic acid (g/liter) | 0.08 | 0.13 | 0.02 | 0.18 | 0.60 | 0.17 |
| Carbon recovery (%) | 87.9 | 91.6 | 87.1 | 79.5 | 86.1 | 85.6 |
WT, wild type; pta, pta knockout mutant [C. beijerinckii pta::int(17)]; buk, buk knockout mutant [C. beijerinckii buk::int(532)].
The reported titers were the maximum values after the solvent production reached plateau.
There was approximately 1.3 g/liter of acetic acid preadded in the P2 medium.
Even with disruption of the pta and buk genes, acetic and butyric acids were still the main products during the acidogenic phase for all three strains, leading to a breakpoint pH prior to the switch to the solventogenic phase (Fig. 3C and D). Compared to the wild-type strain, the disruption of the canonical acetate formation pathway (pta-ack operon) in C. beijerinckii pta::int(17) led to a decline in the production of acetate and elevated production of butyrate (by 53%); the disruption of the canonical butyrate formation pathway (ptb-buk operon) in C. beijerinckii buk::int(532) led to slightly increased acetate production and similar levels of butyrate production compared to those of the wild type (see the acid peak levels in Fig. 3D and Table 1). Interestingly, for the wild type and C. beijerinckii pta::int(17), both acetate and butyrate levels had a second increase between 20 and 40 h after the fermentation switched to solvent production, which corresponded well to the second decrease of the pH profiles as indicated in Fig. 3C. However, for C. beijerinckii buk::int(532), there was no obvious second increase in the acid levels after the fermentation switched to solvent production even though a decline in pH was also observed in the same time frame. In addition to acetate and butyrate, low levels of lactate were also observed in all of the strains during the early acidogenic phase, with a peak value of <0.2 g/liter. The formation of solvents was detected 5 to 8 h into the fermentation for all of the strains, right after the observed pH breakpoints. Afterwards, butanol and acetone continued to increase until late stationary phase. Compared to the wild type, C. beijerinckii buk::int(532) finished the fermentation much more rapidly (in <45 h), with a much higher butanol (12.7 g/liter, versus 9.9 g/liter in wild type) and total ABE (18.6 g/liter, versus 14.5 g/liter in wild type) production; C. beijerinckii pta::int(17) took approximately the same time to finish the fermentation as the wild type, with slightly lower ABE production (Fig. 3F and Table 1).
Carbon recovery by all strains grown in P2 medium is summarized in Table 1. Carbon recovery percentage was defined as total product carbon divided by total substrate carbon multiplied by 100 (34). The amount of CO2 production was estimated as 33% of total carbon (35). Although the pta mutant had a slightly lower ABE production titer in the fermentation, it had a 4% higher carbon recovery than did the wild-type strain, while the carbon recovery for the buk mutant was very similar to that of the wild-type strain.
Fermentation characterization using MP2 medium.
The mutant strains were further characterized using the acetate-deficient MP2 medium, which incorporated MES as the buffering reagent. The cell growth (Fig. 4A), glucose consumption (Fig. 4B), pH variation (Fig. 4C), acetate and butyrate profiles (Fig. 4D), lactate profiles (Fig. 4E), and solvent profiles (Fig. 4F) are illustrated in Fig. 4. All of the strains demonstrated a lag phase of around 10 h before the cells started active growth. Both of the pta and buk mutants showed growth kinetics similar to those of the wild type, and they all grew to maximum optical densities similar to those in the fermentations with P2 medium. Both of the pta and buk mutants consumed sugars more rapidly and degraded more glucose than the wild type (Fig. 4B). The pH profiles were similar in all three strains. After a lag phase of about 10 h, the pH decreased to a breakpoint of approximately 5.6 and then increased slightly and kept constant for the wild type; a slight pH decrease was observed in both the pta and buk mutants after 35 h (Fig. 4C). Similar to when grown on P2 medium, the presumed inactivation of the canonical acetate or butyrate formation pathway did not eliminate the corresponding acid production. Compared to the wild type, C. beijerinckii pta::int(17) produced half as much acetate and 16% more butyrate, while C. beijerinckii buk::int(532) produced the same amount of acetate and, interestingly, even a little more butyrate than did the wild type (Fig. 4D and Table 1). Another noticeable phenomenon was that in the fermentation with MP2 medium, all three of the strains produced higher concentrations of lactate than when grown on P2 medium; this was especially true for C. beijerinckii pta::int(17), which had a peak level of 0.6 g/liter of lactate, even higher than the associated acetate production level. Consistent with the uptake of acetate and butyrate during the metabolic switch for solvent production, the produced lactate was also reassimilated in all strains. Approximately 70 h was needed for all three of the strains to complete the fermentation. Both pta and buk mutants produced around 20% more butanol and acetone than the wild type, while the production of ethanol did not exceed 0.4 g/liter in all strains (Fig. 4F and Table 1). In addition, both pta and buk mutants had around 6% higher carbon recovery than did the wild-type strain (Table 1).
Fig 4.

Batch fermentation profiles of the C. beijerinckii knockout mutants compared to the wild type using MP2 medium. Fermentations were performed with 60 g/liter of glucose and 1 g/liter of yeast extract as the carbon sources; 100 mM MES was added to prevent overacidification. (A) Cell growth; (B) glucose consumption; (C) pH profiles; (D) acetate and butyrate profiles; (E) lactate profiles; (F) solvent production profiles.
Enzymatic activity.
Enzymatic activities were measured in crude cell extracts of the mutants as well as the wild-type strain. As shown in Table 2, the disruption of the pta or buk gene significantly decreased the corresponding enzyme activities. However, remarkable residual activities were still observed (24% Pta activity in the pta mutant and 33% Buk activity in the buk mutant, compared to the wild-type strain). The disruption of pta led to a 53% decrease in Ack activity. In the pta mutant, the Ptb activity was increased by 25% and the Buk activity was slightly enhanced compared to that observed in the wild-type strain. It has been reported that in C. acetobutylicum, the Ptb activity associated with acetyl-CoA was negligible (36); however, it warrants further study in C. beijerinckii pta::int(17) to determine whether the enhanced Ptb activity contributed to the notable Pta residual activity. In the buk mutant, the disruption of buk led to a slight decrease (11%) in Ptb activity. The enzyme activities in the other acid formation branches (Pta and Ack) were not enhanced as was the case for Ptb and Buk in the pta mutant. On the contrary, the Pta activity and Ack activity in C. beijerinckii buk::int(532) were decreased by 13% and 33%, respectively.
Table 2.
Enzyme activities of C. beijerinckii knockout mutants and the wild-type strain
| Straina | Sp act (U/mg of protein)b |
|||
|---|---|---|---|---|
| Pta | Ack | Ptb | Buk | |
| WT | 24.4 ± 3.9 | 0.15 ± 0.02 | 12.6 ± 1.6 | 0.12 ± 0.01 |
| pta | 5.8 ± 0.6 | 0.07 ± 0.01 | 15.8 ± 2.5 | 0.13 ± 0.02 |
| buk | 21.2 ± 0.3 | 0.10 ± 0.01 | 11.2 ± 1.6 | 0.04 ± 0.01 |
WT, wild type; pta, pta knockout mutant [C. beijerinckii pta::int(17)]; buk, buk knockout mutant [C. beijerinckii buk::int(532)].
Pta, phosphotransacetylase; Ack, acetate kinase; Ptb, phosphate butyryltransferase (phosphotransbutyrylase); Buk, butyrate kinase.
Model iCM925 simulations.
The substrate uptake and product secretion rates calculated based on the experimental MP2 fermentation dynamics are summarized in Table 3. Growth was found to be slightly slower for both the pta- and buk-negative mutants than for the wild-type strain (Table 2), resulting in lower uptake rates and production rates for the mutant strains. Also, while acetate was still produced by the pta-negative mutant, the production rate was found to be significantly lower; in both the wild-type and buk-negative strains, the rate-based acetate yield (acetate rate/glucose rate) is 0.26, and in the pta-negative strain, it is only 0.13. The production rates of butyrate and butanol were found to be comparable for all three strains.
Table 3.
Calculated substrate uptake and product secretion rates in different strains based on the experimental MP2 fermentation results
| Straina | Calculated flux rate,b mmol/g (dry wt)/h |
|||||
|---|---|---|---|---|---|---|
| Glucose | Acetate | Butyrate | Acetone | Butanol | Ethanol | |
| WT | −10.1 | 2.68 | 2.49 | 3.23 | 5.87 | 0.30 |
| pta | −7.16 | 0.90 | 1.38 | 2.32 | 4.22 | 0.25 |
| buk | −6.71 | 1.76 | 1.40 | 2.37 | 4.11 | 0.21 |
WT, wild type; pta: pta knockout mutant [C. beijerinckii pta::int(17)]; buk, buk knockout mutant [C. beijerinckii buk::int(532)].
Experimentally observed flux rates for growth, glucose, acetate, butyrate, acetone, butanol, and ethanol (a negative rate depicts an uptake rate). Rates were calculated only for fermentation on MP2 medium, as this medium lacks acetate and therefore gives a clear picture of the acidogenesis phase.
Because acetate and butyrate production was observed in each corresponding knockout strain, it is advantageous to explore alternative mechanisms in C. beijerinckii that could enable production of these acids. To investigate alternative pathways for acid production, our C. beijerinckii genome-scale model was employed (29). The reconstructed knowledge in the model presents butyrate kinase to be the only reaction capable of producing butyrate; thus, the experimentally observed butyrate production in C. beijerinckii buk::int(532) is likely the result of an as-yet-uncharacterized mechanism, residual enzyme activity, or additional butyrate kinase-encoding genes. In contrast, there are eight reactions capable of producing acetate, three of which were found to carry flux within the boundaries of the experimentally derived rate constraints: aldehyde dehydrogenase (Cbei_0727 and Cbei_1953), cysteine synthase (Cbei_4356, Cbei_0577, Cbei_0622, and Cbei_0630), and acetylornithine deacetylase (Cbei_0145). These reactions offer possible mechanisms to the observed acetate production in C. beijerinckii pta::int(17); the corresponding production routes are pictured in Fig. 5.
Fig 5.

Alternative acetate production pathways for the pta mutant as predicted by model iCM925. (A) Aldehyde dehydrogenase route; (B) cysteine synthase route; (C) acetylornithine deacetylase route. The gray boxes indicate a secreted product, the empty boxes indicate an internal metabolite, and the dotted gray lines indicate a blocked reaction as a result of the gene deletion. The thicker dashed lines represent the suggested alternative acetate production mechanisms. The model abbreviations for the metabolites and reactions included in the diagram are listed in the bottom right, along with superscripts indicating the reference annotation database(s) for each reaction.
DISCUSSION
It is well accepted that C. beijerinckii is one of the most prominent solvent-producing clostridia. Advantageously, it can grow and produce solvents from a variety of substrates and over a broad pH range (2). Additionally, the C. beijerinckii BA101 hyper-butanol-producing mutant was shown to produce the highest reported titer of butanol in a batch fermentation (3). However, genetic engineering tools are very limited for this species, and thus, further genetic enhancement has been difficult. To overcome this challenge, a gene knockout system based on mobile group II intron technology was developed for C. beijerinckii in this study. The application of mobile group II intron-based genetic engineering systems has been reported for many other bacterial species (4–6, 8–12). Because the gene targeting specificity is determined solely by base-pairing between the intron RNA and the targeted chromosomal DNA, the intron fragment can be easily modified and inserted into essentially any DNA sequence (10). This type of gene knockout system can introduce the intron insertion into the chromosome with a single-step transformation process, has a high efficiency, and does not require an antibiotic marker for screening. With curing of the donor plasmid, it is possible to obtain markerless mutagenesis and introduce multiple mutations sequentially in a single strain (12, 23).
The gene knockout system was used to build two mutant strains: C. beijerinckii pta::int(17) and C. beijerinckii buk::int(532). These represent interesting knockout studies because (i) aside from glycolysis, the formation of acetate and that of butyrate are the main methods of energy (ATP) generation for the cells, with the acetate pathway producing more energy per amount of glucose consumed than the butyrate pathway; (ii) the formation of these acids is intricately tied to the formation of butanol and other solvents; and (iii) disruption of the pta and buk genes in C. acetobutylicum has demonstrated interesting solventogenic phenotypes (19, 37). We found that compared to the wild-type strain, the inactivation of pta led to decreased acetate and increased butyrate accumulation during the acidogenic phase, and the disruption of buk resulted in a slight increase in acetate and little change in butyrate production. The phenotype observed for C. beijerinckii pta::int(17) is in agreement with the energy needs for the cell: when one pathway is selectively disrupted, the other needs to be enhanced to make up for the energy shortfall (12). This trade-off was not as clearly observed in C. beijerinckii buk::int(532), which more closely resembled the wild-type strain.
Even though C. beijerinckii buk::int(532) did not demonstrate significantly altered acid production compared to the wild-type strain, in fermentations using either P2 or MP2 medium, it did produce 20% more butanol and total ABE and required a shorter fermentation time, resulting in higher productivity. In the fermentation with P2 medium, the butanol and total ABE productivities for the buk mutant were 0.28 g/liter/h and 0.42 g/liter/h, while those for the wild type were 0.13 g/liter/h and 0.18 g/liter/h, respectively (Table 1). In addition, the buk mutant consumed nearly all of the 60 g/liter of glucose in the batch fermentation, while the wild type consumed only about 40 g/liter under identical conditions. Other groups have also reported that the inactivation of buk in C. acetobutylicum resulted in improved butanol production at similar magnitudes, although different gene disruption strategies were employed (4, 12, 19). It has been reported that butyryl phosphate (butyryl-P) possibly plays a regulatory role in C. acetobutylicum and that its accumulation may trigger solventogenesis (37, 38). The disruption of buk in the C. beijerinckii buk mutant may have led to a higher and sustained level of butyryl-P and thus a higher butanol formation flux and final butanol titer (38).
Even though inactivation of pta resulted in increased butyrate formation and subsequently improved solvent production, it did not fully eliminate the ability to make acetate. Additionally, the solvent production phenotypes of C. beijerinckii pta::int(17) compared to the wild type were dependent on the fermentation medium. This medium dependency has also been reported for pta mutants of C. acetobutylicum. A pta-negative mutant of C. acetobutylicum ATCC 824 generated using the ClosTron knockout system produced slightly lower levels of solvents than the wild type in a batch fermentation with MS-MES minimal medium (17). Another pta knockout mutant of the same strain, built using the same intron insertion site with the targetron knockout technology, was recently reported to produce the highest solvent concentration of all of the single knockout mutants constructed (12). The observed medium-dependent phenotypes may be related to the importance of the acetate formation pathway to energy generation in the cells. The cell growth and solvent production phenotype of the pta mutant may be very sensitive to the buffering capacity and nutritional conditions of the medium as well as other operational conditions. Therefore, specifically for the mutant strains, additional studies to optimize the fermentation and solvent production conditions are warranted.
In addition to changes in solvent production, all of the mutant strains were found to produce higher levels of lactate than the wild type. In MP2 medium, C. beijerinckii pta::int(17) produced a peak level of lactate that was three times that of the wild type or buk mutant and was greater than the level of acetate produced by the pta mutant. The lactate formation pathway has been reported as a less efficient method for energy generation and oxidation of NADH when the pathway for the disposal of protons and electrons by the generation of molecular hydrogen is inhibited. This suggests that the production of lactate may help mitigate for lost ATP production in the pta mutant. Lactate production has also been reported for cells grown under iron-limited conditions, the mechanism of which was presumably the similar. The iron limitation may create an obstruction for the carbon flow at the pyruvate-ferredoxin oxidoreductase pathway, and thus the electron flow is more readily disposed via the pyruvate reduction pathway to lactate than via acetyl-CoA synthesis (39). Lactate production has been reported in a C. acetobutylicum ATCC 824 pta knockout, but its peak level was only around half that of the wild type under conditions similar to ours (17). In all of the fermentations observed in the present study, lactate was reassimilated within the same time frame as acetate and butyrate. Lacate reassimilation has been observed in C. acetobutylicum (39), and a lactate utilization pathway was proposed for Clostridium saccharobutylicum NCP262 (formerly C. acetobutylicum P262), in which acetate was required as an alternative electron acceptor for lactate utilization catalyzed by an NAD-independent lactate dehydrogenase (iLDH) (40). In C. beijerinckii 8052, there are four genes annotated as lactate (l-lactate) dehydrogenase-encoding genes, three of which were found to be highly expressed during the batch fermentation process based on our previous transcriptional analysis study (see Fig. S2 in the supplemental material) (20). Further work is needed to elucidate the lactate production mechanism and reutilization pathway in C. beijerinckii.
Enzymatic assays indicated that there was still 24% Pta activity and 33% Buk activity in the pta mutant and the buk mutant, respectively. For C. acetobutylicum ATCC 824, the knockout of the pta and buk genes based on the homologous integration strategy also resulted in residual enzyme activity, with 14% and 19% residual activities of the corresponding enzymes reported (19). Similar results were obtained in a more recent study in which mutants were constructed in C. acetobutylicum using a targetron-based approach (12). A ptb knockout mutant of C. acetobutylicum ATCC 824 generated using the ClosTron system has been reported to possess a butyrate-negative phenotype (18). Interestingly, another ptb knockout mutant of the same strain generated with the customized targetron system produced butyrate even though the same insertion site was targeted (12). Recently, a mutant of C. acetobutylicum ATCC 824 containing a “stable” deletion of butyrate kinase- and phosphotransbutyrylase-encoding genes was constructed using the homologous recombination strategy. The butyrate production in this mutant strain was significantly decreased but still not completely eliminated (41, 42).
The observed residual enzyme activities in the pta and buk mutants could explain why the mutants still produced acetate and butyrate, respectively. Enzymes are often not the rate-limiting factors in biological metabolism; a 20 to 30% residual activity may be sufficient for catalyzing the corresponding reactions. However, in both mutants, phenotype alteration has been observed (e.g., faster sugar consumption and higher solvent production), suggesting that the acid formation pathways have been disrupted and cannot function as they do in the wild-type strain. Therefore, we hypothesized that there may exist alternative acid production pathways in C. beijerinckii, which could be responsible for the high levels of acid production in the mutants.
In C. acetobutylicum, the butyryl-P profiles have been found to be bimodal, with a second peak observed midway through solventogenesis presumed to correspond to carboxylic acid reutilization (38). As shown in Fig. 3D, there was a second increase in acetate accumulation and an even more obvious butyrate accumulation in both the wild type and C. beijerinckii pta::int(17) after the fermentation switched to solventogenesis. However, this did not occur in C. beijerinckii buk::int(532). The second increase in butyrate may be related to carboxylic acid (especially acetic acid) reutilization. The acetyl-CoA produced through the reassimilation of acetate may be further converted to butyryl-CoA, part of which may be converted to butyrate through the canonical butyrate formation pathway, thereby leading to the temporary accumulation of butyrate. The slight increase in acetate immediately thereafter may be a feedback effect from the butyrate accumulation. Because the butyrate formation pathway was disrupted in C. beijerinckii buk::int(532), the route as described above does not occur, and consequently, there was not a second series of acid peaks observed.
Alternative routes for acetate production have also been suggested by our model iCM925 simulations. All of the genes corresponding to the acetate-producing reactions except for Cbei_0622 were found to have positive expression levels in the wild-type strain based on our previous RNA-Seq study (20), which corroborates the ability of C. beijerinckii to use these acetate-producing reactions. Additionally, because acid production was observed in the C. acetobutylicum knockout strains as well as in our C. beijerinckii mutants, we searched for evidence that alternate acetate routes could exist in C. acetobutylicum as well. Cysteine synthase was found in both published genome-scale models (43–45) and in the MetaCyc annotation database (46). Aldehyde dehydrogenase was not found in either model or in the KEGG (47) or MetaCyc annotation database, and evidence for acetylornithine deacetylase was found only in the MetaCyc annotation database. The missing model and database evidence for the aldehyde dehydroganse and acetylornithine deacetylase genes could be a result of an incomplete annotation, as a BLASTp (48) search showed good homology between the C. beijerinckii genes in question and the C. acetobutylicum genome (E values between 0 and 6E−34). These findings suggest that it is possible that acetate production in the pta-negative C. acetobutylicum mutant could also be attributed to one or more of the above-described production routes. Further investigation is needed to determine the actual in vivo mechanisms for acid production in the pta- and buk-deficient strains.
Supplementary Material
ACKNOWLEDGMENTS
This work was supported by Department of Energy (DOE) grant 2011-01219 to H.P.B. and an NSF CAREER grant to N.D.P.
We thank Roderick I. Mackie for sharing his laboratory facilities and for valuable discussion of the experiments. We also thank Yongchao Li (University of Oklahoma) for helpful discussion of the knockout experiment procedures, as well as Bei Han and Thaddeus C. Ezeji for their input on the enzyme assay experiments.
Footnotes
Published ahead of print 19 July 2013
Supplemental material for this article may be found at http://dx.doi.org/10.1128/AEM.00971-13.
REFERENCES
- 1.Dürre P. 2007. Biobutanol: an attractive biofuel. Biotechnol. J. 2:1525–1534 [DOI] [PubMed] [Google Scholar]
- 2.Ezeji T, Blaschek HP. 2008. Fermentation of dried distillers' grains and solubles (DDGS) hydrolysates to solvents and value-added products by solventogenic clostridia. Bioresour. Technol. 99:5232–5242 [DOI] [PubMed] [Google Scholar]
- 3.Chen CK, Blaschek HP. 1999. Acetate enhances solvent production and prevents degeneration in Clostridium beijerinckii BA101. Appl. Microbiol. Biotechnol. 52:170–173 [DOI] [PubMed] [Google Scholar]
- 4.Shao L, Hu S, Yang Y, Gu Y, Chen J, Jiang W, Yang S. 2007. Targeted gene disruption by use of a group II intron (targetron) vector in Clostridium acetobutylicum. Cell Res. 17:963–965 [DOI] [PubMed] [Google Scholar]
- 5.Heap JT, Kuehne SA, Ehsaan M, Cartman ST, Cooksley CM, Scott JC, Minton NP. 2010. The ClosTron: mutagenesis in Clostridium refined and streamlined. J. Microbiol. Methods 80:49–55 [DOI] [PubMed] [Google Scholar]
- 6.Frazier CL, San Filippo J, Lambowitz AM, Mills DA. 2003. Genetic manipulation of Lactococcus lactis by using targeted group II introns: generation of stable insertions without selection. Appl. Environ. Microbiol. 69:1121–1128 [DOI] [PMC free article] [PubMed] [Google Scholar]
- 7.Lambowitz AM, Zirnmerly S. 2004. Mobile group II introns. Annu. Rev. Genet. 38:1–35 [DOI] [PubMed] [Google Scholar]
- 8.Chen Y, McClane BA, Fisher DJ, Rood JI, Gupta P. 2005. Construction of an alpha toxin gene knockout mutant of Clostridium perfringens type A by use of a mobile group II intron. Appl. Environ. Microbiol. 71:7542–7547 [DOI] [PMC free article] [PubMed] [Google Scholar]
- 9.Karberg M, Guo HT, Zhong J, Coon R, Perutka J, Lambowitz AM. 2001. Group II introns as controllable gene targeting vectors for genetic manipulation of bacteria. Nat. Biotechnol. 19:1162–1167 [DOI] [PubMed] [Google Scholar]
- 10.Perutka J, Wang WJ, Goerlitz D, Lambowitz AM. 2004. Use of computer-designed group II introns to disrupt Escherichia coli DExH/D-box protein and DNA helicase genes. J. Mol. Biol. 336:421–439 [DOI] [PubMed] [Google Scholar]
- 11.Tolonen AC, Chilaka AC, Church GM. 2009. Targeted gene inactivation in Clostridium phytofermentans shows that cellulose degradation requires the family 9 hydrolase Cphy3367. Mol. Microbiol. 74:1300–1313 [DOI] [PMC free article] [PubMed] [Google Scholar]
- 12.Jang Y-S, Lee JY, Lee J, Park JH, Im JA, Eom M-H, Lee J, Lee S-H, Song H, Cho J-H, Seung DY, Lee SY. 2012. Enhanced butanol production obtained by reinforcing the direct butanol-forming route in Clostridium acetobutylicum. mBio 3:e00314-12. 10.1128/mBio.00314-12 [DOI] [PMC free article] [PubMed] [Google Scholar]
- 13.Chen CK, Blaschek HP. 1999. Effect of acetate on molecular and physiological aspects of Clostridium beijerinckii NCIMB 8052 solvent production and strain degeneration. Appl. Environ. Microbiol. 65:499–505 [DOI] [PMC free article] [PubMed] [Google Scholar]
- 14.Hüsemann MHW, Papoutsakis ET. 1988. Solventogenesis in Clostridium acetobutylicum fermentation related to carboxylic acid and proton concentration. Biotechnol. Bioeng. 32:843–852 [DOI] [PubMed] [Google Scholar]
- 15.Jones DT, Woods DR. 1986. Acetone-butanol fermentation revisited. Microbiol. Rev. 50:484–524 [DOI] [PMC free article] [PubMed] [Google Scholar]
- 16.Terracciano JS, Kashket ER. 1986. Intracellular conditions required for initiation of solvent production by Clostridium acetobutylicum. Appl. Environ. Microbiol. 52:86–91 [DOI] [PMC free article] [PubMed] [Google Scholar]
- 17.Lehmann D, Hönicke D, Ehrenreich A, Schmidt M, Weuster-Botz D, Bahl H, Lütke-Eversloh T. 2012. Modifying the product pattern of Clostridium acetobutylicum: physiological effects of disrupting the acetate and acetone formation pathways. Appl. Microbiol. Biotechnol. 94:743–754 [DOI] [PubMed] [Google Scholar]
- 18.Lehmann D, Radomski N, Lütke-Eversloh T. 2012. New insights into the butyric acid metabolism of Clostridium acetobutylicum. Appl. Microbiol. Biotechnol. 96:1325–1339 [DOI] [PubMed] [Google Scholar]
- 19.Green EM, Boynton ZL, Harris LM, Rudolph FB, Papoutsakis ET, Bennett GN. 1996. Genetic manipulation of acid formation pathways by gene inactivation in Clostridium acetobutylicum ATCC 824. Microbiology 142:2079–2086 [DOI] [PubMed] [Google Scholar]
- 20.Wang Y, Li X, Mao Y, Blaschek H. 2012. Genome-wide dynamic transcriptional profiling in Clostridium beijerinckii NCIMB 8052 using single-nucleotide resolution RNA-Seq. BMC Genomics 13:102. 10.1186/1471-2164-13-102 [DOI] [PMC free article] [PubMed] [Google Scholar]
- 21.Jesse TW. 2003. Genetic characterization and manipulation of solvent-producing clostridia. Ph.D. dissertation. University of Illinois at Urbana-Champaign, Urbana, IL [Google Scholar]
- 22.Li Y, Blaschek HP. 2002. Molecular characterization and utilization of the CAK1 filamentous viruslike particle derived from Clostridium beijerinckii. J. Ind. Microbiol. Biotechnol. 28:118–126 [DOI] [PubMed] [Google Scholar]
- 23.Li Y, Tschaplinski T, Engle N, Hamilton C, Rodriguez M, Liao J, Schadt C, Guss A, Yang Y, Graham D. 2012. Combined inactivation of the Clostridium cellulolyticum lactate and malate dehydrogenase genes substantially increases ethanol yield from cellulose and switchgrass fermentations. Biotechnol. Biofuels 5:2. 10.1186/1754-6834-5-2 [DOI] [PMC free article] [PubMed] [Google Scholar]
- 24.Wang Y, Li X, Mao Y, Blaschek H. 2011. Single-nucleotide resolution analysis of the transcriptome structure of Clostridium beijerinckii NCIMB 8052 using RNA-Seq. BMC Genomics 12:479. 10.1186/1471-2164-12-479 [DOI] [PMC free article] [PubMed] [Google Scholar]
- 25.Shi Z, Blaschek HP. 2008. Transcriptional analysis of Clostridium beijerinckii NCIMB 8052 and the hyper-butanol-producing mutant BA101 during the shift from acidogenesis to solventogenesis. Appl. Environ. Microbiol. 74:7709–7714 [DOI] [PMC free article] [PubMed] [Google Scholar]
- 26.Ha S-J, Galazka JM, Rin Kim S, Choi J-H, Yang X, Seo J-H, Louise Glass N, Cate JHD, Jin Y-S. 2011. Engineered Saccharomyces cerevisiae capable of simultaneous cellobiose and xylose fermentation. Proc. Natl. Acad. Sci. U. S. A. 108:504–509 [DOI] [PMC free article] [PubMed] [Google Scholar]
- 27.Andersch W, Bahl H, Gottschalk G. 1983. Level of enzymes involved in acetate, butyrate, acetone and butanol formation by Clostridium acetobutylicum. Eur. J. Appl. Microbiol. Biotechnol. 18:327–332 [Google Scholar]
- 28.Rose IA. 1955. Acetate kinase of bacteria (acetokinase). Methods Enzymol. 1:591–595 [Google Scholar]
- 29.Milne C, Eddy J, Raju R, Ardekani S, Kim P-J, Senger R, Jin Y-S, Blaschek H, Price N. 2011. Metabolic network reconstruction and genome-scale model of butanol-producing strain Clostridium beijerinckii NCIMB 8052. BMC Syst. Biol. 5:130. 10.1186/1752-0509-5-130 [DOI] [PMC free article] [PubMed] [Google Scholar]
- 30.Varma A, Palsson BO. 1994. Stoichiometric flux balance models quantitatively predict growth and metabolic by-product secretion in wild-type Escherichia coli W3110. Appl. Environ. Microbiol. 60:3724–3731 [DOI] [PMC free article] [PubMed] [Google Scholar]
- 31.Mahadevan R, Schilling CH. 2003. The effects of alternate optimal solutions in constraint-based genome-scale metabolic models. Metab. Eng. 5:264–276 [DOI] [PubMed] [Google Scholar]
- 32.Schellenberger J, Que R, Fleming RMT, Thiele I, Orth JD, Feist AM, Zielinski DC, Bordbar A, Lewis NE, Rahmanian S, Kang J, Hyduke DR, Palsson BO. 2011. Quantitative prediction of cellular metabolism with constraint-based models: the COBRA Toolbox v2.0. Nat. Protoc. 6:1290–1307 [DOI] [PMC free article] [PubMed] [Google Scholar]
- 33.Gurobi Optimization Inc 2013. Gurobi Optimizer reference manual. Gurobi Optimization Inc, Houston, TX [Google Scholar]
- 34.Formanek J, Mackie R, Blaschek HP. 1997. Enhanced butanol production by Clostridium beijerinckii BA101 grown in semidefined P2 medium containing 6 percent maltodextrin or glucose. Appl. Environ. Microbiol. 63:2306–2310 [DOI] [PMC free article] [PubMed] [Google Scholar]
- 35.Gottschalk G. 1986. Butyrate and butanol-acetone fermentation, p 231–232 In Gottschalk G. (ed), Bacterial metabolism, 2nd ed. Springer-Verlag, New York, NY [Google Scholar]
- 36.Wiesenborn DP, Rudolph FB, Papoutsakis ET. 1989. Phosphotransbutyrylase from Clostridium acetobutylicum ATCC 824 and its role in acidogenesis. Appl. Environ. Microbiol. 55:317–322 [DOI] [PMC free article] [PubMed] [Google Scholar]
- 37.Harris LM, Desai RP, Welker NE, Papoutsakis ET. 2000. Characterization of recombinant strains of the Clostridium acetobutylicum butyrate kinase inactivation mutant: need for new phenomenological models for solventogenesis and butanol inhibition? Biotechnol. Bioeng. 67:1–11 [PubMed] [Google Scholar]
- 38.Zhao YS, Tomas CA, Rudolph FB, Papoutsakis ET, Bennett GN. 2005. Intracellular butyryl phosphate and acetyl phosphate concentrations in Clostridium acetobutylicum and their implications for solvent formation. Appl. Environ. Microbiol. 71:530–537 [DOI] [PMC free article] [PubMed] [Google Scholar]
- 39.Bahl H, Gottwald M, Kuhn A, Rale V, Andersch W, Gottschalk G. 1986. Nutritional factors affecting the ratio of solvents produced by Clostridium acetobutylicum. Appl. Environ. Microbiol. 52:169–172 [DOI] [PMC free article] [PubMed] [Google Scholar]
- 40.Diez-Gonzalez F, Russell JB, Hunter JB. 1995. The role of an NAD-independent lactate dehydrogenase and acetate in the utilization of lactate by Clostridium acetobutylicum strain P262. Arch. Microbiol. 164:36–42 [Google Scholar]
- 41.Dusséaux S, Croux C, Soucaille P, Meynial-Salles I. 2013. Metabolic engineering of Clostridium acetobutylicum ATCC 824 for the high-yield production of a biofuel composed of an isopropanol/butanol/ethanol mixture. Metab. Eng. 18:1–8 [DOI] [PubMed] [Google Scholar]
- 42.Soucaille P. December 2010. Process for the biological production of n-butanol with high yield. US patent 12/823,706
- 43.Lee J, Yun H, Feist AM, Palsson BO, Lee SY. 2008. Genome-scale reconstruction and in silico analysis of the Clostridium acetobutylicum ATCC 824 metabolic network. Appl. Microbiol. Biotechnol. 80:849–862 [DOI] [PubMed] [Google Scholar]
- 44.Senger RS, Papoutsakis ET. 2008. Genome-scale model for Clostridium acetobutylicum: part I. Metabolic network resolution and analysis. Biotechnol. Bioeng. 101:1036–1052 [DOI] [PMC free article] [PubMed] [Google Scholar]
- 45.Senger RS, Papoutsakis ET. 2008. Genome-scale model for Clostridium acetobutylicum: part II. Development of specific proton flux states and numerically determined sub-systems. Biotechnol. Bioeng. 101:1053–1071 [DOI] [PMC free article] [PubMed] [Google Scholar]
- 46.Caspi R, Altman T, Dreher K, Fulcher CA, Subhraveti P, Keseler IM, Kothari A, Krummenacker M, Latendresse M, Mueller LA, Ong Q, Paley S, Pujar A, Shearer AG, Travers M, Weerasinghe D, Zhang PF, Karp PD. 2012. The MetaCyc database of metabolic pathways and enzymes and the BioCyc collection of pathway/genome databases. Nucleic Acids Res. 40:D742–D753. 10.1093/nar/gkr1014 [DOI] [PMC free article] [PubMed] [Google Scholar]
- 47.Kanehisa M. 2013. Molecular network analysis of diseases and drugs in KEGG. Methods Mol. Biol. 939:263–275 [DOI] [PubMed] [Google Scholar]
- 48.Altschul SF, Madden TL, Schaffer AA, Zhang JH, Zhang Z, Miller W, Lipman DJ. 1997. Gapped BLAST and PSI-BLAST: a new generation of protein database search programs. Nucleic Acids Res. 25:3389–3402 [DOI] [PMC free article] [PubMed] [Google Scholar]
Associated Data
This section collects any data citations, data availability statements, or supplementary materials included in this article.