Abstract
The genetic defect underlying paroxysmal nocturnal hemoglobinuria (PNH) has been shown to reside in PIGA, a gene that encodes an element required for the first step in glycophosphatidylinositol anchor assembly. Why PIGA-mutated cells are able to expand in PNH marrow, however, is as yet unclear. To address this question, we compared the growth of affected CD59–CD34+ and unaffected CD59+CD34+ cells from patients with that of normal CD59+CD34+ cells in liquid culture. One hundred FACS-sorted cells were added per well into microtiter plates, and after 11 days at 37°C the progeny were counted and were analyzed for their differentiation pattern. We found that CD59–CD34+ cells from PNH patients proliferated to levels approaching those of normal cells, but that CD59+CD34+ cells from the patients gave rise to 20- to 140-fold fewer cells. Prior to sorting, the patients’ CD59– and CD59+CD34+ cells were equivalent with respect to early differentiation markers, and following culture, the CD45 differentiation patterns were identical to those of control CD34+ cells. Further analyses of the unsorted CD59+CD34+ population, however, showed elevated levels of Fas receptor. Addition of agonist anti-Fas mAb to cultures reduced the CD59+CD34+ cell yield by up to 78% but had a minimal effect on the CD59–CD34+ cells, whereas antagonist anti-Fas mAb enhanced the yield by up to 250%. These results suggest that expansion of PIGA-mutated cells in PNH marrow is due to a growth defect in nonmutated cells, and that greater susceptibility to apoptosis is one factor involved in the growth impairment.
Introduction
In paroxysmal nocturnal hemoglobinuria (PNH), expansion of one or more hematopoietic stem cells altered by somatic mutation gives rise to blood elements that are abnormally sensitive to complement. The heightened complement sensitivity is due to failure of the cells to express two cell-surface complement regulatory proteins, the decay-accelerating factor (DAF, or CD55) and the membrane inhibitor of reactive lysis (MIRL, or CD59). The deficiency of these regulators derives from the cells’ inability to synthesize glycophosphatidylinositol (GPI) anchors, posttranslationally added structures that attach these and other proteins to the plasma membrane (reviewed in refs. 1 and 2). Studies in recent years have localized the site of the defect to the synthesis of N-acetyl-D-glucosamine (GlcNAc) phosphatidylinositol, the first step in GPI anchor assembly (3, 4), and have shown that the genetic defect resides in phosphatidylinositol glycan A (PIGA), a gene which is encoded on the X chromosome (5). All patients that have been studied to date have been found to harbor mutations in this gene (reviewed in ref. 6).
Despite the above advances in our understanding of the membrane defect of affected blood cells and the genetic lesion — i.e., the PIGA mutation — underlying the abnormality, a central aspect of disease pathogenesis in PNH remains unclarified. Why only one or a few PIGA-mutated stem cells are able to preferentially grow in patients’ marrow is unexplained. Some data have suggested that PIGA– stem cells possess an inherent growth advantage (7). Other data have indicated that nonmutated PIGA+ stem cells are growth-impaired (8, 9), enabling PIGA– stem cells to emerge. The latter data are supported by the close association between PNH and aplastic anemia (reviewed in ref. 10).
In the present study, PIGA-mutated CD59–CD34+ and nonmutated CD59+CD34+ cells in cytopheresis or bone marrow samples of PNH patients were purified by cell sorting and placed in a liquid culture growth system. The expansion and differentiation of the two cell populations in the presence of hematopoietic growth factors then were compared to those of CD34+ cells from normal controls. The studies showed that affected PIGA– cells expand and differentiate in a fashion approaching that of CD34+ cells from normal controls. In contrast, they demonstrated that nonmutated PIGA+ cells are markedly impaired in their growth. Three-color analyses showed that the growth abnormality is associated with heightened expression of the Fas receptor (CD95). Culturing of patients’ CD59+CD34+ cells in the presence of agonist and antagonist anti-CD95 mAb showed that they are more sensitive to Fas-mediated killing than CD59–CD34+ cells.
Methods
Proteins.
Murine anti-DAF and anti-CD59 mAb’s IA10 and IF5 were obtained as previously described (11, 12). Murine anti-CD34-FITC, murine anti-CD71-FITC, and anti-CD19-FITC were obtained from Becton Dickinson Immunocytometry Systems (San Jose, California, USA). Biotinylated anti-CD59/streptavidin-phycoerythrin (PE) (CD59-PE), biotinylated anti-CD59/streptavidin-cychrome (CY), anti-CD45-FITC, and LDS-751 were prepared as previously described (13, 14). Streptavidin-PE, streptavidin-CY, CD95-PE, CD38-CY, CD34-CY, and directly labeled CD59-PE were obtained from PharMingen (La Jolla, California, USA). CD64-FITC was obtained from Beckman Coulter Inc. (Miami, Florida, USA). Antagonist (ZB4) and agonist (CH11) murine anti-CD95 mAb’s were obtained as previously described (15–17).
Patients.
Patients A, B, C, D, and E had characteristic clinical manifestations and laboratory findings (including positive acid hemolysis [Ham] tests) of PNH. In patients A, C, D, and E, PNH was diagnosed during work-up for hemolytic anemia. Patient C additionally exhibited antinuclear antibodies. Patient B developed PNH in the aftermath of aplastic anemia treated with immunosuppression, developing a positive Ham test on routine screening several months after treatment. All five patients had mild to moderate anemia (hematocrit, 28–32%). Patients C and E were hypercellular on bone marrow examination, patients B and D had normal cellularity, and patient A did not have a bone marrow exam. No evidence of dysplasia was seen in any of the patients. In each case, DAF–CD59– subpopulations of erythrocytes and large proportions of DAF–CD59– polymorphonuclear cells (PMN) were present in the peripheral blood. Control subjects were healthy laboratory personnel or patients undergoing autologous peripheral blood progenitor cell harvest for lymphoma or solid tumors who were in remission at the time of cytopheresis.
Cytopheresis and bone marrow.
PBMC harvests were collected using a COBE Spectra (Lakewood, Colorado, USA) blood cell separator (18). Bone marrow was obtained by standard procedures. In all instances, mononuclear cells were cryopreserved in 10% dimethyl sulfoxide (final concentration) using a controlled-rate liquid nitrogen freezer and stored in liquid nitrogen. Thawed cells were washed three times with RPMI containing 0.2 mg/mL DNase 1 (Sigma Chemical Co., St. Louis, Missouri, USA).
Cell preparation and flow cytometry.
Resuspended cytopheresis samples were centrifuged through Ficoll-Hypaque, interface cells were collected, and the cells washed with RPMI medium. Prior to staining, cells were washed three times in PBS containing 1% BSA/0.1% NaN3/4 mM EDTA and resuspended to 108 per mL. Resuspended cells (0.1 mL) were incubated for 15 minutes on ice with 20 μL each of the designated antibodies at titered concentrations. (a) For sorting, resuspended cells (usually 25 μL) were incubated with CD34-FITC and CD59-PE. After washing two times, cells were resuspended to 106 cells/0.5 mL in HBSS containing 1% BSA/0.1% NaN3/4 mM EDTA/pH 7.4. (b) For three-color analyses of cell differentiation after culturing, cells were stained with CD45-FITC, CD59-PE, and LDS-751. (c) For analyses of early differentiation markers prior to culturing, cells were stained with CD34-FITC and CD38-CY; CD34-CY and CD71-FITC; CD34-CY and CD64-FITC; and CD34-CY and CD19-FITC; in all cases including CD59-PE as a third marker. (d) For studies prior to culturing involving CD95, cells (107 in 0.1 mL) were incubated for 15 minutes on ice with 20 μL each of CD34-FITC, CD59-biotin, and CD95-PE. Washed cells were then further incubated at 4°C for 15 minutes with 80 μL of streptavidin-CY.
For deriving P values, differences in means for patients’ CD59+ and CD59– populations and for controls were statistically assessed using the approach of DerSimonian and Laird (19) with the standard assumption of homogeneous variances across subjects. P values were obtained by comparing the (standardized) estimated mean differences to the standard normal distribution.
Cell sorting was performed on an Elite ESP flow cytometer equipped with an Argon ion laser tuned at 488 nm (Beckman Coulter Inc.). Three detectors with appropriate filters were set up for the use of FITC, PE, and CY as fluorochromes. Stained KG1a cells were used for compensation. Correction for the cross-over of fluorescence between two or more detectors was performed as described (13, 14). In some studies, CD34+ cells were initially purified by affinity chromatography using the MACS CD34 progenitor cell isolation kit (Miltenyi Biotec, Auburn, California, USA). Flow cytometric analyses of cultured cells were performed on a Becton Dickinson FACScan (Becton Dickinson Immunocytometry Systems). Light scatter and two or three fluorescence signals were determined for each cell.
Data acquisition of initially sorted cells was performed with Elite software version 4.01 (Beckman Coulter Inc.). For all growth experiments, two data files were collected. For the first data file, 15,000 to 30,000 events were collected without the use of gates to determine the frequency of CD34+ cells. For the second data file, gates were used on both light scatter parameters as well as CD34+ fluorescence, and the entire sample, originally containing 106–107 cells, was collected. For analytical studies of uncultured CD34+ cells, CD34+ cells were initially purified to allow recovery of adequate cell numbers, gates were used on forward and side scatter, and at least 90% of the sample was analyzed. Data analysis was performed using the Elite software (Beckman Coulter Inc.). For cultured cells, data analysis was performed with Paint-A-Gate software (Becton Dickinson).
Liquid culture growth system.
Cells were sorted into wells of 96-well microtiter plates prepared with growth medium as previously described (20). Each well was prefilled with a 100-μL mixture of myeloid long-term culture medium (Terry Fox Laboratory, Vancouver, Canada) containing 12.5% horse serum, 12.5% FCS, 10–4 mol/L 2-mercaptoethanol, 2 mmol/L L-glutamine, 0.2 mmol/L i-inositol, 10 μmol/L folic acid, and antibiotics, and was supplemented with 2.5 U/mL recombinant human erythropoietin (Amgen Inc., Thousand Oaks, California, USA), 10 ng/mL recombinant human IL-3, 500 U/mL recombinant human IL-6, 10 ng/mL recombinant human GM-CSF, 2.5 ng/mL recombinant human bFGF, 10 ng/mL recombinant human IGF-1 (Collaborative Biomedical Products, Bedford, Massachusetts, USA), and 50 ng/mL recombinant human stem cell factor (Genzyme Pharmaceuticals, Cambridge, Massachusetts, USA). After addition of cells, plates were incubated in 5% CO2 in air at 37°C in a humidified incubator. Cell growth was checked daily. Cells were harvested at day 11 and, after counting, were stained as described above.
Results
Comparative abilities of PIGA– and PIGA+ CD34+ stem cells from PNH patients to grow in liquid culture.
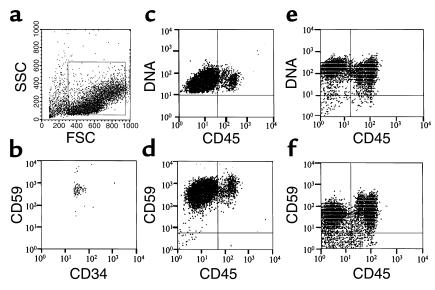
Figure 1 shows the flow cytometric methodology used for the comparative growth studies of CD34+ stem cells. Mononuclear cells from cytopheresis samples were gated on forward and orthogonal light scatter characteristic of CD34+ cells (Figure 1a) and additionally on CD34 positivity to enrich for CD34+ cells (not shown). Reanalysis of CD59-stained normal control cells sorted in this way (Figure 1b) verified that >98% purity of the sorted CD34+ cells was achieved. According to the growth protocol described in Methods, 100 of the sorted CD34+ cells were introduced per well into wells of 96-well microtiter plates. After 11 days in liquid culture, the progeny were counted; then they were analyzed after staining with CD59-PE, CD45-FITC, and LDS-751, a vital nucleic acid dye which preferentially stains DNA. In prestudy control experiments with two normal donors using this experimental protocol, the cell counts showed that about 150,000 cells were produced. The three-color analyses of a large number (about 50,000) of the progeny showed that they were homogenously positive for DNA (Figure 1, c and e) and for GPI-anchored CD59 (Figure 1, d and f) and fell into three populations (Figure 1, c–f) with respect to CD45 expression: (a) cells negative for the marker indicative of cells of erythroid lineage; (b) dimly staining cells indicative of progenitors, plasma cells, and cells of basophilic and neutrophilic lineage; and (c) brightly staining cells indicative of cells of lymphoid, monocytic, and eosinophilic lineage.
Figure 1.
Method of CD34+ cell collection and phenotype of CD34+ cell progeny from two healthy controls. (a and b) Gates were placed on forward scatter and side scatter (shown by the box in a) and CD34+ fluorescence. The purity of the sorted cells is shown in b. (c–f) After culturing, cells were stained for GPI-anchored CD59; CD45; and DNA in three-color analyses. The results for two healthy volunteers, N1 (c and e) and N2 (d and f) are shown.
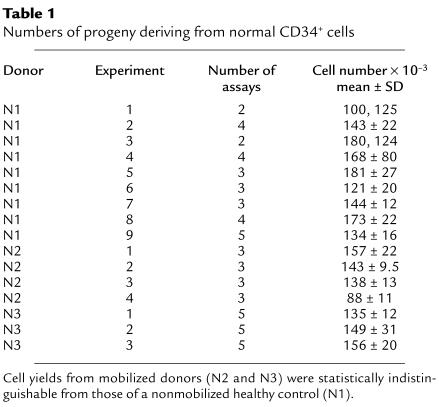
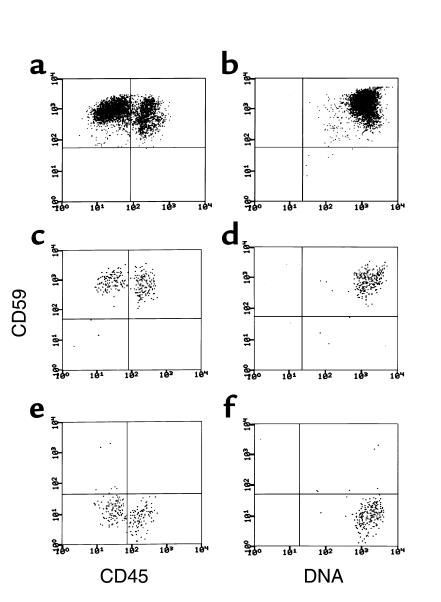
Using the above methodology, quantitative studies of normal and PNH cells were then systematically performed. As seen in Table 1, per 100 CD34+ cells from normal controls, a mean of 143 × 103 cells was generated. The cell yield varied less than twofold in 16 experiments with three different donors. Flow cytometric analyses of the progeny showed that the CD45 differentiation and LDS-751 staining patterns (Figure 2a) uniformly conformed to those depicted in the preliminary studies. Comparable results were observed for all subjects.
Table 1.
Numbers of progeny deriving from normal CD34+ cells
Figure 2.
Flow cytometric analyses of progeny of normal CD34+, patients’ PIGA– CD34+, and patients’ PIGA+ CD34+ cells after 11 days of growth in liquid culture. The cells were stained as in Figure 1. The left (a, c, and e) and right (b, d and f) panels show CD59 vs. CD45 and CD59 vs. DNA, respectively. The upper panels (a and b) show the same patterns for normal cells seen in the preliminary studies. As seen in the middle panels (c and d), the progeny of PIGA+ cells were uniformly CD59+, and as seen in the lower panels (e and f), those of PIGA– cells were uniformly CD59–. For the normal cells, 10,000 gated events were collected based on forward and side scatter and cells were analyzed for CD59 and CD45 or CD59 and DNA. Due to lower available cell numbers, for the PIGA-mutated and -nonmutated patient cell populations, about 1,000 gated events were collected.
For the examination of patients’ CD34+ cells, CD59–CD34+ and CD59+CD34+ cells were separated by sorting and, as done with control cells, 100 sorted cells were added per well to wells of microtiter plates. Three-color staining of the unsorted CD34+ population for DAF as well as CD59 verified that the CD59– cells were totally DAF–, i.e., completely defective in GPI– anchoring. RT-PCR analyses of the sorted CD59–CD34+ cells from two of the patients (B and D) showed that the PIGA gene in one harbored a deletion of C575 and in the other harbored a 14-bp deletion at positions 1141–1154, mutations identical to those previously identified in their affected peripheral PMN (21).
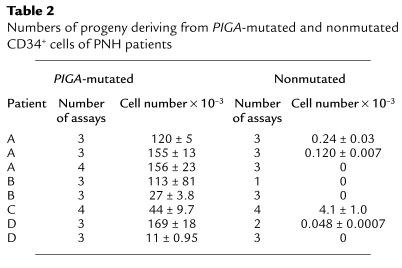
After 11 days in culture, progeny of the patients’ CD34+ cells were counted and their phenotypes analyzed as described above. As seen in Table 2, per 100 PIGA-mutated CD59–CD34+ cells, 11 × 103 to 169 × 103 progeny were generated, yields variably less than or equal to those of normal CD34+ cells. In contrast, per 100 PIGA-nonmutated CD59+CD34+ cells, in one study 4.1 × 10³ progeny were produced, a value 35-fold lower than the mean value of normal control cells. In seven of the studies, <1,000 cells were produced. As shown in Figure 2, b and c, staining for CD59, DNA, and CD45 in the patient with 4.1 × 10³ cells verified that the progeny of the CD59–CD34+ and CD59+CD34+ cells were homogenously CD59– and CD59+ respectively, and it showed that, in both cases, the differentiation pattern with respect to CD45 staining did not differ from that of control CD34+ cells (Figure 2a). Studies of CD59–CD34+ and CD59+CD34+ cells from the marrow of one of the above-studied patients and a fifth PNH patient gave comparable results (patient B [CD59–CD34+ cells = 82 ± 1.5 × 10³ cells vs. CD59+CD34+ cells = 7.6 ± 3.4 × 10³ cells] and patient E [CD59–CD34+ cells = 100 ± 26 × 103 cells vs. CD59+CD34+ cells = 6.9 ± 1.6 × 10³ cells], respectively).
Table 2.
Numbers of progeny deriving from PIGA-mutated and nonmutated CD34+ cells of PNH patients
Comparative phenotypes of patients’ CD59– and CD59+CD34+ cells.
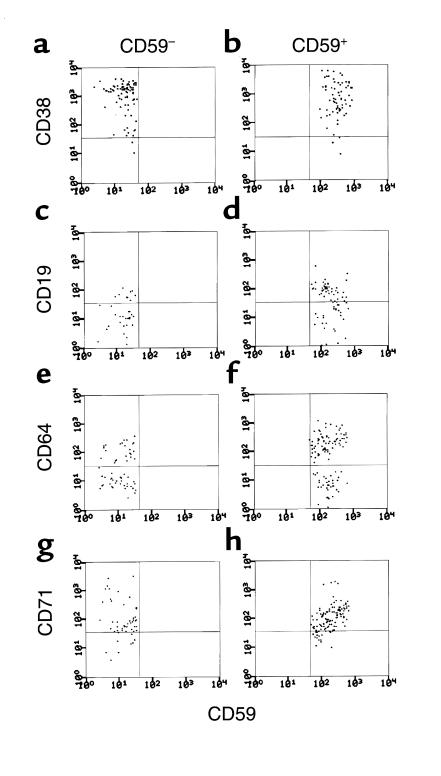
Since differences in the growth properties of the patients’ CD59– and CD59+CD34+ cells could derive from differences in their phenotypes, studies next were done to determine whether the two populations differed with respect to early differentiation markers. For this purpose, the CD59–CD34+ and CD59+CD34+ cell populations from three of the patients were examined for expression of CD38, a multilineage differentiation marker, and for expression of CD71, CD64, and CD19, early differentiation markers of erythroid, myeloid, and B-cell lineages. As seen in Figure 3 for cells from patient B, the CD59–CD34+ and CD59+CD34+ populations were equivalent with respect to all four markers. Comparable results were obtained for the other two patients (not shown). Moreover, culturing of the CD38– subpopulations of the CD59–CD34+ and CD59+CD34+ cell sets from patient D showed differences comparable to those measured above (CD59–CD38–CD34+ cells = 120 × 103 cells vs. CD59+CD38–CD34+ cells = 1 × 10³ cells).
Figure 3.
Cell surface phenotypes of CD59–CD34+ and CD59+CD34+ PNH cell populations prior to culturing. Each cell population was examined for CD38 (a and b), CD19 (c and d), CD64 (e and f), or CD71 (g and h) in three-color analyses as described in Methods. For each marker, a total of 20,000 gated events was collected based on forward and side scatter and cells were analyzed gating on CD34 positivity and CD59 positivity or negativity. In each instance about 75–100 events were recovered.
Analysis of normal and patients’ CD34+ cells for Fas receptor (CD95).
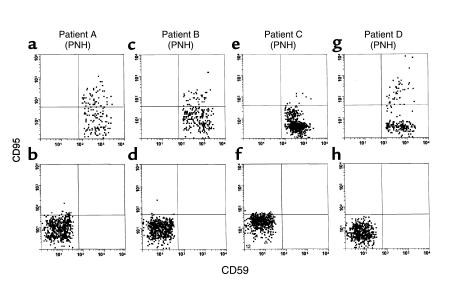
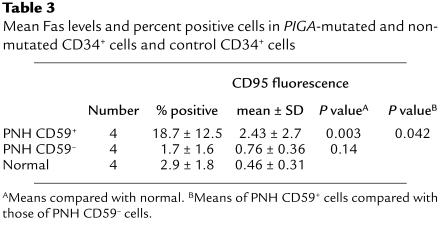
As one approach toward identifying possible mechanisms underlying the growth impairment of patients’ CD59+CD34+ cells, we compared expression levels of CD95 on the cells to those on CD59–CD34+ cells in the same samples and on CD59+CD34+ cells in cytopheresis samples of normal controls. For this analysis, unsorted mononuclear cells in initial cytopheresis samples were examined in three-color studies following staining with CD34-FITC, CD59-biotin/streptavidin-CY and CD95-PE. The results are given in Figure 4 and Table 3. In three of the four cases examined, CD95 surface levels on the patients’ CD59+CD34+ cells were higher than those on CD59–CD34+ cells in the same samples, and in all four cases they were higher than those on normal control samples. Mean levels (Table 3) were threefold higher, and sixfold more cells showed elevated values.
Figure 4.
Expression of Fas receptor on PIGA– and PIGA+ CD34 cells from four patients. Cells were stained for CD34, GPI-anchored CD59, and CD95 in three-color analyses. CD95 levels in patients’ nonmutated CD34+ cells (upper panels: a, c, e, and g) and patients’ PIGA-mutated CD34+ cells (lower panels: b, d, f, and h) are shown. As seen in the upper panels, CD95 levels on the nonmutated CD59+ cells were higher than on PIGA-mutated CD59– cells in the same samples. For each patient, a total of 100,000 gated events was collected based on forward and side scatter and cells were analyzed gating on CD34 positivity and CD59 positivity or negativity. For each patient, about 200–400 events were recovered.
Table 3.
Mean Fas levels and percent positive cells in PIGA-mutated and nonmutated CD34+ cells and control CD34+ cells
Susceptibility of patients’ CD59+CD34+ cells to Fas-mediated killing.
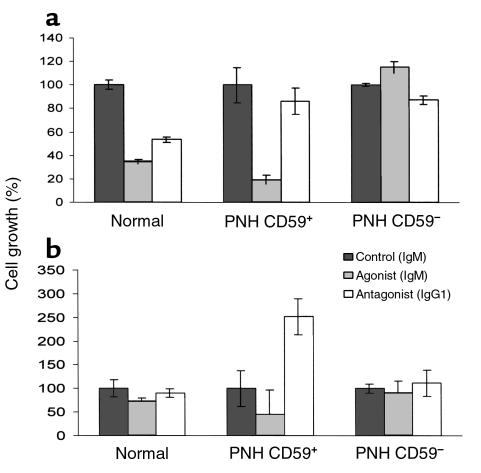
We next determined whether patients’ CD59+CD34+ cells were in fact more susceptible to Fas-mediated killing than were CD59–CD34+ cells in the same samples or in control samples, i.e., whether the elevated levels of Fas receptor were functionally significant. Cells available from two of the patients whose CD59+CD34+ cells (one cytopheresis [patient C] and one marrow [patient D]) were found to exhibit significant growth in culture were studied. In independent experiments, CD59+CD34+ and CD59–CD34+ cells from each patient and CD59+CD34+ cells from a corresponding control were placed in growth medium alone, or in medium alternatively containing anti-CD95 mAb’s that differentially induce or inhibit Fas-mediated killing. After 11 days, the cells were harvested and counted. The results are shown in Figure 5, a and b. As compared to CD59–CD34+ cells in the same samples and CD59+CD34+ cells from the normal control, greater anti-Fas-mediated killing of the patients’ CD59+CD34+ cells was observed in both cases. Conversely, in one patient somewhat greater and in the other markedly greater inhibition of killing than that of CD59+CD34+ cells from the normal control were observed with the mAb that blocks Fas-mediated killing.
Figure 5.
Heightened Fas-mediated killing of patients’ CD59+CD34+ cells in culture. (a) Separated PNH CD59–CD34+ and CD59+CD34+ cells and normal CD59+CD34+ cells from cytopheresis samples of patient C and a healthy control were grown in culture as in Figure 2 in medium alone or medium containing agonist or antagonist mAb to CD95. The results represent the mean of six replicate experiments. (b) An identical experiment was done with separated cell populations from marrow samples of patient B and a corresponding control.
Discussion
In this study we employed a liquid culture system to examine directly the growth properties of PIGA-mutated and -nonmutated CD34+ cells in PNH marrow. We found that PIGA-mutated cells exhibit growth and differentiation patterns similar to those of CD34+ cells from normal controls and thus do not possess an inherent growth advantage. In contrast, we found that PIGA-nonmutated cells are markedly impaired in their growth and thus harbor the functional abnormality that is responsible for the outgrowth of mutated cells in PNH marrow. We further found that levels of Fas receptor on the nonmutated cells are elevated, and that in vitro, the cells exhibit increased susceptibility to Fas-mediated killing.
Our findings concerning the growth properties of patients’ mutated and nonmutated CD34+ cells extend previous findings by others. Using long-term bone marrow cultures (LTBMCs), Pendleton et al. (8) found that, in contrast to normal stem cells, which gave rise to normal numbers of BFU-E and CFU-GM whether grown on normal or PNH stroma, stem cells from PNH marrow yielded decreased numbers of both colony types when plated on stromal cells from either source, indicating that PNH stem cells harbor a growth defect that is unrelated to stromal cells. Analyses of separated PIGA-mutated and -nonmutated PNH stem cells were not performed. Maciejewski et al. (9) separated CD59–CD34+ and CD59+CD34+ cells as done in the present study and found that both colony formation in methylcellulose and proliferation in LTBMCs of the patient populations were decreased relative to normal CD59+CD34+ cells. A difference in growth between the CD59– and CD59+ populations, however, was not documented.
Our findings that PIGA-mutated cells do not possess a growth advantage are in accordance with these previous studies. Although our data when analyzed as a group did show about 30% diminished growth of patients’ PIGA-mutated cells (mean yield for PIGA– CD34+ cells 99.4 ± 63.1 × 10³ cells, vs. 143 ± 23 × 103 cells for normal cells), this further finding that the growth of PIGA-mutated cells approaches that of normal cells indicates that the proliferative defect involves the nonmutated cells much more profoundly than the mutated cells. To ascertain whether this result was a reflection of the assay system used, comparative methylcellulose assays (22) were performed. Per 1,000 sorted CD34+ cells, these cultures produced no colonies for the patient’s CD59+ cells (patient D), whereas they yielded 61 BFU-E and CFU-GM for the patient’s CD59– cells as compared with 95 BFU-E and CFU-GM for normal CD59+ cells (control A). Consistent with the proposition that PIGA-deficient stem cells are not inherently growth-impaired and in support of our findings, studies from two groups (23, 24) with PIGA knockout chimeric mice have yielded data showing that the proportion of PIGA-mutated cells relative to normal (wild-type) cells in such animals does not rapidly decrease but usually remains relatively constant.
The experimental approach adopted in our study was used to examine differences in the proliferation and the comparative differentiation of PIGA-mutated and -nonmutated early progenitors in patients. The liquid culture system used was originally described by Leary and Ogawa (25) for studying early hematopoietic progenitors and subsequently modified to identify the earliest progenitors within the CD34+CD38– cell population and to distinguish them from later CD34+CD38+ hematopoietic progenitors (17, 26). The culture system permits multiparameter flow cytometric analyses of progeny and cell number (as done in Figures 1 and 2), as well as the assessment of cell lineage and maturational stage of each of the cells (27, 28). The liquid culture system directly measures overall proliferation and differentiation rather than specific clonotypes. Although it differs from standard methylcellulose assays in that IL-6, FGF, and IgF1 are included among the growth factors, it is unlikely that this difference is relevant to the results obtained since, as indicated, methylcellulose control studies yielded similar data. The greater expansion of PIGA– cells as compared with PIGA+ cells for PNH CD34+ cells that was found would explain the relative proliferative advantage that is seen clinically in favor of the PIGA– population in patients.
A number of recent studies have examined PNH cells with respect to their susceptibility to apoptosis. Brodsky et al. (29) found that, when placed in low glucose medium or exposed to ionizing radiation, Epstein Barr virus–transformed B-cell lines from patients maintained more than two- to tenfold higher growth rates than patients’ nonmutated lines or normal control lines, arguing that PIGA mutation is associated with increased resistance to starvation or radiation-induced apoptosis. Using peripheral blood PMN, Horikawa et al. (30) and Ware et al. (31) similarly found that patients’ cells exhibited decreased susceptibility to apoptosis (spontaneous, starvation-induced, and Fas-mediated), but in both studies the decrease could not be linked to mutation of the PIGA gene, as comparable decreases were observed with cells from patients having high (90%) and low (10%) proportions of CD59– PMN. Horikawa et al. (30) obtained similar results with patients’ CD59–CD34+ cells, but patients’ CD59+CD34+ cells could not be evaluated, as their numbers in the patients studied were too low to assay. This problem of low cell numbers in the latter study, the only study that attempted to analyze CD34+ cells, is in accordance with the growth data of our patients’ nonmutated CD34+ cells.
Our finding that patients’ PIGA-mutated cells are somewhat more resistant to anti-Fas antibody–induced apoptosis than are control cells (see Figure 5, black bars of normal and PNH CD59– cells) are compatible with the above reports. Our further findings that their nonmutated CD59+CD34+ cells exhibit heightened susceptibility to apoptosis compared with their CD59–CD34+ cells would account for the outgrowth of the nonmutated cells in PNH marrow. That the CD59+CD34+ cells exhibit elevated levels of Fas receptor provides a mechanism for the enhanced sensitivity. The increased growth of PIGA-mutated cells that would eventuate from the presence of a growth defect resulting from an increase in Fas receptor levels on patients’ nonmutated stem cells (as found in this study) would be further favored in the presence of a concurrent apoptotic defect in the PIGA-affected cells as implicated in B cells in the study by Brodsky et al. (29) and in CD34+ cells in the study by Horikawa et al. (30).
To our knowledge, there is no known direct link between the Fas pathway and GPIs or GPI anchoring. One of the TGF-β receptors (a binding protein) is GPI-anchored, and its selective expression on patients’ GPI+ cells could favor their growth inhibition relative to GPI– cells (32, 33). There is evidence, however, that in some situations the cytokine can abrogate Fas-induced growth suppression (34). An antagonist death receptor that is GPI-anchored has been identified (35), but its selective retention on patients’ GPI+ cells would decrease sensitivity to apoptosis. There is the widely held hypothesis, however, that PNH involves immune attack (36) against a GPI-anchored protein that is as yet unidentified, and there is evidence in associated aplasia for participation of cytotoxic CD8+ cells (37). If this hypothesis is correct, part of this process could involve activation of the Fas pathway. Of possible relevance to a linkage with GPI-anchored proteins in this context are studies in CD4+ T cells (38) that have found that the Fas pathway can be activated by cross-linking GPI-anchored Thy-1 or Ly-6C.
In a different line of work involving in vivo studies, separated CD59– PIGA-mutated CD34+ cells from patients and normal CD34+ cells from healthy volunteers were injected into SCID mice, and the in vivo growth rates of the abnormal and normal stem cells were compared (7). These experiments found that the affected PNH CD34+ cells expanded 2–3 times faster than the normal control cells. In these studies, patients’ nonmutated CD34+ cells were not similarly studied. Moreover, the studies were performed in conventional SCID mice that retain natural killer–cell (NK-cell) function (rather than SCID/BEIGE or another line that additionally lacks this activity), so that the selective outgrowth could have eventuated from differential immune attack against the PIGA-nonmutated CD34+ cell population. In vitro evidence for selective NK-cell reactivity against GPI-anchored positive cells recently has been obtained using the RAMOS cell line (which exists in GPI+ and GPI– subpopulations) and NK cells from normal donors (39, 40).
Our finding that, in addition to mutations of the PIGA gene, PNH development depends upon a second defect, i.e., a growth impairment in nonmutated cells, is consistent with the close association of PNH with aplastic anemia (10). From this finding it follows that PIGA-mutated cells can only grow out when there is a concomitant lesion in nonmutated cells. In support of this proposition, recent studies of patients receiving CAMPATH treatment (anti-lymphocyte antibodies against GPI-anchored surface CAMPATH protein) for lymphoma or rheumatoid arthritis have shown that GPI– PIGA-mutated lymphocytes emerge (41). Other recent studies of peripheral blood PMN from normal volunteers have shown PIGA mutations similar to those in PNH cells (42), raising the possibility that PIGA-mutated CD34+ cells may pre-exist in low frequency in some if not most individuals without outgrowth.
Acknowledgments
This study was supported by NIH grant R01 AI-23598 (to M.E. Medof). The authors thank Sara Cechner for manuscript preparation and Beth Ann Benetz (University Hospital Ophthalmic Photography Lab) for help with artwork.
Footnotes
Shanmugam Nagarajan’s present address is: Department of Pathology, Emory University, Atlanta, Georgia, USA.
Gregory M. Prince’s present address is: Department of Pathology, MedCentral Hospital, Mansfield, Ohio, USA.
Uma Maheshwari’s present address is: Department of Pathology, Emory University, Atlanta, Georgia, USA.
References
- 1.Stevens VL. Biosynthesis of glycosylphosphatidylinositol membrane anchors. Biochem J. 1995;310:361–370. doi: 10.1042/bj3100361. [DOI] [PMC free article] [PubMed] [Google Scholar]
- 2.Yomtovian R, Prince GM, Medof ME. The molecular basis for paroxysmal nocturnal hemoglobinuria. Transfusion. 1993;33:852–873. doi: 10.1046/j.1537-2995.1993.331094054626.x. [DOI] [PubMed] [Google Scholar]
- 3.Armstrong C, et al. Affected paroxysmal nocturnal hemoglobinuria T lymphocytes harbor a common defect in assembly of N-acetyl-D-glucosamine inositol phospholipid corresponding to that in class A Thy-1- murine lymphoma mutants. J Biol Chem. 1992;267:25347–25351. [PubMed] [Google Scholar]
- 4.Takahashi M, et al. Deficient biosynthesis of N-acetylglucosaminyl-phosphatidylinositol, the first intermediate of glycosyl phosphatidylinositol anchor biosynthesis, in cell lines established from patients with paroxysmal nocturnal hemoglobinuria. J Exp Med. 1993;177:517–521. doi: 10.1084/jem.177.2.517. [DOI] [PMC free article] [PubMed] [Google Scholar]
- 5.Takeda J, et al. Deficiency of the GPI anchor caused by a somatic mutation of the PIG-A gene in paroxysmal nocturnal hemoglobinuria. Cell. 1993;73:703–711. doi: 10.1016/0092-8674(93)90250-t. [DOI] [PubMed] [Google Scholar]
- 6.Harris JW, Koscick R, Lazarus H, Eshleman JR, Medof ME. Leukemia arising out of paroxysmal nocturnal hemoglobinuria. Leuk Lymphoma. 1999;32:401–426. doi: 10.3109/10428199909058399. [DOI] [PubMed] [Google Scholar]
- 7.Iwamoto N, et al. Preferential hematopoiesis by paroxysmal nocturnal hemoglobinuria clone engrafted in SCID mice. Blood. 1996;87:4944–4948. [PubMed] [Google Scholar]
- 8.Pendleton AL, Ware RE, Kurtzberg J, Burnett A, Rosse WF. The hematopoietic defect in paroxysmal nocturnal hemoglobinuria assessed by long-term bone marrow culture. Blood. 1995;86(Suppl. 1):131a. (Abstr.) [Google Scholar]
- 9.Maciejewski JP, Sloand EM, Sato T, Anderson S, Young NS. Impaired hematopoiesis in paroxysmal nocturnal hemaglobinuria/aplastic anemia is not associated with a selective proliferative defect in the glycosylphosphatidylinositol-anchored protein-deficient clone. Blood. 1997;89:1173–1181. [PubMed] [Google Scholar]
- 10.Young, N.S., and Alter, B.P. 1994. Aplastic anemia acquired and inherited. W.B. Saunders Co. Philadelphia, Pennsylvania, USA. 410 pp.
- 11.Kinoshita T, Medof ME, Silber R, Nussenzweig V. Distribution of decay-accelerating factor in the peripheral blood of normal individuals and patients with paroxysmal nocturnal hemoglobinuria. J Exp Med. 1985;162:75–92. doi: 10.1084/jem.162.1.75. [DOI] [PMC free article] [PubMed] [Google Scholar]
- 12.Okada N, Harada R, Fujita T, Okada H. Monoclonal antibodies capable of causing hemolysis of neuraminidase-treated human erythrocytes by homologous complement. J Immunol. 1989;143:2262–2266. [PubMed] [Google Scholar]
- 13.Terstappen LWMM, Nguyen M, Lazarus HM, Medof ME. Expression of the DAF (CD55) and CD59 antigens during normal hematopoietic cell differentiation. J Leukoc Biol. 1992;52:652–660. doi: 10.1002/jlb.52.6.652. [DOI] [PubMed] [Google Scholar]
- 14.Terstappen LWMM, Nguyen M, Huang S, Lazarus HM, Medof M. Defective and normal hematopoietic stem cells in paroxysmal nocturnal hemoglobinuria. Br J Haematol. 1993;84:504–514. doi: 10.1111/j.1365-2141.1993.tb03108.x. [DOI] [PubMed] [Google Scholar]
- 15.Sieg S, Smith D, Yildirim Z, Kaplan D. Fas ligand deficiency in HIV disease. Proc Natl Acad Sci USA. 1997;94:5860–5865. doi: 10.1073/pnas.94.11.5860. [DOI] [PMC free article] [PubMed] [Google Scholar]
- 16.Sieg S, Huang Y, Kaplan D. Viral regulation of CD95 expression and apoptosis in T lymphocytes. J Immunol. 1997;159:1192–1199. [PubMed] [Google Scholar]
- 17.Sieg S, et al. Herpes simplex virus type 2 inhibition of Fas ligand expression. J Virol. 1996;70:8747–8751. doi: 10.1128/jvi.70.12.8747-8751.1996. [DOI] [PMC free article] [PubMed] [Google Scholar]
- 18.Prince GM, et al. Peripheral blood harvest of unaffected CD34+ CD38 hematopoietic precursors in paroxysmal nocturnal hemoglobinuria. Blood. 1995;86:3381–3386. [PubMed] [Google Scholar]
- 19.DerSimonian R, Laird N. Meta-analysis in clinical trials. Control Clin Trials. 1986;7:177–188. doi: 10.1016/0197-2456(86)90046-2. [DOI] [PubMed] [Google Scholar]
- 20.Huang S, Terstappen LWWM. Lymphoid and myeloid differentiation of single human CD34+, HLA-DR+, CD38– hematopoietic stem cells. Blood. 1994;83:1515–1526. [PubMed] [Google Scholar]
- 21.Nagarajan S, Brodsky RA, Young NS, Medof ME. Genetic defects underlying paroxysmal nocturnal hemoglobinuria that arises out of aplastic anemia. Blood. 1995;86:4656–4661. [PubMed] [Google Scholar]
- 22.Reese JS, et al. Retroviral transduction of a mutant methylguanine DNA methyltransferase gene into human CD34 cells confers resistance to O6-benzylguanine plus 1,3-bis(2-chloroethyl)-1-nitrosourea. Proc Natl Acad Sci USA. 1996;93:14088–14093. doi: 10.1073/pnas.93.24.14088. [DOI] [PMC free article] [PubMed] [Google Scholar]
- 23.Kawagoe K, et al. Glycosylphosphatidylinositol-anchor-deficient mice: implications for clonal dominance of mutant cells in paroxysmal nocturnal hemoglobinuria. Blood. 1996;87:3600–3606. [PubMed] [Google Scholar]
- 24.Rosti V, et al. Murine embryonic stem cells without pig-a gene activity are competent for hematopoiesis with the PNH phenotype but not for clonal expansion. J Clin Invest. 1997;100:1028–1036. doi: 10.1172/JCI119613. [DOI] [PMC free article] [PubMed] [Google Scholar]
- 25.Leary AG, Ogawa M. Blast cell colony assay for umbilical cord blood and adult bone marrow progenitors. Blood. 1987;69:953–956. [PubMed] [Google Scholar]
- 26.Terstappen LW, Huang S, Safford M, Lansdorp PM, Loken MR. Sequential generations of hematopoietic colonies derived from single nonlineage-committed CD34+CD38- progenitor cells. Blood. 1991;77:1218–1227. [PubMed] [Google Scholar]
- 27.Olweus J, Lund-Johansen F, Terstappen LW. CD64/Fc gamma RI is a granulo-monocytic lineage marker on CD34+ hematopoietic progenitor cells. Blood. 1995;85:2402–2413. [PubMed] [Google Scholar]
- 28.Olweus J, Terstappen LW, Thompson PA, Lund-Johansen F. Expression and function of receptors for stem cell factor and erythropoietin during lineage commitment of human hematopoietic progenitor cells. Blood. 1996;88:1594–1607. [PubMed] [Google Scholar]
- 29.Brodsky RA, Vala MS, Barber JP, Medof ME, Jones R. Resistance to apoptosis caused by PIG-A gene mutations in paroxysmal nocturnal hemoglobinuria. Proc Natl Acad Sci USA. 1997;94:8756–8760. doi: 10.1073/pnas.94.16.8756. [DOI] [PMC free article] [PubMed] [Google Scholar]
- 30.Horikawa K, et al. Apoptosis resistance of blood cells from patients with paroxysmal nocturnal hemoglobinuria, aplastic anemia, and myelodysplastic syndrome. Blood. 1997;90:2716–2722. [PubMed] [Google Scholar]
- 31.Ware RE, Nishimura J, Smith C, Rosse WF, Howard TA. Relative resistance to apoptosis in paroxysmal nocturnal hemoglobinuria is not affected by correction of GPI-linked protein expression. Blood. 1997;90:273a. (Abstr.) [PubMed] [Google Scholar]
- 32.Nishimura J, Smith CA, Ware RE, Rosse WF. Paroxysmal nocturnal hemaglobinuria: molecular pathogenesis and molecular therapeutic approaches. Hematopathol Mol Hematol. 1998;11:119–146. [PubMed] [Google Scholar]
- 33.Li PX, et al. Placental transforming growth factor-β is a downstream mediator of the growth arrest and apoptotic response of tumor cells to DNA damage and p53 overexpression. J Biol Chem. 2000;275:20127–20135. doi: 10.1074/jbc.M909580199. [DOI] [PubMed] [Google Scholar]
- 34.Dybedal I, et al. Transforming growth factor-β1 abrogates Fas-induced growth suppression and apoptosis of murine bone marrow progenitor cells. Blood. 1997;90:3395–3403. [PubMed] [Google Scholar]
- 35.Pan G, et al. An antagonist decoy receptor and a death domain-containing receptor for TRAIL. Science. 1997;277:815–818. doi: 10.1126/science.277.5327.815. [DOI] [PubMed] [Google Scholar]
- 36.Young NS. The problem of clonality in aplastic anemia: Dr. Dameshek’s riddle, restated. Blood. 1992;79:1385–1392. [PubMed] [Google Scholar]
- 37.Young NS, Maciejewski JP. The pathophysiology of acquired aplastic anemia. N Engl J Med. 1997;336:1365–1372. doi: 10.1056/NEJM199705083361906. [DOI] [PubMed] [Google Scholar]
- 38.Lancki DW, Fields P, Qian D, Fitch FW. Induction of lytic pathways in T cell clones derived from wild-type or protein tyrosine kinase Fyn mutant mice. Immunol Rev. 1995;146:117–144. doi: 10.1111/j.1600-065x.1995.tb00687.x. [DOI] [PubMed] [Google Scholar]
- 39.Dunn DE, et al. The PNH phenotype (GPI-anchored protein-deficiency) protects hematopoietic targets against lymphocytotoxic attack. Blood. 1997;90(Suppl. 1):407A. (Abstr). [Google Scholar]
- 40.Dunn DE, Ware RE, Parker CJ, Mishoe HO, Young NS. Research directions in paroxysmal nocturnal hemoglobinuria. Immunol Today. 1999;20:168–171. doi: 10.1016/s0167-5699(98)01424-8. [DOI] [PubMed] [Google Scholar]
- 41.Rollinson S, et al. Both paroxysmal nocturnal hemoglobinuria (PNH) type II cells and PNH type III cells can arise from different point mutations involving the same codon of the PIG-A gene. Blood. 1997;89:3069–3071. [PubMed] [Google Scholar]
- 42.Araten DJ, Nafa K, Pakdeesuwan K, Luzzatto L. Clonal populations of hematopoietic cells with paroxysmal nocturnal hemoglobinuria genotype and phenotype are present in normal individuals. Proc Natl Acad Sci USA. 1999;96:5209–5214. doi: 10.1073/pnas.96.9.5209. [DOI] [PMC free article] [PubMed] [Google Scholar]


