

Abstract
Nearly 10% of the genes in the genome of Drosophila melanogaster are in nested structures, in which one gene is completely nested within the intron of another gene (nested and including gene, respectively). Even though the coding sequences and untranslated regions of these nested/including gene pairs do not overlap, their intimate structures and the possibility of shared regulatory sequences raise questions about the evolutionary forces governing the origination and subsequent functional and evolutionary impacts of these structures. In this study, we show that nested genes experience weaker evolutionary constraint, have faster rates of protein evolution, and are expressed in fewer tissues than other genes, while including genes show the opposite patterns. Surprisingly, despite completely overlapping with each other, nested and including genes are less likely to display correlated gene expression and biological function than the nearby yet nonoverlapping genes. Interestingly, significantly fewer nested genes are transcribed from the same strand as the including gene. We found that same-strand nested genes are more likely to be single-exon genes. In addition, same-strand including genes are less likely to have known lethal or sterile phenotypes than opposite-strand including genes only when the corresponding nested genes have introns. These results support our hypothesis that selection against potential erroneous mRNA splicing when nested and including genes are on the same strand plays an important role in the evolution of nested gene structures.
Keywords: nested genes, overlapping genes, splicing, gene expression, gene organization
The distribution of genes in the genome is not random. There are regions with few functional genes and regions where genes are densely packed. It has been known that the close proximity between genes can have significant functional consequences. Indeed, neighboring genes were shown to have correlated expression patterns in eukaryotes (including yeast [Cohen et al. 2000], Caenorhabditis elegans [Lercher et al. 2003], Drosophila [Boutanaev et al. 2002], Arabidopsis thaliana [Williams and Bowles 2004], and humans [Lercher et al. 2002; Trinklein et al. 2004]), as well as biological functions and/or signaling pathways (Elo et al. 2003; Lee and Sonnhammer 2003; Al-Shahrour et al. 2010). In extreme cases, the distance between neighboring genes is 0, and parts or all of their gene structures (exons, introns, or untranslated regions [UTRs]) overlap with each other (overlapping genes). These structures are commonly observed in eukaryotes (e.g., C. elegans [Chen and Stein 2006], Drosophila [Misra et al. 2002], and mammals [Veeramachaneni et al. 2004]).
An especially interesting class of overlapping genes is in which one gene is completely nested within an intron of another gene (nested and including gene, respectively [reviewed in Kumar 2009]). Even though the coding sequences of these nested/including gene pairs do not overlap, their intimate structures raise questions about the evolutionary forces governing the origination of nested gene structures and their subsequent functional and evolutionary impacts. We found that, in Drosophila melanogaster, approximately 16% of the genes (2,295 out of 14,072 genes) overlap with at least one other gene in exons, introns, or UTRs. Genes in nested structures account for 9.5% of the D. melanogaster genes (1,338 genes), which is more than C. elegans (2.7%, Chen and Stein 2006) and human (2.73%, Yu et al. 2005). To examine the evolutionary and functional significance of nested gene structures in D. melanogaster while controlling for intrinsic attributes of genes in close proximity, we compared nested/including gene pairs to “control gene pairs,” which have matching chromosomal distributions to that of nested/including gene pairs and are within 500 bp of each other but do not overlap (see Materials and Methods).
Mutational Input Is a Key Determinant of the Location of Nested Genes
Previous analysis showed that most nested gene structures in Drosophila originated through insertions or de novo origination of coding sequences in introns (Assis et al. 2008). Larger introns are larger targets for insertion or de novo mutations and should be more likely to harbor nested genes. Indeed, we found that the total intron lengths of including genes are significantly longer than control genes, even after excluding the sequence contributed by nested genes (median: 12,183 [including] and 308 [control]; Mann–Whitney U test (MWU) P < 10−16). Including genes also have more introns than both nested genes and control genes (median: 7 [including], 2 [control], and 1 [nested]; MWU, P < 10−16 for both comparisons). Focusing on including genes, introns with nested genes are significantly longer than introns without nested genes (median: 4,826 [with nested genes] and 138 [without nested genes]; MWU, P < 10−16). Because long introns were found to be more evolutionarily conserved and suggested to more likely harbor functional sequences (Haddrill et al. 2005), this observation is unlikely due to larger introns being more tolerant of insertions. Moreover, the D. melanogaster–D. simulans divergence of the longest introns of including genes is smaller than that of other introns of including genes even after excluding nested genes (median: 0.071 [longest] and 0.082 [others]; MWU test, P = 0.0012), indicating that the observation of long introns being more evolutionarily conserved does not result from a fraction of nested genes in them. These results support that the mutational process is a key determinant of the location of nested genes.
Selection Plays an Important Role in the Maintenance and Functional Significance of Nested Gene Structures
Several hypotheses that potentially explain the selective pressures influencing the fixation of nested structures in the population, and their subsequent functional evolution, make specific predictions about the current expressional and functional correlations of nested and including genes. In addition to the common chromosomal environment that might have led to correlated expression of genes in proximity (reviewed in Hurst et al. 2004; Oliver and Misteli 2005), genes in nested structures might be selectively favored if their expression and/or biological functions are coregulated, resulting in even stronger positively correlated expression and/or biological functions than neighboring genes. On the other hand, the proximity of nested and including genes may result in interference during transcription, leading to selection against spatially and temporally correlated expression of nested and including genes (“transcriptional interference” [Shearwin et al. 2005; Liao and Zhang 2008]). Still, the evolution of nested gene structures could be a nearly neutral process (Lynch and Conery 2003; Lynch 2006), and the expression and functional correlations between nested and including genes would be similar to those of genes in proximities.
Nested/including gene pairs are significantly positively correlated (estimated using Spearman rank ρ) in gene expression levels across tissues (FlyAtlas, Chintapalli et al. 2007, MWU, P = 0.025). This is also observed for control gene pairs (MWU, P < 2 × 10⁻¹⁶]. However, the correlations in expression of nested/including gene pairs are significantly weaker (Spearman rank ρ median 0.019 [nested/including gene pairs] vs. 0.174 [control gene pairs], MWU, P = 8.6 × 10⁻¹⁴, fig. 1) and less likely to be positive (52.74% [nested/including gene pairs] vs. 69.44% [control gene pairs]; Fisher’s exact test [FET], P = 4 × 10⁻⁹) than control gene pairs. In fact, the correlations in expression of nested/including gene pairs are not different from two randomly chosen genes that are not adjacent but on the same chromosome (“random control gene pairs”; Spearman rank ρ median 0.019 [nested/including gene pairs] vs. 0.032 [random control gene pairs]; MWU, P = 0.76, fig. 1). Furthermore, we employed logistic regression and found that nested/including gene pairs are less likely than control gene pairs to have one gene (nested gene of nested/including gene pairs) to be expressed in the subset of tissues of another gene (including gene of nested/including gene pairs; P = 0.05; odds ratio = 0.78), to have the same highest expressed tissues (P = 8 × 10⁻¹¹; odds ratio = 0.25), and to be associated with the same GO (Gene Ontology) categories (P = 0.002, 0.001, 0.02; odds ratios = 0.14, 0.17, 0.16 for biological process, molecular function, and cellular component, respectively). Yet, again, when we compared nested/including gene pairs with random control gene pairs, none of these three differences were significant. The correlations in expressional patterns and involvement in biological functions of nested/including genes pairs are significantly different from what have been observed for nearby nonoverlapping genes, suggesting that selection against transcriptional interference might have led to their expression in different tissues and involvement in different biological functions.
Fig. 1.—

Distributions of Spearman ρ in gene expression for nested/including gene pairs and control gene pairs. Nested/including gene pairs are less positively correlated in their expression level across 20 tissues than control gene pairs, but have similar correlations in expression with nonadjacent pairs of genes on the same chromosome (“random control gene pairs”).
Paucity of Same-Strand Nested/Including Gene Pairs Might Result from Selection against Missplicing
Nested genes can be transcribed from the same strand as their including genes (same strand) or different strand from their including genes (opposite strand). The majority of nested genes (71.27%) were found to be on the opposite strand. This proportion is significantly different from the proportion of the control gene pairs (53.55%) and from the expected proportion if the orientations are random (50%; FET, P < 10−16 for both comparisons). Although the strand biases of nested genes have been widely reported in different eukaryotes (63% of same-strand nested genes in human [Yu et al. 2005] and 88% in C. elegans [Chen and Stein 2006]), the biological cause of this bias has not been specifically discussed and tested on a genomic scale.
The paucity of same-strand nested gene structures may have resulted from the intrinsic strand biases of the mutational processes leading to nested gene structures. Alternatively, this may be due to differential selection on same-strand and opposite-strand nested genes. Several cases of genes, transposable elements, or endogeneous retroviruses that are nested within introns of another genes are known to cause aberrant splicing of the outer including genes (Horowitz and Berg 1995; Kaer et al. 2011; Maksakova et al. 2006). The missplicing of including genes was shown to be dependent on the presence of splice sites within the sequences of transposable elements or endogeneous virus (van de Lagemaat et al. 2006; Kaer et al. 2011). The splice sites of nested genes are more likely to interfere with splicing of including genes when the two genes are transcribed from the same strand. Consistent with this hypothesis, we found that same-strand nested genes are more likely to be single-exon genes (72.53%) than opposite-strand nested genes (37.41%; FET, P < 10−16). Focusing on nested genes that have more than one exon, same-strand nested genes still have fewer introns than opposite-strand nested genes (median: one intron (same-strand nested genes) vs. two introns [opposite-strand nested genes]; MWU, P = 0.00013). Our observation is not due to opposite-strand nested genes being longer than their same-strand counterparts because the coding sequence length is not statistically different between same-strand and opposite-strand nested genes (median: 817.5 [same strand] vs. 898 [opposite strand]; MWU, P = 0.11).
Seventy-three nested genes are young (less than 35 million years old [Clark et al. 2007; Zhang et al. 2010]) and originated through duplication of another gene (parental gene). The duplication process can be via either DNA or RNA intermediates. A characteristic of RNA-based duplication is that the new genes lose all introns that were originally present in their parental gene (reviewed in Kaessmann et al. 2009), and this process accounts for around 12.10% of duplicated genes in Drosophila (Zhang et al. 2010). Among the 73 duplicated nested genes, only 16.67% of opposite-strand nested duplicated genes originated through RNA-based duplication, while 42.11% of same-strand nested duplicated genes originated via RNA intermediates (FET, P = 0.054). This difference is marginally significant, likely due to the small sample size. Additionally, the decrease in intron number of duplicated nested genes, when compared with their respective parental genes, is significantly larger for same-strand nested duplicated genes than opposite-strand nested duplicated genes (median: one intron difference [same-strand nested genes] vs. zero intron difference [opposite-strand nested genes]; MWU, P = 0.028). Note that this difference is not due to the variation in intron numbers of the parental genes of same-strand and opposite-strand nested genes, which is not significantly different (MWU, P = 0.41).
If missplicing is indeed more likely to happen when including genes and nested genes are on the same strand than when they are on opposite strands, we expect that same-strand including genes are less likely to be essential for the fitness of flies. In extreme cases, we expect that loss of function or expression knockdown by RNA interference (RNAi) of same-strand including genes is less likely to be associated with lethal phenotypes. When considering all same-strand and opposite-strand including genes, there is no significant difference in the proportion of genes having known lethal phenotypes (38.85% [same strand] vs. 44.66% [opposite strand]; table 1). Yet, when we only considered including genes whose nested genes have introns (and therefore are more likely to cause missplicing), same-strand including genes are significantly less likely to have known lethal phenotypes (26.0% [same strand] vs. 42.33% [opposite strand]; table 1). The result is strengthened if we consider both lethal and sterile phenotypes (30.00% [same strand] vs. 47.44% [opposite strand]; table 1). It is worth noting that the genetic disturbance (null mutant or expression knockdown) we considered here is extreme, and it is likely that, when considering more subtle influences on fitness, the difference between same-strand and opposite-strand including genes will be more significant and should be more general. Overall, our observations that same-strand nested genes contain fewer introns and that same-strand including genes have a lower probability of being associated with lethal and sterile phenotypes suggest that the paucity of same-strand nested/including gene pairs could be attributable to purifying selection against missplicing when nested genes are transcribed from the same strand.
Table 1.
Known Phenotypic Effects of Including Genes
| Lethal | Sterile | Viable |
FET P Value |
|||
|---|---|---|---|---|---|---|
| Lethal vs. Nonlethala | Affectedb vs. Viable | |||||
| All including genes | Same strand | 68 | 9 | 98 | 0.23 | 0.2 |
| Opposite strand | 159 | 19 | 178 | |||
| Including genes with intron-containing nested genes | Same strand | 13 | 2 | 35 | 0.037 | 0.027 |
| Opposite strand | 91 | 11 | 113 | |||
aGenes without known lethal phenotype (could have known sterile phenotype).
bGenes with known lethal or sterile phenotype.
Nested Genes Evolve Faster, Are More Narrowly Expressed, and Are Enriched with Testis-Related Functions While Including Genes Show the Opposite Patterns
To test whether genes in nested structures show different patterns of evolution, we examined the site frequency spectrum of coding variants (using Tajima’s D [Tajima 1989]), relative rates of protein evolution (dN/dS, [Yang 2007]), and proportion of amino acid substitutions fixed by positive selection (α, [Smith and Eyre-Walker 2002]) of including genes, nested genes and control genes, and classified genes into those that are present in all 12 Drosophila species (i.e., genes older than 35 million years; Clark et al. 2007) or not (Zhang et al. 2010) (table 2). Including genes have more negative Tajima’s D, lower dN/dS, and are more likely to be conserved across the Drosophila species than either nested genes or control genes, suggesting they are under stronger purifying selection. On the other hand, nested genes, while not differing in Tajima’s D from control genes, have larger dN/dS and α, and tend to be younger than both including genes and control genes. We did not detect any significant difference between same- and opposite-strand including genes or nested genes in these analyses.
Table 2.
Evolutionary Properties and Expression Patterns of Nested, Including, and Control Genes
| Median |
MWU Test P Value |
|||||
|---|---|---|---|---|---|---|
| Including | Nested | Control | Including vs. Nested | Including vs. Control | Nested vs. Control | |
| Tajima’s D | −2.76 | −1.77 | −1.87 | <10−8 | <10−8 | >0.05 |
| dN/dS | 0.042 | 0.107 | 0.073 | <10−8 | <10−8 | <10−8 |
| α | 0.251 | 0.435 | 0.343 | 0.005 | 0.275 | 0.035 |
| Breadth of expression (number of tissues) | 18 | 4 | 19 | <10−16 | 0.363 | <10−16 |
| Proportion (%) |
FET P value |
|||||
|---|---|---|---|---|---|---|
| Including | Nested | Control | Including vs. Nested | Including vs. Control | Control vs. Nested | |
| Conserved across 12 Drosophila species | 99.05 | 88.13 | 91.24 | <10−16 | <10−16 | 0.027 |
| Highest expression in brain | 29.09 | 5.21 | 9.44 | <10−16 | <10−16 | 0.003 |
| Highest expression in testis | 6.43 | 43.91 | 13.52 | <10−16 | 1.45 × 10⁻⁶ | <10−16 |
| Highest expression in ovary | 13.78 | 5.36 | 23.94 | 1.3 × 10⁻⁷ | 9.06 × 10⁻⁸ | <10−16 |
| Young duplicate genes | 0.9 | 8.4 | 7 | <10−12 | 5.2 × 10⁻¹⁶ | 0.02 |
We also found that nested and including genes have unusual gene expression patterns. Nested genes are expressed in significantly fewer tissues (have narrower breadth of expression) than either including genes or control genes (table 2). They also have significantly higher expression specificity (see Materials and Methods) than either including or control genes (MWU, P < 10−12 for both comparisons; fig. 2). While same- and opposite-strand nested genes do not differ in their breadth of expression (MWU, P = 0.15), same-strand nested genes have significantly higher expression specificity than opposite-strand nested genes (0.95 [same-strand] vs. 0.93 [opposite-strand]; MWU, P = 0.009). The composition of tissues where genes have their highest expression is also significantly different between including genes, nested genes, and control genes (chi-square test, P < 10−16 for all comparisons; fig. 3). This composition is not different between same- and opposite-strand including genes but significantly different between same- and opposite-strand nested genes (chi-square test, P = 0.024; fig. 3). Including genes are more enriched with genes having their highest expression in brain than either nested genes or control genes (table 2). In contrast, nested genes are significantly enriched with genes having highest expression in testis but are deficient for genes having highest expression in ovaries (table 2). The enrichment of high testis expression is especially strong for same-strand nested genes (58.46% [same strand] vs. 38.18% [opposite strand]; FET, P = 1.67 × 10⁻⁶).
Fig. 2.—
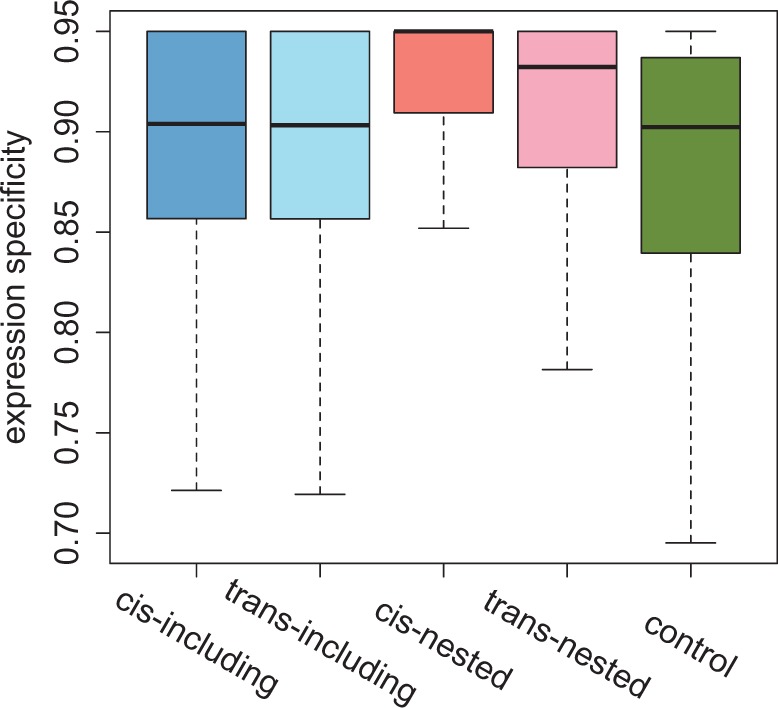
Expression specificity of genes in nested structures and control genes. Boxplots for the expression specificity of including genes, nested genes, and control genes. The expression specificity is highest for same-strand nested genes followed by opposite-strand nested genes, both of which are significantly higher than either including genes or control genes.
Fig. 3.—
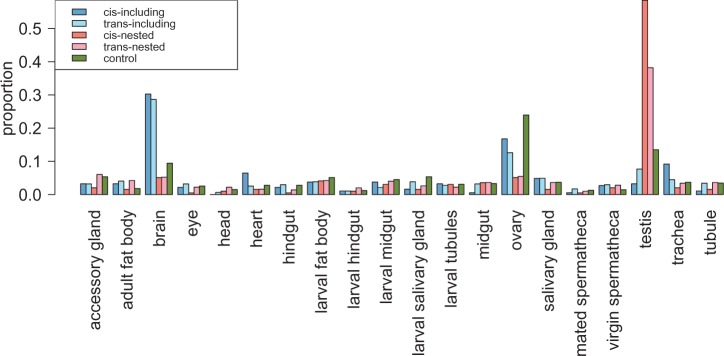
The distributions of tissues where genes have their highest expression. Nested genes, especially same-strand nested genes, are enriched with genes having their highest expression level in testis when compared with both including and control genes. On the contrary, including genes are enriched with genes having their highest expression in brain.
Consistent with previous finding that the majority of nested gene structures originated through insertion of DNA sequences into introns of including genes via gene duplications (Assis et al. 2008), we observed significantly larger proportion of nested genes that were previously identified as young duplicated genes (Zhang et al. 2010) than either including genes or control genes (table 2). Young duplicated genes tend to evolve rapidly (Chen et al. 2010), which could have led to the observed exceptional evolutionary properties of nested genes. On the other hand, the two interesting properties of nested genes—narrow expression (Larracuente et al. 2008) and enrichment of highest expression in testis (reviewed in Swanson and Vacquier 2002)—are widely known to be correlated with rapid protein evolution. To test whether the unusual evolutionary and expression properties of nested genes are due to the larger proportion of duplicate genes, we compared nested genes with a set of control genes that have the same proportion of young duplicated genes (“duplication control genes,” see Materials and Methods). Nested genes still show faster rates of protein evolution (dN/dS, MWU, P < 10−9), have greater α (MWU, P = 0.0021], are expressed in fewer tissues (MWU, P < 10−16), have higher expression specificities (MWU, P < 10−16), and are enriched with genes having highest expression in testis (FET, P < 10−16). These results indicate that the observed patterns could not be simply explained by the higher proportion of duplicate genes. On the contrary, when using another set of control genes that have the same expression patterns as nested genes (“expression control genes,” see Materials and Methods), nested genes are not significantly different from control genes with respect to dN/dS, α, or gene age (MWU, P > 0.05 for all comparisons). Accordingly, the evolutionary properties of nested genes might have been the “by-product” of their expressional attributes. However, selection to decouple the functions of nested genes from those of including genes due to their nested structures could have led to the observed narrow expression of nested genes and could be the ultimate cause for the evolutionary properties of nested genes.
While including genes are slowly evolving, highly conserved, broadly expressed, and enriched with genes having their highest expression in brain, nested genes are the opposite: fast evolving, narrowly expressed, and enriched with genes having their highest expression in testis. Thus, positive selection for coregulation in gene expression and biological function, which might have driven the evolution of gene clusters (reviewed in Hurst et al. 2004), is unlikely to apply to the fixation of nested gene structures. The fixation of nested gene structures, similarly to evolution of other complex genomic organizations (Lynch and Conery 2003; Lynch 2006), could have been a nearly neutral process. However, we have evidence supporting the role of natural selection in shaping the relative orientations and functional importance of nested gene structures. We showed that nested/including gene pairs are less likely to be transcribed from the same strand and that same-strand nested genes are more likely to be single-exon genes and have fewer exons if they are multiexon genes. Together with the finding that including genes with same-strand nested genes that contain introns are less likely to be essential for fitness of flies, our results support that selection against missplicing events of same-strand nested/including gene pairs leads to this bias. In addition, the correlations in expressions and biological functions of nested/including gene pairs are lower than those of nearby gene pairs but similar to any two random genes of the same chromosome. This is consistent with the hypothesis that selection against transcriptional interference plays an important role in shaping the functional significance and indirectly affects evolutionary properties of nested gene structures. In sum, despite the proximity of nested and including genes, we found that they are nowhere similar to each other in terms of evolutionary properties, expressional patterns, and biological functions, and selection against the potential deleterious impacts caused by their close proximity might have been the main force governing their evolution.
Materials and Methods
We used D. melanogaster genome annotation version 5.47 and only considered coding transcripts that are annotated as “strongly supported” by FlyBase. For genes that had more than one isoform in nested gene structures, we considered the isoform with the longest coding sequence. We used FlyAtlas Expression data (www.flyatlas.org [last accessed October 17, 2013], Chintapalli et al. 2007), which used four microarrays to measure gene expression for each of the 20 tissues of D. melanogaster at various developmental stages. Genes were considered expressed in a tissue if annotated as “presence” by FlyAtlas for at least three of the four microarrays, and highest expressed tissues were determined by using mean expression levels. Expression specificity, an index between 0 and 1, was calculated as described in the previous paper (Yanai et al. 2005). Broadly expressed genes with similar expression level in all tissues have low indices while tissue-specific genes have high indices. We used the population genomic sequences from Drosophila Population Genomic Project (DPGP, www.dpgp.org [last accessed October 17, 2013]; Langley et al. 2012) and the multispecies alignments (including D. melanogaster, D. simulans, D. yakuba, and D. erecta) as described in Langley et al. (2012) to perform evolutionary genetic analyses. dN/dS on the branch leading to D. melanogaster was estimated using D. melanogaster, D. simulans, and D. yakuba alleles, and PAML (phylogenetic analysis by maximum likelihood) (HKY85 nucleotide substitution model [Hasegawa et al. 1985] and free-ratio branch model [model = 1]). α (McDonald and Kreitman 1991; Smith and Eyre-Walker 2002) was estimated using D. melanogaster within-species polymorphism (using both African and North American alleles of DPGP, total 44 alleles) and D. simulans as an outgroup. Tajima’s D was calculated using North American D. melanogaster population of DPGP, which has a much larger sample size (37) than the African population (7). Gene sizes include the length of coding sequences, intron, and both UTRs. We batch downloaded phenotype data associated with nested genes from FlyBase and classified a gene to be associated with known lethal/sterile phenotype if at least one mutation or one expression knockdown experiment (using RNAi) was reported to be lethal/sterile. Genes that have both reported lethal and sterile phenotypes are denoted as only lethal phenotype.
Control gene pairs are gene pairs less than 500 bp apart and were chosen randomly. The chromosomal distributions were matched: the number of control gene pairs on each chromosome was matched to the number of nested/including gene pairs on the same chromosome. We also used two other sets of control gene pairs: 1) gene pairs that are not adjacent to each other but are on the same chromosome (“random control gene pairs”); 2) gene pairs that are less than 500 bp apart and have the same chromosomal distributions and the same proportion of same/opposite-strand as nested/including gene pairs (“same/opposite control gene pairs”). Our observed correlations in expressional patterns and functional categories of nested/including gene pairs hold when we compared them with same/opposite control gene pairs, but differ when comparing with random control gene pairs (see details in main text). Other comparisons of evolutionary properties and expression patterns between nested/including genes and control genes from different sets of control gene pairs are consistent.
In addition to further tease apart the main evolutionary force that might have led to some of our observations, we generated additional control gene sets that match either the proportion of DNA/RNA-duplicated genes of nested genes (duplication control genes) or gene expression of nested and including genes (expression control genes). Duplication control genes were matched to have the same proportions of DNA and RNA duplicate genes and chromosomal distributions as nested genes. Expression control genes were matched to have the same proportion of expression in testis and brain, the same chromosomal distributions, and similar expression breath and specificity (within 0.25 standard deviations) with nested genes and including genes individually.
We used FET when examining a relationship between two categorical variables and MWU for noncategorical variable between two conditions. We employed logistic regression when studying how a binary outcome variable changes with input variables. The odds ratio was obtained by raising the natural exponent e to the power of the logistic coefficient. Because nested genes have significantly narrower breadth of expression (see earlier), and, accordingly, nested genes are more likely to be expressed in a subset of tissues of including genes by chance. We thus include the number of tissues being expressed as a covariate in the analysis. Otherwise, the only covariate is the binary variable that represents whether it is nested/including gene pair (=1) or control gene pair (=0), and the response variable is the property that is examined. All statistical analyses were performed using R (http://www.R-project.org [last accessed October 17, 2013], R Development Core Team 2006).
Acknowledgments
The authors thank FlyAtlas and DPGP for providing access to gene expression and population genomic data. The authors greatly appreciate Corbin Jones for generously sharing tremendous amount of interesting ideas and helpful discussions. The authors also thank members of the Ilya Ruvinsky lab for discussions, and Russell Corbett-Detig and Pan-Pan Jiang for reading the manuscript. Finally, the authors are grateful to two anonymous reviewers whose helpful comments have greatly improved the work. This work is partly supported by research award of Center for Population Biology, UC Davis to Y.C.G.L. The publication fee is supported by the Harvard Open-Access Publishing Equity (HOPE) fund to H.H.C.
Literature Cited
- Al-Shahrour F, et al. Selection upon genome architecture: conservation of functional neighborhoods with changing genes. PLoS Comput Biol. 2010;6:e1000953. doi: 10.1371/journal.pcbi.1000953. [DOI] [PMC free article] [PubMed] [Google Scholar]
- Assis R, Kondrashov AS, Koonin EV, Kondrashov FA. Nested genes and increasing organizational complexity of metazoan genomes. Trends Genet. 2008;24:475–478. doi: 10.1016/j.tig.2008.08.003. [DOI] [PMC free article] [PubMed] [Google Scholar]
- Boutanaev AM, Kalmykova AI, Shevelyov YY, Nurminsky DI. Large clusters of co-expressed genes in the Drosophila genome. Nature. 2002;420:666–669. doi: 10.1038/nature01216. [DOI] [PubMed] [Google Scholar]
- Chen N, Stein LD. Conservation and functional significance of gene topology in the genome of Caenorhabditis elegans. Genome Res. 2006;16:606–617. doi: 10.1101/gr.4515306. [DOI] [PMC free article] [PubMed] [Google Scholar]
- Chen S, Zhang YE, Long M. New genes in Drosophila quickly become essential. Science. 2010;330:1682–1685. doi: 10.1126/science.1196380. [DOI] [PMC free article] [PubMed] [Google Scholar]
- Chintapalli VR, Wang J, Dow JAT. Using FlyAtlas to identify better Drosophila melanogaster models of human disease. Nat Genet. 2007;39:715–720. doi: 10.1038/ng2049. [DOI] [PubMed] [Google Scholar]
- Clark AG, et al. Evolution of genes and genomes on the Drosophila phylogeny. Nature. 2007;450:203–218. doi: 10.1038/nature06341. [DOI] [PubMed] [Google Scholar]
- Cohen BA, Mitra RD, Hughes JD, Church GM. A computational analysis of whole-genome expression data reveals chromosomal domains of gene expression. Nat Genet. 2000;26:183–186. doi: 10.1038/79896. [DOI] [PubMed] [Google Scholar]
- Elo A, Lyznik A, Gonzalez DO, Kachman SD, Mackenzie SA. Nuclear genes that encode mitochondrial proteins for DNA and RNA metabolism are clustered in the Arabidopsis genome. Plant Cell. 2003;15:1619–1631. doi: 10.1105/tpc.010009. [DOI] [PMC free article] [PubMed] [Google Scholar]
- Haddrill PR, Charlesworth B, Halligan DL, Andolfatto P. Patterns of intron sequence evolution in Drosophila are dependent upon length and GC content. Genome Biol. 2005;6:R67. doi: 10.1186/gb-2005-6-8-r67. [DOI] [PMC free article] [PubMed] [Google Scholar]
- Hasegawa M, Kishino H, Yano T. Dating of the human-ape splitting by a molecular clock of mitochondrial DNA. J Mol Evol. 1985;22:160–174. doi: 10.1007/BF02101694. [DOI] [PubMed] [Google Scholar]
- Horowitz H, Berg CA. Aberrant splicing and transcription termination caused by P element insertion into the intron of a Drosophila gene. Genetics. 1995;139:327–335. doi: 10.1093/genetics/139.1.327. [DOI] [PMC free article] [PubMed] [Google Scholar]
- Hurst LD, Pál C, Lercher MJ. The evolutionary dynamics of eukaryotic gene order. Nat Rev Genet. 2004;5:299–310. doi: 10.1038/nrg1319. [DOI] [PubMed] [Google Scholar]
- Kaer K, Branovets J, Hallikma A, Nigumann P, Speek M. Intronic L1 retrotransposons and nested genes cause transcriptional interference by inducing intron retention, exonization and cryptic polyadenylation. PLoS One. 2011;6:e26099. doi: 10.1371/journal.pone.0026099. [DOI] [PMC free article] [PubMed] [Google Scholar]
- Kaessmann H, Vinckenbosch N, Long M. RNA-based gene duplication: mechanistic and evolutionary insights. Nat Rev Genet. 2009;10:19–31. doi: 10.1038/nrg2487. [DOI] [PMC free article] [PubMed] [Google Scholar]
- Kumar A. An overview of nested genes in eukaryotic genomes. Eukaryot Cell. 2009;8:1321–1329. doi: 10.1128/EC.00143-09. [DOI] [PMC free article] [PubMed] [Google Scholar]
- Langley CH, et al. Genomic variation in natural populations of Drosophila melanogaster. Genetics. 2012;192:533–598. doi: 10.1534/genetics.112.142018. [DOI] [PMC free article] [PubMed] [Google Scholar]
- Larracuente AM, et al. Evolution of protein-coding genes in Drosophila. Trends Genet. 2008;24:114–123. doi: 10.1016/j.tig.2007.12.001. [DOI] [PubMed] [Google Scholar]
- Lee JM, Sonnhammer ELL. Genomic gene clustering analysis of pathways in eukaryotes. Genome Res. 2003;13:875–882. doi: 10.1101/gr.737703. [DOI] [PMC free article] [PubMed] [Google Scholar]
- Lercher MJ, Blumenthal T, Hurst LD. Coexpression of neighboring genes in Caenorhabditis elegans is mostly due to operons and duplicate genes. Genome Res. 2003;13:238–243. doi: 10.1101/gr.553803. [DOI] [PMC free article] [PubMed] [Google Scholar]
- Lercher MJ, Urrutia AO, Hurst LD. Clustering of housekeeping genes provides a unified model of gene order in the human genome. Nat Genet. 2002;31:180–183. doi: 10.1038/ng887. [DOI] [PubMed] [Google Scholar]
- Liao BY, Zhang J. Coexpression of linked genes in mammalian genomes is generally disadvantageous. Mol Biol Evol. 2008;25:1555–1565. doi: 10.1093/molbev/msn101. [DOI] [PMC free article] [PubMed] [Google Scholar]
- Lynch M. The origins of eukaryotic gene structure. Mol Biol Evol. 2006;23:450–468. doi: 10.1093/molbev/msj050. [DOI] [PubMed] [Google Scholar]
- Lynch M, Conery JS. The origins of genome complexity. Science. 2003;302:1401–1404. doi: 10.1126/science.1089370. [DOI] [PubMed] [Google Scholar]
- Maksakova IA, et al. Retroviral elements and their hosts: insertional mutagenesis in the mouse germ line. PLoS Genet. 2006;2:e2. doi: 10.1371/journal.pgen.0020002. [DOI] [PMC free article] [PubMed] [Google Scholar]
- McDonald JH, Kreitman M. Adaptive protein evolution at the Adh locus in Drosophila. Nature. 1991;351:652–654. doi: 10.1038/351652a0. [DOI] [PubMed] [Google Scholar]
- Misra S, et al. Annotation of the Drosophila melanogaster euchromatic genome: a systematic review. Genome Biol. 2002;3:0083.1–83.22. doi: 10.1186/gb-2002-3-12-research0083. [DOI] [PMC free article] [PubMed] [Google Scholar]
- Oliver B, Misteli T. A non-random walk through the genome. Genome Biol. 2005;6:214. doi: 10.1186/gb-2005-6-4-214. [DOI] [PMC free article] [PubMed] [Google Scholar]
- Shearwin KE, Callen BP, Egan JB. Transcriptional interference–a crash course. Trends Genet. 2005;21:339–345. doi: 10.1016/j.tig.2005.04.009. [DOI] [PMC free article] [PubMed] [Google Scholar]
- Smith NGC, Eyre-Walker A. Adaptive protein evolution in Drosophila. Nature. 2002;415:1022–1024. doi: 10.1038/4151022a. [DOI] [PubMed] [Google Scholar]
- Swanson WJ, Vacquier VD. The rapid evolution of reproductive proteins. Nat Rev Genet. 2002;3:137–144. doi: 10.1038/nrg733. [DOI] [PubMed] [Google Scholar]
- Tajima F. Statistical method for testing the neutral mutation hypothesis by DNA polymorphism. Genetics. 1989;123:585–595. doi: 10.1093/genetics/123.3.585. [DOI] [PMC free article] [PubMed] [Google Scholar]
- Trinklein ND, et al. An abundance of bidirectional promoters in the human genome. Genome Res. 2004;14:62–66. doi: 10.1101/gr.1982804. [DOI] [PMC free article] [PubMed] [Google Scholar]
- van de Lagemaat LN, Medstrand P, Mager DL. Multiple effects govern endogenous retrovirus survival patterns in human gene introns. Genome Biol. 2006;7:R86. doi: 10.1186/gb-2006-7-9-r86. [DOI] [PMC free article] [PubMed] [Google Scholar]
- Veeramachaneni V, Makalowski W, Galdzicki M, Sood R, Makalowska I. Mammalian overlapping genes: the comparative perspective. Genome Res. 2004;14:280–286. doi: 10.1101/gr.1590904. [DOI] [PMC free article] [PubMed] [Google Scholar]
- Williams EJB, Bowles DJ. Coexpression of neighboring genes in the genome of Arabidopsis thaliana. Genome Res. 2004;14:1060–1067. doi: 10.1101/gr.2131104. [DOI] [PMC free article] [PubMed] [Google Scholar]
- Yanai I, et al. Genome-wide midrange transcription profiles reveal expression level relationships in human tissue specification. Bioinforma Oxf Engl. 2005;21:650–659. doi: 10.1093/bioinformatics/bti042. [DOI] [PubMed] [Google Scholar]
- Yang Z. PAML 4: phylogenetic analysis by maximum likelihood. Mol Biol Evol. 2007;24:1586–1591. doi: 10.1093/molbev/msm088. [DOI] [PubMed] [Google Scholar]
- Yu P, Ma D, Xu M. Nested genes in the human genome. Genomics. 2005;86:414–422. doi: 10.1016/j.ygeno.2005.06.008. [DOI] [PubMed] [Google Scholar]
- Zhang YE, Vibranovski MD, Krinsky BH, Long M. Age-dependent chromosomal distribution of male-biased genes in Drosophila. Genome Res. 2010;20:1526–1533. doi: 10.1101/gr.107334.110. [DOI] [PMC free article] [PubMed] [Google Scholar]