

Abstract
The lack of long-term evolutionary conservation of microRNA (miRNA) target sites appears to contradict many analyses of their functions. Several hypotheses have been offered, but an attractive one—that the conservation may be a function of taxonomic hierarchy (vertebrates, mammals, primates, etc.)—has rarely been discussed. For such an analysis, we cannot use evolutionary conservation as a criterion of target identification, and hence, have used high confidence target sites in the cross-linking immunoprecipitation (CLIP) data. Assuming that a proportion, p, of target sites in the CLIP data are conserved, we define the evolvability of miRNA targets as 1-p. Genomic data from vertebrate species show that the evolvability between human and fish is very high, at more than 90%. The evolvability decreases to 50% between birds and mammals, 20% among mammalian orders, and only 6% between human and chimpanzee. Within each taxonomic hierarchy, there is a set of targets that are conserved only at that level of evolution. Extrapolating the evolutionary trend, we find the evolvability in any single species to be close to 0%. Thus, all miRNA target sites identified by the CLIP method are evolutionarily conserved in one species, but the conservation is lost step by step in larger taxonomic groups. The changing evolvability of miRNA targets suggests that miRNA-target interactions may play a role in the evolution of organismal diversity.
MicroRNAs (miRNAs) are a group of endogenous small RNAs (∼22 nt) that play an important role in the gene regulatory system (He and Hannon 2004; Stark et al. 2005; Bushati and Cohen 2007; Flynt and Lai 2008; Wu et al. 2009; Aqeilan et al. 2010). A typical miRNA binds to the complementary sequences on target mRNAs, resulting in translational repression or target degradation (Bartel 2009). The evolution of miRNAs has been well studied (Hertel et al. 2006; Christodoulou et al. 2010). miRNAs are present early in the evolution of animals and are generally highly conserved among species (Hertel et al. 2006; Lu et al. 2008; Bartel 2009; Berezikov 2011). Expansion of miRNA families occurs at the base of the bilaterian and the vertebrate lineage and can be observed in the lineage leading to placental mammals, suggesting that miRNAs may be associated with the evolution of organismal diversity (Berezikov 2011).
The evolution of miRNA targets, however, is not well understood. Some studies suggest that a large number of 3′ UTRs of protein-coding genes might be under selection to maintain complementarity to the corresponding miRNAs (Farh et al. 2005; Friedman et al. 2009), whereas others suggest targets to be evolving rapidly (Tang et al. 2010). It must be noted that the majority of the target sites were computationally predicted, with evolutionary conservation being an important criterion (Lewis et al. 2003; Grun et al. 2005; Rajewsky 2006; Sood et al. 2006). This practice may have biased the analysis of target evolution.
To attain an unbiased assessment of target evolution, evolutionary criteria have to be excluded in target identification. Hence, in this study, we used sites identified by physical means, i.e., cross-linking immunoprecipitation (CLIP) to study the evolutionary mode of miRNA binding sites.
Results
Identification of high confidence miRNA binding sites
Recently, high-throughput sequencing of binding sites isolated by cross-linking immunopreciptation has been carried out (Chi et al. 2009; Hafner et al. 2010; Zisoulis et al. 2010; Leung et al. 2011). We first evaluate the reliability of CLIP-identified binding sites before using them for evolutionary analyses. CLIP data are generated previously from human HEK293 cells (Hafner et al. 2010). We consider any sequence in the CLIP cluster containing a 7–8 bp match to the miRNA “seed” region a putative target site. The seed region of the mature miRNA is crucial for miRNA target recognition in animals, as canonical miRNA targets show perfect base-pairing to the miRNA seed (Lewis et al. 2003; Stark et al. 2005; Grimson et al. 2007; Bartel 2009).
Nevertheless, even in CLIP data, there could be nontarget sites mixed in with target sites. Based on the read depth in CLIP cluster and mRNA expression, we develop a “relative enrichment score” for each miRNA in the data (Methods). A high score means the binding sites of the said miRNA are collectively high-confidence target sites. With only 48% of miRNAs having a relative enrichment score of >1, the measure is quite stringent. Not unexpectedly, the relative enrichment scores are positively correlated with miRNA abundance (r = 0.6833, p = 6.496 × 10⁻⁹ by Spearman rank correlation). Highly expressed miRNAs usually have high scores (Fig. 1).
Figure 1.

The relationship between the degree of target site enrichment in the CLIP data and the expression level of the corresponding miRNAs. The latter is presented as the log2 of the sum of all reads of relevant miRNAs. The top 10 enrichment scores are marked with a black solid dot.
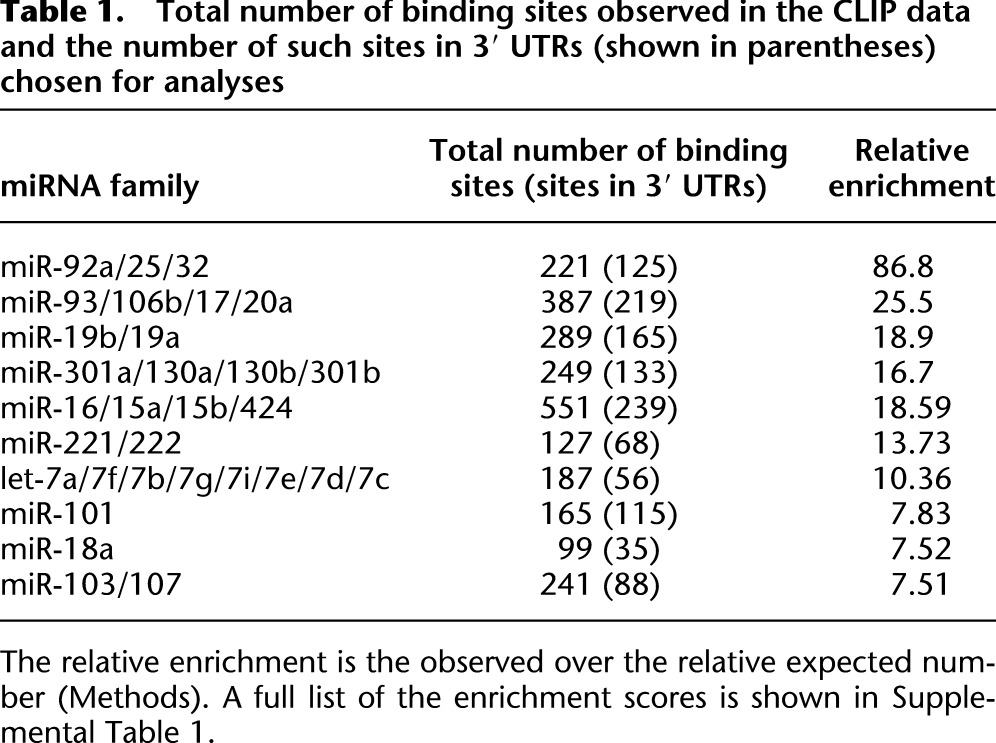
We choose the target sequences of the 10 miRNAs that have the highest relative enrichment scores, ranging from 7 to 87 (Table 1), for analysis. These 10 miRNAs are highly conserved among the species we compared (Methods). Since the top 10 miRNAs account for ∼70% of captured target sequences, we base our analyses on them. However, we will show later that less highly expressed miRNAs with a score between 1 and 7 also have sufficient representations of true targets in the data. We focus on targets sites in 3′ UTRs and exclude target sites in coding regions, which are subjected to other constraints unrelated to miRNA targeting.
Table 1.
Total number of binding sites observed in the CLIP data and the number of such sites in 3′ UTRs (shown in parentheses) chosen for analyses
Validation of CLIP-identified binding sites by expression assay
To further validate the CLIP-identified sites as true targets, we analyze the expression data from miRNA knockdown or overexpression experiments (Selbach et al. 2008; Hafner et al. 2010;). Since the binding sites consist of evolutionarily conserved and nonconserved sites, the expression data on the latter provide an important functional test. If nonconserved CLIP sites are repressed by miRNAs, then the CLIP method is reliable. In addition, nonconserved sites should be true targets as well.
Conserved and nonconserved binding sites are analyzed, respectively. We choose miRNAs with more than 80 3′ UTR binding sites and target genes with one single binding site for analysis (Table 1; Methods). We use human mouse comparison to define site conservation. In all cases, both conserved and nonconserved targets are significantly de-repressed upon miRNA knockdown compared to the control (Fig. 2A–G). In a miR-16 overexpression experiment, both conserved and nonconserved targets are significantly repressed, as expected (Fig. 2H). On average, the nonconserved sites have smaller effects on gene expression than the conserved sites (73% ± 19% in repression efficacy).
Figure 2.
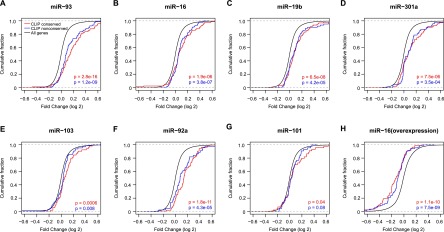
The impact of transfected miRNA inhibitors or miRNAs on conserved or nonconserved target sites. Cumulative distributions of log2 fold change in mRNA expression are shown for (A–G) miRNA knockdown experiments and (H) miR-16 overexpression experiments. CLIP conserved group has sites that are conserved in mouse. CLIP nonconserved group has sites that are not conserved in mouse.
Collectively, we find that target sites identified by the CLIP procedure behave as a collection of true targets. At the level of individual targets, 20%–30% of the conserved targets in the miRNA knockdown experiment do not increase the expression. Likewise, ∼10% do not decrease the expression when the regulating miRNA is overexpressed. It should not be expected that all true targets would appear as if they were solely affected by their regulating miRNAs. In addition to the measurement errors, the feedback loops and other systems motifs would often interfere with the miRNA-target interactions. Previous studies(Karres et al. 2007; Wu et al. 2009; Tang et al. 2010) have shown that true targets, as determined by transient perturbation experiments, often do not show the expected up- or down-regulation when miRNAs have been deleted or inserted, presumably due to the feedbacks or other complex downstream effects.
Evolutionary constraints on miRNA binding sites in mammals
Given the high-confidence target sites identified above, we analyze their evolution among 10 different mammalian orders for which high-quality genome assemblies are available. The 6-mer core sites at positions 2–7 are used. Among the ∼1200 target sites identified in humans, the level of conservation ranges from 0 (target sites not found outside of humans) to 10 species and appears to have a bimodal distribution (Fig. 3A). Because mammalian orders diverged from one another in a brief period of time, often referred to as the mammalian radiation (Springer et al. 2003; Bininda-Emonds et al. 2007), their evolution should be nearly independent and the distribution should be approximately binomial. The observed bimodal distribution thus suggests the existence of two classes of target sites, one being evolutionarily constrained and the other unconstrained.
Figure 3.

CLIP target site evolution. (A) The conservation of target sites in 10 species of mammals which are compared with human. (B) The conservation of randomly selected 6-mer sites in 3′ UTRs. The x-axis indicates the number of nonhuman species in which the sites are conserved. (C) The observed and expected proportions of sites that are conserved between human and other vertebrates. The divergence times between human and one of the other selected species are shown in parentheses.
We assume that sites of the unconstrained class decay at a rate u, which follows the evolutionary dynamics of nontarget background sequences in the 3′ UTR. The degree of 3′ UTR conservation in the 10 species of mammals is shown in Figure 3B. It is further assumed that targets in the constrained class decay at a rate v that follows a gamma distribution. The objective is then to estimate the proportion of constrained sites, p, as well as the parameters α and β of the gamma distribution. The empirical maximum likelihood estimation (MLE) values for fitting the distribution to the observed data (Fig. 3A) are p = 0.794, α = 0.48, and β = 160.52. Hence, in mammals, 20.6% (1-p) of the sites decay at the same rate as the background 6-mers, while 79.4% of the sites decay much more slowly at a rate of v. The distributions of u and v are given in Supplemental Figure 1.
We repeat the analysis on three subsets of the target sites. First, to avoid the mutational rate heterogeneity due to CpG sites, we repeat the analysis by excluding CpG dinucleotides. Second, an analysis with a stringent definition of orthology that requires genic synteny is performed. Third, to exclude possible synergistic interactions among multiple sites on the same gene, we also analyze the group of single-site genes (one binding site per gene). For all three subsets, the evolutionary patterns in mammals (Supplemental Fig. 2A) and in other vertebrates (Supplemental Fig. 2B) are the same as the full set. Furthermore, we extend the 6-mer core sites to the three seed-types, including 1A, m8, and 8-mer sites. The evolutionary patterns are essentially the same as those of the 6-mer core sites (Supplemental Fig. 2C,D).
Evolutionary constraints on miRNA binding sites in vertebrates
The proportion of evolutionarily changeable targets (1-p), which defines the evolvability of miRNA targets, is about 0.2 in mammals. We now estimate the evolvability in hierarchies above and below mammalian orders within vertebrates. The levels are at 6, 30, 90, 164, 300, and 400 million years (Myrs) for the divergence between humans and, respectively, chimpanzees, old world monkeys, other eutherian orders of mammals, marsupials, birds, and fishes. The simplest hypothesis for target site evolution is constant evolvability, i.e., p stays constant. Furthermore, the conservation of target sites is a function of divergence time. The expected decrease in the percentage of site conservation is given in Figure 3C, where p is constant at 0.79 as estimated above. The observed decay increases much more rapidly than the expectation based solely on the divergence time. A possible explanation is that p changes as a function of divergence time.
We therefore estimate p at all levels of vertebrate evolution by using the data in Figure 3C. Unlike the analysis at the depth of 90 Myrs, where we compared 10 mammalian species, there is only one species at each level of comparison with humans. In these cases, the number of conserved species is either 0 or 1. To avoid overfitting the data, we used two different methods for estimating p (see Methods). Briefly, we used the mean value as well as a fitted distribution for u, the latter having been implemented for mammals already. By either method, the estimated p decreases as the test species become more divergent from human. It decreases from ∼80% among mammals to slightly less than 50% between human and bird, to less than 10% between human and fish (Table 2). In the estimation by the variable-u method, which has a better fit to the data, the value of p within humans is close to 100% by extrapolation.
Table 2.
Estimated proportions of conserved miRNA target sites (p) between humans and other vertebrate groups

During vertebrate evolution, the evolvability of miRNA targets experiences two large dips―from fish to warm-blooded vertebrates (90%–50%) and from birds to eutherian mammals (50%–18%). The lowered evolvability in the eutherians from the warm-blooded ancestors indicates that 32% (= 50%–18%) of miRNA targets are newly constrained in mammalian evolution. We shall refer to these genes as (newly evolved) mammal-specific targets, or Mst for short. Mst genes are conserved because there are mammal-specific properties that constrain target evolution in mammals. This conclusion can be seen more intuitively in the comparison between Figure 3, A and C. In Figure 3C, fewer than 10% of sites are conserved in the 800 Myrs between fish and human (400 Myrs × 2) (Kumar and Hedges 1998). In 900 Myrs of evolution in the 10 species of mammals (assuming 90 Myrs per mammalian lineage), 25%–45% of the sites have been conserved.
To show that the Mst genes are evolutionarily significant in mammals, we compare the evolutionary constraints in their coding regions with a control group composed of genes with nonconserved target sites in mammals. The constraint is expressed as the relative rate of nonsynonymous versus synonymous substitutions (dN/dS). Figure 4 shows the cumulative distributions of dN/dS for the Mst genes and the control. Among mammals, the coding regions of Mst genes appear to evolve in concert with the target sites in 3′ UTRs, as both regions are more conserved for the Mst genes than for the control (two-sample KS test, P = 0.0075).
Figure 4.

Cumulative distributions of the dN/dS ratio for Mst genes and the control group. Mst genes have target sites that are conserved in 10 mammalian species. The control group genes have target sites that are not conserved in mammals.
Further tests of target site evolution
If the above hypothesis on the evolution of miRNA targets is general, then it should be able to pass two tests. First, the evolutionary pattern should be observable for all properly defined sets of miRNA target sites. Second, this pattern should be stronger in miRNA target sites than in other conservative sites in the genome.
For the first test, we note that the high score of relative enrichment used in the main analysis is a very stringent criterion. Although nearly 70% of CLIP-captured sites are included, only a small number of highly expressed miRNAs are used. Supplemental Figure 3, A and B show that target sites with a relative enrichment score of >1 exhibit a similar evolutionary dynamics. In this expanded list, nearly half of the expressed miRNAs families in the cell lines are included. Hence, the CLIP-identified target sites of less highly expressed miRNAs show the same evolutionary pattern as well.
We further analyze target sites identified by miRNA perturbation experiments in TarBase (Lim et al. 2005; Sethupathy et al. 2006; Selbach et al. 2008). Figure 5, A and B use data from transfection experiments that monitored the levels of mRNA and protein changes, respectively, after perturbation. Target sites in both panels show the same trend as the CLIP data. Among the 10 mammalian species, 17%–23% of target sites are conserved in 900 Myrs of evolution, whereas only 4% are conserved between human and fish in a shorter elapsed time (800 Myrs). In comparison with CLIP sites, target sites identified by these two types of transfection experiments are less conserved. As explained earlier, both false positive and false negative rates in target identification are high in expression assays because of feedbacks and other expression compensations. Hence, if the sole purpose is to identify target sites, CLIP data may be more appropriate for reasons of higher signal/noise ratios and the ease in scaling up to genome-wide data acquisition.
Figure 5.

Other target site evolutions. (A) The conservation of another collection of target sites in 10 species of mammals which are compared with human. Lim et.al. (2005) and Selbach et al. (2008) data are from transfection experiments that monitored the levels of mRNA and protein changes, respectively, after perturbation. (B) The observed proportions of sites that are conserved between human and other vertebrates. The legend is shared by A and B. (C) The conservation of randomly selected 6-mers in CDS region of CLIP target genes in 10 species of mammals which are compared with human. (D) The observed proportions of CDS 6-mer sites that are conserved between human-mouse and human-zebrafish. The legend is shared by C and D.
For the second test, we analyze randomly selected 6-mer sites in the coding regions that are not miRNA targets. While Figure 5C shows that CLIP sites are more conserved than these coding DNA sequence (CDS) sites in mammals (24% of CLIP sites conserved in all 10 mammals vs. 8% of CDS sites), Figure 5D shows the opposite trend in the longer-term evolution. Albeit more conserved in the mammals, CLIP sites become less conserved between human and fish (5.5% conserved vs 9.1% for CDS sites). These other types of conservative sites in the genome may not be strictly constant either, as Fitch and Margoliash (Bitar et al. 1972; Fitch 1976) demonstrated for cytochrome c sequences many years ago. However, the changes in evolvability are apparent for these other sequences only over a much longer time span, and indeed there is generally adequate consensus on whether a coding sequence is evolutionarily conserved or not. In contrast, the uncertainty and disagreement over miRNA target site conservation (Farh et al. 2005; Chen and Rajewsky 2006a,b) may be a reflection of the rapid changes in their degree of evolutionary conservation.
Discussion
In this study, the portion of miRNA target sites that are conserved is shown to be evolving over time. As a result, there is too much conservation when closely related species (say, between primates) are examined, or there is too little conservation when distantly related species (such as between birds and mammals) are compared. This may help to explain the lack of a consensus on the degree of conservation of miRNA target sites (Farh et al. 2005; Chen and Rajewsky 2006a,b).
Given the evolving evolvability of miRNA targets, a salient feature of the pattern is the near 0% evolvability when the trend is extrapolated to the smallest taxonomic taxon, namely, a single species. Human polymorphic data showed these miRNA target sites are much less polymorphic than the rest of 3′ UTRs (Supplemental Table 2). The pattern suggests stronger selective constraints in the former than in the latter. These constraints are consistent with the hypothesis that most target sites with matching seed sequences are functional, at least for the duration commensurate with the time scale of population genetic processes. This implies that most target sites bound by the RISC complex with matching seed sequences are evolutionarily constrained, at least for a short evolutionary period. In other words, all sites identified in the CLIP data are likely functional, but some will not remain so for long.
Functional analysis corroborates that the CLIP method captures functional target sites and that nonconserved CLIP sites are likely to be functional as well. We examined two cancer-related miRNA families to further elucidate the relationship between conserved and nonconserved targets. The DAVID bioinformatics tools are used in the analysis of pathway enrichment for CLIP sites. In the first family, miR-15/16 are known to act as tumor suppressors (Aqeilan et al. 2010), and both their conserved and nonconserved targets are enriched in cancer-related pathways (Supplemental Table 3). The two target groups may even act synergistically in the same biological process. The second miR-17/20/93 family acts to promote proliferation, inhibit differentiation, and sustain cell survival (He et al. 2005; Grillari et al. 2010; Olive et al. 2010). The conserved targets of this family are enriched for genes in the TGF-beta pathway (Supplemental Table 3; Mestdagh et al. 2010) and the nonconserved targets are enriched for genes in the TP53 signaling pathway (Supplemental Table 3). Hence, the two target groups function in related pathways.
In mammals, 32% of target sites became newly conserved at the onset of mammalian radiation. The constraints are imposed on both miRNA target sites and the corresponding coding regions. These constraints are probably a manifestation of newly evolved functions in mammals, and the miRNA binding sites acted as the regulators of these new functions. Because miRNAs cover almost all pathways and the biology probably involves most aspects of being a mammal, it is not surprising that the mammal-specific set is not restricted to something obvious, like mammary. There are two significant shifts in miRNA targeting in our study―from fish to warm-blooded vertebrates and from birds to eutherian mammals. Between birds and eutherian mammals, there is only one splinter group on the phylogenetic tree until the beginning of the mammalian radiation. Then, in a short period of time, many major orders emerged. The genetic architecture must have been shaped before the radiation and, presumably, miRNAs and their targets are part of that architecture that permitted these many forms to be based on it.
Methods
miRNA selection
We chose the top 100 expressed miRNAs in HEK293 cells that were surveyed by deep sequencing and merged them into 64 distinct miRNA seeds for analysis (Supplemental Table 4).
For the evolutionary analysis of miRNA target sites, we first selected the miRNAs which are conserved between human and zebrafish. The conservation of these miRNAs in other mammals and vertebrates is then confirmed. We allowed a miRNA to be missing in at most three of the 16 species (Supplemental Table 5) since some genomes are still incomplete. We then required the observed ones to have the fully conserved seed.
Relative enrichment score estimation
A CLIP cluster is a group of overlapping reads, obtained by the CLIP technique, which are mapped to the same genomic location (Hafner et al. 2010). To reduce the false positive rate in the binding site identification, we filter CLIP clusters according to T/C mutations occurring at the cross-linking sites, and extracted only the 11-nt downstream region of T/C sites to represent the CLIP cluster, which is found to be the most enriched of miRNA target sites (Hafner et al. 2010).
The 12-nt CLIP clusters with cross-linking T/C sites and the depth of the cluster were extracted from the supplementary files of Hafner et al. (2010). The genomic positions were converted to hg19 using the UCSC LiftOver tool and annotated using refGene files downloaded from the UCSC Genome Browser (Fujita et al. 2011). The enrichment scores for all the CLIP clusters and CLIP clusters that mapped to 3′ UTR regions were calculated, respectively.
We considered any sequence in the CLIP cluster containing a 7–8 bp match to position 2-8 (m8), or position 2-8 plus A in position 1 (8-mer), or position 2-7 plus A in position 1 (1A) of the miRNA as a putative target site (Bartel 2009). Because the binding strength of nontarget sequences by the CLIP procedure is not known, we developed a measure, referred to as the relative enrichment score, for the overrepresentation of binding site sequences in the data. A high score means the binding sites of the said miRNA are high-confidence target sites.
The relative enrichment score is the ratio of reads complementary to a given miRNA seed in the observed proportion of CLIP clusters to the expected proportion by chance among the expressed transcriptome. The observed proportion of target reads was calculated as the number of total reads in the CLIP cluster containing a given miRNA target divided by the total number of reads in all the CLIP clusters. The expected proportion was the ratio of expressed copies of genes with a given miRNA seed to the total number of copies of genes expressed in HEK293, normalized by gene length.
For example, the number of reads in CLIP clusters identified as binding sites of miR-92a was 28,653, out of 368,496 total reads in all the CLIP clusters (∼0.0784/12 nt). The expected proportion of miR-92a binding sites in the transcriptome by chance is 0.000896/12 nt. Therefore, the enrichment score for miR-92a is 0.078/0.000896≈86.77.
The gene expression profile of the HEK293 cell line was downloaded from the GEO database (GSE21578).
Microarray data of miRNA knockdown or overexpression experiments
We used previously reported miRNA knockdown data (GSE21577) (Hafner et al. 2010). In this data set, HEK293 cells were transfected with miRNA inhibitors, followed by microarray analysis of the change of mRNA expression levels. For miR-16, we also used previously reported overexpression data (Selbach et al. 2008). Only genes with one target site were chosen for analysis. To calculate the repression efficacy for each target group, we first calculated the average fold changes of targets for each miRNA. We then divided the average fold change of CLIP-nonconserved targets by that of CLIP-conserved targets to get the relative repression efficacy for each miRNA. Finally, we calculated the mean and standard deviation of relative repression efficacies.
Binding sites evolution analyses
To examine the conservation of the binding sites, we extracted the binding sites from pairwise alignments, which is more accurate than multiple alignments. We downloaded the pairwise alignment files between human and other species from the UCSC database (http://genome.ucsc.edu/). The sequences of the 6-mer core sites for each species were extracted from the pairwise alignment according to the site positions for human. For analysis of binding site conservation in mammalians species, we obtained dog, cow, mouse, pig, panda, guinea pig, horse, cat, elephant, and rabbit alignments. For the vertebrate analyses, we used chimpanzee, rhesus, opossum, chicken, and zebrafish alignments (Kumar and Hedges 1998; Goodman 1999). In order to reduce potential errors from poor genome sequence quality, we eliminated a species from consideration if there was no sequence for that species, whereas the other nine species were aligned well. For randomly sampled 3′ UTR and CDS, 6-mer sites were extracted from the 3′ UTR and CDS region of target genes. The conservation of the random sites was analyzed in the same way as for the binding sites.
Decay rate r of binding sites was defined as change of site per Myrs. The evolutionary conservation of any site follows the exponential decay function, exp(−rt). Two methods were used to estimate the background evolution rate by maximum likehood estimation. In brief, a constant average background decay rate was estimated from the observation. For a better fit, an exponential distribution was employed to estimate the decay rate in 3′ UTR regions (Supplemental Fig. 4). The decay rate of miRNA binding sites was assumed to follow a gamma distribution. The proportion of constrained sites p, and the parameters of gamma were estimated from the observed data in R statistical analysis software. An R package called maxLik was used for the MLE (http://www.maxlik.org/).
TarBase target selection
Experimentally supported miRNA target genes were first downloaded from TarBase 5.0 (Sethupathy et al. 2006). To attain an unbiased assessment of target evolution, evolutionary criteria have to be excluded in target identification. We, therefore, selected target genes identified without any conservation requirement, i.e., targets from two expression perturbation experiments (Lim et al. 2005; Selbach et al. 2008), for further analysis. Target genes with seed match to the transfected miRNA were selected as target genes. The conservation analysis of these target sites was done as CLIP sites described above.
CDS conservation estimation
We downloaded the CDS alignments of 45 vertebrate genomes from the UCSC Genome Bioinformatics site (http://hgdownload.cse.ucsc.edu/downloads.html#human). Alignments for nine mammalian species (human, dog, cow, mouse, guinea pig, horse, cat, elephant, and rabbit) were extracted from the multiple alignment files. The dN/dS ratio for each group of genes was calculated by PAML (Yang 2007) with model 0.
Pathway analysis
We used the DAVID bioinformatics resources for pathway analysis (Huang et al. 2009). The expressed mRNAs in HEK293 cells were used as backgrounds. Enriched pathways with EASE Score ≤ 0.05 and fold enrichment ≥ 2 were chosen. The EASE Score test is a modified Fisher's exact test that uses a jackknife procedure similar to resampling to correct for multiple testing but with higher power (Blüthgen et al. 2005).
Acknowledgments
This study was supported by grants from the National Key Basic Research Program of China to C.I.W. (2014CB542006) and National Programs for High Technology Research and Development to X.M.L. (2012AA022502); National Natural Science Foundation of China to C.I.W. (31130069, 31161120358), X.M.L. (31071914,91131903), and Y.S. (31200945). We thank Weiwei Zhai, Shuangli Mi, Tian Tang, and Eric Hungate for extensive discussions and critical reading of the manuscript.
Footnotes
[Supplemental material is available for this article.]
Article published online before print. Article, supplemental material, and publication date are at http://www.genome.org/cgi/doi/10.1101/gr.148916.112.
References
- Aqeilan RI, Calin GA, Croce CM 2010. miR-15a and miR-16-1 in cancer: Discovery, function and future perspectives. Cell Death Differ 17: 215–220 [DOI] [PubMed] [Google Scholar]
- Bartel DP 2009. MicroRNAs: Target recognition and regulatory functions. Cell 136: 215–233 [DOI] [PMC free article] [PubMed] [Google Scholar]
- Berezikov E 2011. Evolution of microRNA diversity and regulation in animals. Nat Rev Genet 12: 846–860 [DOI] [PubMed] [Google Scholar]
- Bininda-Emonds ORP, Cardillo M, Jones KE, MacPhee RDE, Beck RMD, Grenyer R, Price SA, Vos RA, Gittleman JL, Purvis A 2007. The delayed rise of present-day mammals. Nature 446: 507–512 [DOI] [PubMed] [Google Scholar]
- Bitar KG, Vinogradov SN, Nolan C, Weiss LJ, Margoliash E 1972. The primary structure of cytochrome c from the rust fungus Ustilago sphaerogena. Biochem J 129: 561–569 [DOI] [PMC free article] [PubMed] [Google Scholar]
- Blüthgen N, Brand K, Cajavec B, Swat M, Herzel H, Beule D 2005. Biological profiling of gene groups utilizing Gene Ontology. Genome Inform 16: 106–115 [PubMed] [Google Scholar]
- Bushati N, Cohen SM 2007. microRNA functions. Annu Rev Cell Dev Biol 23: 175–205 [DOI] [PubMed] [Google Scholar]
- Chen K, Rajewsky N 2006a. Deep conservation of microRNA-target relationships and 3′UTR motifs in vertebrates, flies, and nematodes. Cold Spring Harb Symp Quant Biol 71: 149–156 [DOI] [PubMed] [Google Scholar]
- Chen K, Rajewsky N 2006b. Natural selection on human microRNA binding sites inferred from SNP data. Nat Genet 38: 1452–1456 [DOI] [PubMed] [Google Scholar]
- Chi SW, Zang JB, Mele A, Darnell RB 2009. Argonaute HITS-CLIP decodes microRNA-mRNA interaction maps. Nature 460: 479–486 [DOI] [PMC free article] [PubMed] [Google Scholar]
- Christodoulou F, Raible F, Tomer R, Simakov O, Trachana K, Klaus S, Snyman H, Hannon GJ, Bork P, Arendt D 2010. Ancient animal microRNAs and the evolution of tissue identity. Nature 463: 1084–1088 [DOI] [PMC free article] [PubMed] [Google Scholar]
- Farh KK-H, Grimson A, Jan C, Lewis BP, Johnston WK, Lim LP, Burge CB, Bartel DP 2005. The widespread impact of mammalian microRNAs on mRNA repression and evolution. Science 310: 1817–1821 [DOI] [PubMed] [Google Scholar]
- Fitch WM 1976. The molecular evolution of cytochrome c in eukaryotes. J Mol Evol 8: 13–40 [DOI] [PubMed] [Google Scholar]
- Flynt AS, Lai EC 2008. Biological principles of microRNA-mediated regulation: Shared themes amid diversity. Nat Rev Genet 9: 831–842 [DOI] [PMC free article] [PubMed] [Google Scholar]
- Friedman RC, Farh KK, Burge CB, Bartel DP 2009. Most mammalian mRNAs are conserved targets of microRNAs. Genome Res 19: 92–105 [DOI] [PMC free article] [PubMed] [Google Scholar]
- Fujita PA, Rhead B, Zweig AS, Hinrichs AS, Karolchik D, Cline MS, Goldman M, Barber GP, Clawson H, Coelho A et al. 2011The UCSC Genome Browser Database: Update 2011. Nucleic Acids Res 39: D876–D882 [DOI] [PMC free article] [PubMed] [Google Scholar]
- Goodman M 1999. The genomic record of Humankind's evolutionary roots. Am J Hum Genet 64: 31–39 [DOI] [PMC free article] [PubMed] [Google Scholar]
- Grillari J, Hackl M, Grillari-Voglauer R 2010. miR-17-92 cluster: Ups and downs in cancer and aging. Biogerontology 11: 501–506 [DOI] [PMC free article] [PubMed] [Google Scholar]
- Grimson A, Farh KK-H, Johnston WK, Garrett-Engele P, Lim LP, Bartel DP 2007. MicroRNA targeting specificity in mammals: Determinants beyond seed pairing. Mol Cell 27: 91–105 [DOI] [PMC free article] [PubMed] [Google Scholar]
- Grun D, Wang Y-L, Langenberger D, Gunsalus KC, Rajewsky N 2005. microRNA target predictions across seven Drosophila species and comparison to mammalian targets. PLoS Comput Biol 1: e13. [DOI] [PMC free article] [PubMed] [Google Scholar]
- Hafner M, Landthaler M, Burger L, Khorshid M, Hausser J, Berninger P, Rothballer A, Ascano M Jr, Jungkamp A-C, Munschauer M, et al. 2010. Transcriptome-wide identification of RNA-binding protein and microRNA target sites by PAR-CLIP. Cell 141: 129–141 [DOI] [PMC free article] [PubMed] [Google Scholar]
- He L, Hannon GJ 2004. MicroRNAs: Small RNAs with a big role in gene regulation. Nat Rev Genet 5: 522–531 [DOI] [PubMed] [Google Scholar]
- He L, Thomson JM, Hemann MT, Hernando-Monge E, Mu D, Goodson S, Powers S, Cordon-Cardo C, Lowe SW, Hannon GJ, et al. 2005. A microRNA polycistron as a potential human oncogene. Nature 435: 828–833 [DOI] [PMC free article] [PubMed] [Google Scholar]
- Hertel J, Lindemeyer M, Missal K, Fried C, Tanzer A, Flamm C, Hofacker IL, Stadler PF, The Students of Bioinformatics Computer Labs 2004 and 2005 2006. The expansion of the metazoan microRNA repertoire. BMC Genomics 7: 25–25 [DOI] [PMC free article] [PubMed] [Google Scholar]
- Huang DW, Sherman BT, Lempicki RA 2009. Systematic and integrative analysis of large gene lists using DAVID bioinformatics resources. Nat Protoc 4: 44–57 [DOI] [PubMed] [Google Scholar]
- Karres JS, Hilgers V, Carrera I, Treisman J, Cohen SM 2007. The conserved microRNA miR-8 tunes atrophin levels to prevent neurodegeneration in Drosophila. Cell 131: 136–145 [DOI] [PubMed] [Google Scholar]
- Kumar S, Hedges SB 1998. A molecular timescale for vertebrate evolution. Nature 392: 917–920 [DOI] [PubMed] [Google Scholar]
- Leung AKL, Young AG, Bhutkar A, Zheng GX, Bosson AD, Nielsen CB, Sharp PA 2011. Genome-wide identification of Ago2 binding sites from mouse embryonic stem cells with and without mature microRNAs. Nat Struct Mol Biol 18: 237–244 [DOI] [PMC free article] [PubMed] [Google Scholar]
- Lewis BP, Shih IH, Jones-Rhoades MW, Bartel DP, Burge CB 2003. Prediction of mammalian microRNA targets. Cell 115: 787–798 [DOI] [PubMed] [Google Scholar]
- Lim LP, Lau NC, Garrett-Engele P, Grimson A, Schelter JM, Castle J, Bartel DP, Linsley PS, Johnson JM 2005. Microarray analysis shows that some microRNAs downregulate large numbers of target mRNAs. Nature 433: 769–773 [DOI] [PubMed] [Google Scholar]
- Lu J, Shen Y, Wu Q, Kumar S, He B, Shi S, Carthew RW, Wang SM, Wu C-I 2008. The birth and death of microRNA genes in Drosophila. Nat Genet 40: 351–355 [DOI] [PubMed] [Google Scholar]
- Mestdagh P, Boström A-K, Impens F, Fredlund E, Van Peer G, De Antonellis P, von Stedingk K, Ghesquière B, Schulte S, Dews M, et al. 2010. The miR-17-92 microRNA cluster regulates multiple components of the TGF-β pathway in neuroblastoma. Mol Cell 40: 762–773 [DOI] [PMC free article] [PubMed] [Google Scholar]
- Olive V, Jiang I, He L 2010. mir-17-92, a cluster of miRNAs in the midst of the cancer network. Int J Biochem Cell Biol 42: 1348–1354 [DOI] [PMC free article] [PubMed] [Google Scholar]
- Rajewsky N 2006. microRNA target predictions in animals. Nat Genet (Suppl) 38: S8–S13 [DOI] [PubMed] [Google Scholar]
- Selbach M, Schwänhausser B, Thierfelder N, Fang Z, Khanin R, Rajewsky N 2008. Widespread changes in protein synthesis induced by microRNAs. Nature 455: 58–63 [DOI] [PubMed] [Google Scholar]
- Sethupathy P, Corda B, Hatzigeorgiou AG 2006. TarBase: A comprehensive database of experimentally supported animal microRNA targets. RNA 12: 192–197 [DOI] [PMC free article] [PubMed] [Google Scholar]
- Sood P, Krek A, Zavolan M, Macino G, Rajewsky N 2006. Cell-type-specific signatures of microRNAs on target mRNA expression. Proc Natl Acad Sci 103: 2746–2751 [DOI] [PMC free article] [PubMed] [Google Scholar]
- Springer MS, Murphy WJ, Eizirik E, O'Brien SJ 2003. Placental mammal diversification and the Cretaceous–Tertiary boundary. Proc Natl Acad Sci 100: 1056–1061 [DOI] [PMC free article] [PubMed] [Google Scholar]
- Stark A, Brennecke J, Bushati N, Russell RB, Cohen SM 2005. Animal microRNAs confer robustness to gene expression and have a significant impact on 3′UTR evolution. Cell 123: 1133–1146 [DOI] [PubMed] [Google Scholar]
- Tang T, Kumar S, Shen Y, Lu J, Wu M-L, Shi S, Li W-H, Wu C-I 2010. Adverse interactions between micro-RNAs and target genes from different species. Proc Natl Acad Sci 107: 12935–12940 [DOI] [PMC free article] [PubMed] [Google Scholar]
- Wu C-I, Shen Y, Tang T 2009. Evolution under canalization and the dual roles of microRNAs—a hypothesis. Genome Res 19: 734–743 [DOI] [PMC free article] [PubMed] [Google Scholar]
- Yang Z 2007. PAML 4: Phylogenetic Analysis by Maximum Likelihood. Mol Biol Evol 24: 1586–1591 [DOI] [PubMed] [Google Scholar]
- Zisoulis DG, Lovci MT, Wilbert ML, Hutt KR, Liang TY, Pasquinelli AE, Yeo GW 2010. Comprehensive discovery of endogenous Argonaute binding sites in Caenorhabditis elegans. Nat Struct Mol Biol 17: 173–179 [DOI] [PMC free article] [PubMed] [Google Scholar]