

Microbial genomics and related transcriptomics methods rely on culturing techniques to obtain enough DNA suitable for high‐throughput sequencing without resorting to DNA amplification techniques. A few microgram of DNA is needed for most common next‐generation sequencing methods. For transcriptome analysis, sufficient cDNA is needed to measure low abundance mRNA copies in the cell. However, the large majority of microbes on earth resist cultivation, hampering research into their relevant gene pool, ecological niche or industrial relevance. For example, many environmental or gut‐related species cannot be grown outside their natural habitat. Even if we isolate the metagenome or the metatranscriptome from these environments, this reveals only a fragmented sequence landscape that is difficult to assign to individual species. Although enrichment techniques or metatransciptome analysis of previously unculturable species have been shown to assist in directed culturing, e.g. of a Rikenella‐like bacterium (Bomar et al., 2011), the unravelling of a complex metagenome into its individual genomes and their organization is impossible using current technologies.
A major challenge is the analysis of bacteria and other organisms living inside a complex matrix, like biofilms. Metagenome or transcriptome analysis of microorganisms has been described for biofilms consisting of a single species by scraping of the biofilm to obtain enough material (Holmes et al., 2006), but for multi‐species biofilms this method results in a metagenome or metatranscriptome dataset. The solution to these challenges may be the isolation and genomic analysis of unculturable single cells isolated from such environments. Here we describe in brief the state‐of‐the‐art in single‐cell microbial genomics.
Single‐cell isolation
Several methods exist to extract and investigate single microbial cells from their environment. Flow cytometry or fluorescence‐activated cell sorting (FACS) has been used since the 1970s and its applications in microbiology were recognized early (Fouchet et al., 1993); recent advances are described by Müller and Nebe‐von‐Caron (2010), Wang and Bodovitz (2010), and Wang et al. (2010). Micromanipulation has been described by Kvist et al. (2007) and more recently by Woyke et al. (2010). Microfluidic device techniques are shown to be effective by combining the separation of cells and subsequently performing biochemical reactions on the device itself, thereby maximizing reaction yield (Marcy et al., 2007a) (Fig. 1).
Figure 1.
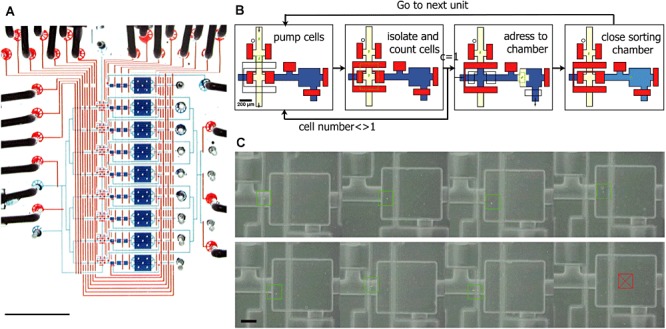
Photograph of a single‐cell isolation and genome amplification chip capable of processing nine samples in parallel (eight cells, one positive control). A. To visualize the architecture, the channels and chambers have been filled with blue food colouring and the control lines to actuate the valves have been filled with red food colouring (scale bar 5 mm). B. Schematic diagram of the automated sorting procedure. Closed valves are shown in red, open valves are transparent. Cells are drawn in green. C. Typical result of cell sorting showing for each unit (seven with a single cell and one negative control without a cell) a colour combination of a phase contrast image (gray) and a fluorescence image (green). A green overlaid square has been placed around the cell to ease visualization, whereas a red crossed square indicates the absence of cell. Scale bar is 100 µm. Reprinted from Marcy et al. (2007a).
Single‐cell genome sequencing and data analysis
Whereas classical next‐generation sequencing to determine an organism's genome sequence relies on pooling DNA from 106–108 cells, single‐cell genomics relies on whole‐genome amplification from a single cell. Most studies rely on Multiple displacement amplification (MDA), a biochemical amplification technique using random primers and ϕ29 DNA polymerase (Dean et al., 2001; Raghunathan et al., 2005; Zhang et al., 2006; Marcy et al., 2007a). Other amplification techniques like random‐primed PCR result in a more over‐ and under‐representation of different regions of the template DNA and generate very short fragments (Dean et al., 2001; Hosono et al., 2003). MDA, however, results in fragments of 12–100 kb rendering them suitable for sequencing. Although the complete microbial genome from a single cell can be amplified to amounts required for current sequencing methods without a priori sequence knowledge, early studies suggested that up to 40% of the genomic sequence was missed (Podar et al., 2007; Marcy et al., 2007b; Woyke et al., 2009) (Table 1).
Table 1.
Examples of single‐cell genome sequencing.
| Microorganism | Assembled bases (Mb) | Estimated % genome recovery | Scaffolds | Contigs | GC% | Single cell separation | Isolation source | Reference |
|---|---|---|---|---|---|---|---|---|
| TM7a (new phylum) | 2.865 | ? | 1825 | 34.3 | Microfluidics | Human mouth biofilm | Marcy et al. (2007b) | |
| TM7_GTL1 (new phylum) | 0.679 | ? | 132 | 48.5 | FISH/FACS | Soil | Podar et al. (2007) | |
| Prochlorococcus MED4 | 95 | 755 | FACS | Sea water; lab culturea | Rodrigue et al. (2009) | |||
| Flavobacterium MS024‐2A | 1.905 | 91 | 17 | 36 | Flow cytometer | Coastal water, Maine, USA | Woyke et al. (2009) | |
| Flavobacterium MS024‐3C | 1.505 | 78 | 21 | 39 | Flow cytometer | Coastal water, Maine, USA | Woyke et al. (2009) | |
| Cand. Sulcia muelleri DMIN | 0.244 | 100 | 1 | 1 | 22.5 | Micromanipulator | Symbiont from insect bacteriome (green sharpshooter) | Woyke et al. (2010) |
| Poribacteria | 1.885 | 66 | 1597 | 53.4 | FACS | Symbiont from marine sponge | Siegl et al. (2011) | |
| Cand. Nitrosoarchaeum limnia SFB1 | 1.690b | 95 | 26 | 136 | 32.4 | Microfluidics, laser tweezer | Ammonia‐oxidizing enrichment culture; sediment water, San Fransisco bay, USA | Blainey et al. (2011) |
Method validation using strain with known genome sequence.
Pooled sequence data from five individual cells; see Table 2.
An overview of an MDA set‐up using a microfluidic device is shown in Fig. 2, although FACS‐based methods are also often reported in literature (Rodrigue et al., 2009; Siegl and Hentschel, 2010). All DNA in the initial sample will be amplified, which renders the method very prone to DNA contamination. Another disadvantage of the initial method is uneven amplification of the genome, which results in high‐coverage sequencing of the amplified genomic regions while remaining sequences may not be sufficiently covered (Zhang et al., 2006). Marcy et al. (2007a) demonstrated that reducing MDA reaction volumes lowers non‐specific synthesis from contaminant DNA templates and unfavourable interactions between primers. The work of Rodrigue et al. (2009) demonstrated a biochemical method to normalize the products obtained in MDA reactions. They also discussed the problem of chimera formation linking non‐contiguous chromosomal regions in MDA (Dean et al., 2001; Zhang et al., 2006), which may hamper sequence assembly and render mate‐pair data less efficient in contig positioning. Several other single‐cell techniques are described in recent reviews by Wang and Bodovitz (2010), Kalisky and Quake (2011), and Pan et al. (2011). As data analysis from single‐cell amplified genomes is equally challenging, the software framework SmashCell has been developed to automate the main steps in sequence assembly, gene prediction, annotation and visualization (Harrington et al., 2010).
Figure 2.
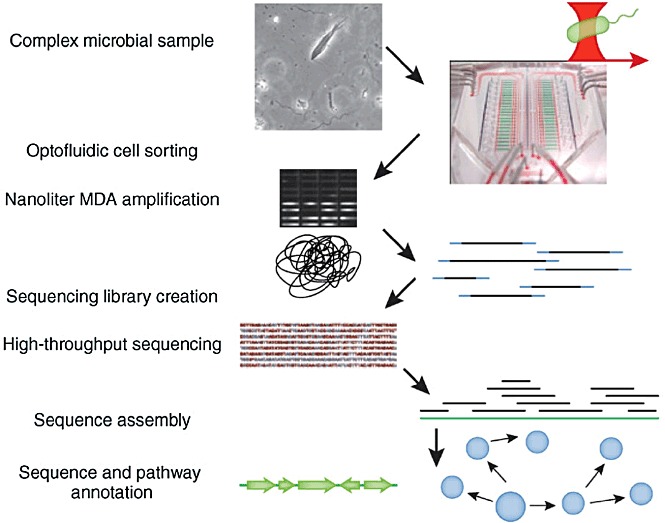
A mixture of cells sampled from a complex microbial ecosystem is introduced into the chip. Single cells are selected using an optical trap, and are sorted into chambers for cell lysis and genome amplification. Genomes are amplified in nanolitre MDA reactions to produce larger quantities of DNA (shown are SYBR Green–stained products in microfluidic reaction chambers). Sequencing libraries are created from the amplified genomic DNA for sequencing on a high‐throughput DNA sequencer. The sequence reads are assembled to recover the genome sequence, which is annotated to identify genes and pathways present in the original cell. Reprinted by permission from Macmillan Publishers Ltd: Nature Methods (Kalisky and Quake, 2011), copyright 2011. The microfluidics image was reprinted from Leslie (2011).
Single‐cell genome sequences of uncultured microorganisms
Examples of sequencing of single amplified genomes (SAGs) are listed in Table 1. Woyke et al. (2010) describe using a micro‐displacement technique to sequence a genome from an uncultured single cell of Candidatus Sulcia muelleri DMIN, a symbiont isolated from the bacteriome of the green sharpshooter Draeculacephala minerva. This polyploid bacterium has an estimated 200–900 genome copies per cell. Of the 57 Mb of sequence generated, approximately 90% was of contaminant origin, as estimated by mapping to a previously sequenced genome of Sulcia and phylogenetic analysis with blastx and MEGAN (Mitra et al., 2009). The remaining reads were assembled into a draft genome, misassemblies due to chimeras were corrected manually, and subsequent application of primer walking, sequencing PCR products and Illumina sequencing resulted in a final finished genome (Fig. 3).
Figure 3.
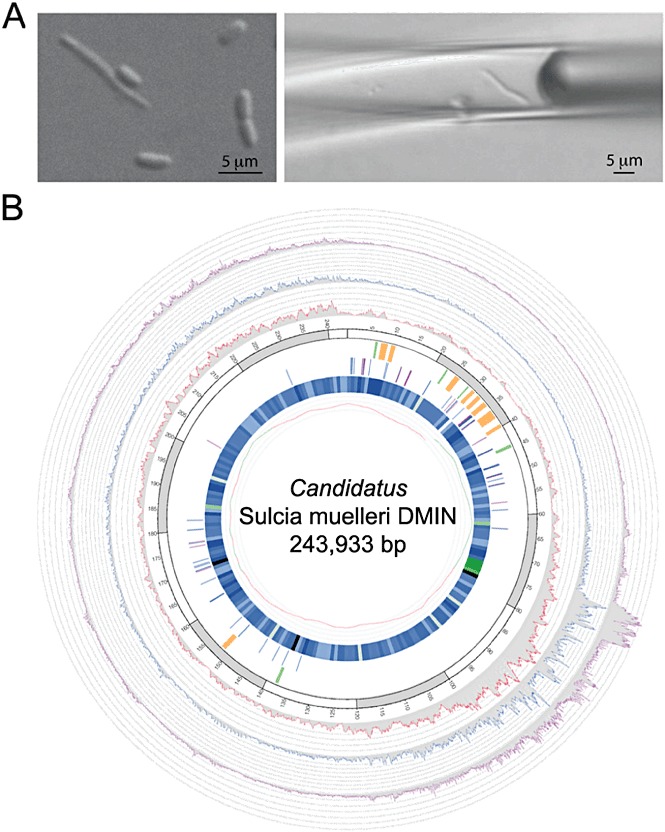
Sulcia cell isolation and sequence coverage, closure and polishing locations along the Sulcia DMIN single cell genome. A. Micromanipulation of the single Sulcia cell from the sharpshooter bacteriome metasample. B. Sequence coverage including closure and polishing locations along the finished, circular Sulcia DMIN. Reprinted from Woyke et al. (2010). For figure details see the original article.
Siegl et al. (2011) used FACS to isolate cells from the candidate phylum Poribacteria and subsequently MDA to obtain a SAG. These bacteria are almost exclusively found in marine sponges as symbionts and resist cultivation efforts. The SAG of 1.88 Mb was contained in 1597 contigs, which covered an estimated two‐thirds of the total genomic DNA based on the distribution of tRNA genes and their specificities found in the contigs. Nevertheless, a comprehensive overview of poribacterial metabolism could be deduced (Fig. 4). The extensive Sup‐type polyketide synthases found in the SAG of Poribacteria confirmed the previously proposed assignment of Sup‐PKS to this species. With the finding of a second putative PKS system showing high similarity to the lipopolysaccharide type I PKS WcbR from Nitrosomonas and Burkholderia, as well as RkpA from Sinorhizobium fredii, they suggested that Poribacteria contain at least two different types of PKS systems and their products may be involved in sponge–microbe interactions. This study showed that single‐cell genomics is highly capable of dissecting the genomic information from unculturable bacteria, shedding light on genomic organization, metabolic functions and possibly new insight in the debate on the origin of sponge bioactive compounds.
Figure 4.
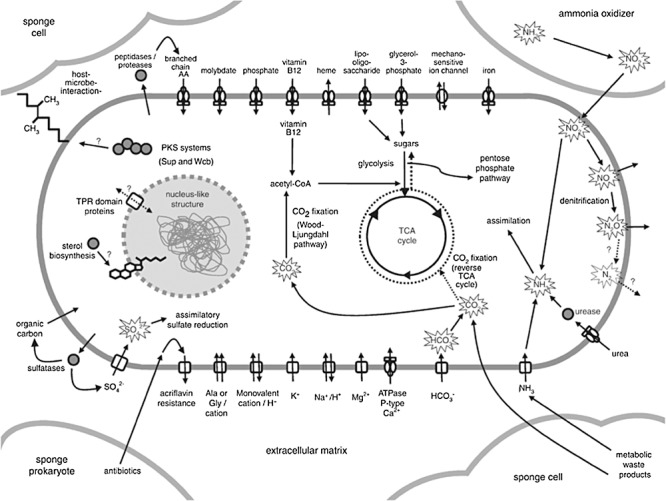
A schematic overview of poribacterial metabolism as deduced from SAG sequencing. Reprinted by permission from Macmillan Publishers Ltd: The ISME Journal (Siegl et al., 2011), copyright 2011.
Ammonia‐oxidizing archaea (AOA) are among the most abundant microbes on Earth, and may significantly impact global nitrogen and carbon cycles. Five single cells were isolated from a low‐salinity sediment AOA‐enrichment culture using a microfluidic device and laser tweezers, and DNA was amplified and sequenced separately from each cell (Blainey et al., 2011) (Tables 1 and 2). Individually, three single‐cell datasets gave assemblies of more than 1 Mb at sequencing depths of 10× to 30×, and an estimated 60% genomic coverage each; the low coverage is considered typical due to MDA amplification bias. Surprisingly, each of the single‐cell assemblies represented a different 60% of the target genome, and combining the five datasets led to a single‐cell assembly representing > 95% of the Nitrosoarchaeum limnia genome. Based on nucleotide identity comparisons, this AOA is proposed to represent a new genus of Crenarchaeota. In contrast to other described AOA, this low‐salinity archaeum appears to be motile, based on the presence of numerous motility and chemotaxis‐associated genes in the genome (Blainey et al., 2011).
Table 2.
Assembly statistics for sequencing of three single cells of Nitrosoarchaeum limnia SFB1, and consensus genome (reads from metagenome and five single cells).
| Assembly statistics | Cell 23 | Cell 21 | Cell 3 | Five single cells co‐assembly | Consensus single cells and metagenome |
|---|---|---|---|---|---|
| Raw read bases | 17 107 411 | 52 341 561 | 29 999 202 | 118 796 782 | 150 994 537 |
| Assembly bases | 1 094 113 | 1 039 820 | 1 041 604 | 1 690 404 | 1 769 573 |
| Scaffolds | 68 | 76 | 83 | 26 | 2 |
| Unscaffolded contigs | 287 | 177 | 265 | 110 | 29 |
| Estimated % genome coverage | 62 | 59 | 59 | 95 | 99 |
Adapted from Table 1 of Blainey et al. (2011).
Single‐cell transcriptomics, metabolomics and proteomics
Recent reports on single‐cell transcriptomics discuss mainly the analysis of polyadenylated mRNA of eukaryotes. A comprehensive overview of the technologies involved is given by Tang et al. (2011). In short, the single‐cell methods exploit reverse transcription using oligo(dT) primers to convert mRNAs with poly(A) tails into cDNAs, followed by uniform amplification and sequencing (RNA‐seq). However, currently no single‐cell analysis reports are known that exploit protocols for mRNA extraction from bacterial cells, for instance using the MessageAmp II‐Bacteria Kit (Ambion) as described by Frias‐Lopez et al. (2008). Single‐cell metabolome and proteome/peptidome analyses are still in their infancy, as these compounds cannot be amplified and their analysis requires technological breakthroughs in pushing the limits of detection (Rubakhin et al., 2011).
Future
Since the introduction of single‐cell genomics (Raghunathan et al., 2005), there have been surprisingly few reports of successful reconstruction of whole genomes from single unculturable bacterial cells (Table 1). This undoubtedly reflects the extreme difficulties in the various steps of single‐cell isolation, miniaturization, DNA amplification, avoidance of contamination and data analysis. Nevertheless, the pioneering examples show that it is definitely feasible to sequence genomes of single unculturable cells isolated from complex consortia, and we expect this approach to become more widespread as miniaturization technologies improve.
Recently, it has also been recognized that isogenic microbial populations (pure cultures) contain substantial cell‐to‐cell differences in physiological parameters such as growth rate, resistance to stress and regulatory circuit output (Ingham et al., 2008; Lidstrom and Konopka, 2010). In this light, adaptation of single‐cell genome sequencing using microfluidic approaches towards RNA‐seq transcriptome analysis of single cells using next‐generation mRNA sequencing should become increasingly important (Siezen et al., 2010).
Acknowledgments
This project was carried out within the research programmes of the Kluyver Centre for Genomics of Industrial Fermentation and the Netherlands Bioinformatics Centre, which are part of the Netherlands Genomics Initiative/Netherlands Organization for Scientific Research.
References
- Blainey P.C., Mosier A.C., Potanina A., Francis C.A., Quake S.R. Genome of a low‐salinity ammonia‐oxidizing archaeon determined by single‐cell and metagenomic analysis. PLoS ONE. 2011;6:e16626–e16626. doi: 10.1371/journal.pone.0016626. [DOI] [PMC free article] [PubMed] [Google Scholar]
- Bomar L., Maltz M., Colston S., Graf J. Directed culturing of microorganisms using metatranscriptomics. mBio. 2011;2:e00012–e00011. doi: 10.1128/mBio.00012-11. [DOI] [PMC free article] [PubMed] [Google Scholar]
- Dean F.B., Nelson J.R., Giesler T.L., Lasken R.S. Rapid amplification of plasmid and phage DNA using Phi 29 DNA polymerase and multiply‐primed rolling circle amplification. Genome Res. 2001;11:1095–1099. doi: 10.1101/gr.180501. [DOI] [PMC free article] [PubMed] [Google Scholar]
- Fouchet P., Jayat C., Héchard Y., Ratinaud M.H., Frelat G. Recent advances of flow cytometry in fundamental and applied microbiology. Biol Cell. 1993;78:95–109. doi: 10.1016/0248-4900(93)90120-4. [DOI] [PubMed] [Google Scholar]
- Frias‐Lopez J., Shi Y., Tyson G.W., Coleman M.L., Schuster S.C., Chisholm S.W., Delong E.F. Microbial community gene expression in ocean surface waters. Proc Natl Acad Sci USA. 2008;105:3805–3810. doi: 10.1073/pnas.0708897105. [DOI] [PMC free article] [PubMed] [Google Scholar]
- Harrington E.D., Arumugam M., Raes J., Bork P., Relman D.A. SmashCell: a software framework for the analysis of single‐cell amplified genome sequences. Bioinformatics. 2010;26:2979–2980. doi: 10.1093/bioinformatics/btq564. [DOI] [PMC free article] [PubMed] [Google Scholar]
- Holmes D.E., Chaudhuri S.K., Nevin K.P., Mehta T., Methé B.A., Liu A. Microarray and genetic analysis of electron transfer to electrodes in Geobacter sulfurreducens. Environ Microbiol. 2006;8:1805–1815. doi: 10.1111/j.1462-2920.2006.01065.x. et al. [DOI] [PubMed] [Google Scholar]
- Hosono S., Faruqi A.F., Dean F.B., Du Y., Sun Z., Wu X. Unbiased whole‐genome amplification directly from clinical samples. Genome Res. 2003;13:954–964. doi: 10.1101/gr.816903. et al. [DOI] [PMC free article] [PubMed] [Google Scholar]
- Ingham C.J., Beerthuyzen M., van Hylckama Vlieg J. Population heterogeneity of Lactobacillus plantarum WCFS1 microcolonies in response to and recovery from acid stress. Appl Environ Microbiol. 2008;74:7750–7758. doi: 10.1128/AEM.00982-08. [DOI] [PMC free article] [PubMed] [Google Scholar]
- Kalisky T., Quake S.R. Single‐cell genomics. Nature Methods. 2011;8:311–314. doi: 10.1038/nmeth0411-311. [DOI] [PubMed] [Google Scholar]
- Kvist T., Ahring B.K., Lasken R.S., Westermann P. Specific single‐cell isolation and genomic amplification of uncultured microorganisms. Appl Microbiol Biotechnol. 2007;74:926–935. doi: 10.1007/s00253-006-0725-7. [DOI] [PubMed] [Google Scholar]
- Leslie M. Single‐cell tech primer. Science (New York, NY) 2011;331:24–25. doi: 10.1126/science.331.6013.24-b. [DOI] [PubMed] [Google Scholar]
- Lidstrom M.E., Konopka M.C. The role of physiological heterogeneity in microbial population behavior. Nat Chem Biol. 2010;6:705–712. doi: 10.1038/nchembio.436. [DOI] [PubMed] [Google Scholar]
- Marcy Y., Ishoey T., Lasken R.S., Stockwell T.B., Walenz B.P., Halpern A.L. Nanoliter reactors improve multiple displacement amplification of genomes from single cells. PLoS Genet. 2007a;3:1702–1708. doi: 10.1371/journal.pgen.0030155. et al. [DOI] [PMC free article] [PubMed] [Google Scholar]
- Marcy Y., Ouverney C., Bik E.M., Lösekann T., Ivanova N., Martin H.G. Dissecting biological ‘dark matter’ with single‐cell genetic analysis of rare and uncultivated TM7 microbes from the human mouth. Proc Natl Acad Sci USA. 2007b;104:11889–11894. doi: 10.1073/pnas.0704662104. et al. [DOI] [PMC free article] [PubMed] [Google Scholar]
- Mitra S., Klar B., Huson D.H. Visual and statistical comparison of metagenomes. Bioinformatics (Oxford, England) 2009;25:1849–1855. doi: 10.1093/bioinformatics/btp341. [DOI] [PubMed] [Google Scholar]
- Müller S., Nebe‐von‐Caron G. Functional single‐cell analyses: flow cytometry and cell sorting of microbial populations and communities. FEMS Microbiol Rev. 2010;34:554–587. doi: 10.1111/j.1574-6976.2010.00214.x. [DOI] [PubMed] [Google Scholar]
- Pan X.‐H., Zhu H.‐Y., Marjani S.L. Technological advances in single‐cell genomic analyses. Yi Chuan. 2011;33:17–24. doi: 10.3724/sp.j.1005.2011.00017. [DOI] [PubMed] [Google Scholar]
- Podar M., Abulencia C.B., Walcher M., Hutchison D., Zengler K., Garcia J.A. Targeted access to the genomes of low‐abundance organisms in complex microbial communities. Appl Environ Microbiol. 2007;73:3205–3214. doi: 10.1128/AEM.02985-06. et al. [DOI] [PMC free article] [PubMed] [Google Scholar]
- Raghunathan A., Ferguson H.R., Jr, Bornarth C.J., Song W., Driscoll M., Lasken R.S. Genomic DNA amplification from a single bacterium. Appl Environ Microbiol. 2005;71:3342–3347. doi: 10.1128/AEM.71.6.3342-3347.2005. [DOI] [PMC free article] [PubMed] [Google Scholar]
- Rodrigue S., Malmstrom R.R., Berlin A.M., Birren B.W., Henn M.R., Chisholm S.W. Whole genome amplification and de novo assembly of single bacterial cells. PLoS ONE. 2009;4:e6864–e6864. doi: 10.1371/journal.pone.0006864. [DOI] [PMC free article] [PubMed] [Google Scholar]
- Rubakhin S.S., Romanova E.V., Nemes P., Sweedler J.V. Profiling metabolites and peptides in single cells. Nat Methods. 2011;8:S20–S29. doi: 10.1038/nmeth.1549. [DOI] [PMC free article] [PubMed] [Google Scholar]
- Siegl A., Hentschel U. PKS and NRPS gene clusters from microbial symbiont cells of marine sponges by whole genome amplification. Environ Microbiol Rep. 2010;2:507–513. doi: 10.1111/j.1758-2229.2009.00057.x. [DOI] [PubMed] [Google Scholar]
- Siegl A., Kamke J., Hochmuth T., Piel J., Richter M., Liang C. Single‐cell genomics reveals the lifestyle of Poribacteria, a candidate phylum symbiotically associated with marine sponges. ISME J. 2011;5:61–70. doi: 10.1038/ismej.2010.95. et al. [DOI] [PMC free article] [PubMed] [Google Scholar]
- Siezen R.J., Wilson G., Todt T. Prokaryotic whole‐transcriptome analysis: deep sequencing and tiling arrays. Microb Biotechnol. 2010;3:125–130. doi: 10.1111/j.1751-7915.2010.00166.x. [DOI] [PMC free article] [PubMed] [Google Scholar]
- Tang F., Lao K., Surani M.A. Development and applications of single‐cell transcriptome analysis. Nat Methods. 2011;8:S6–S11. doi: 10.1038/nmeth.1557. [DOI] [PMC free article] [PubMed] [Google Scholar]
- Wang D., Bodovitz S. Single cell analysis: the new frontier in ‘omics’. Trends Biotechnol. 2010;28:281–290. doi: 10.1016/j.tibtech.2010.03.002. [DOI] [PMC free article] [PubMed] [Google Scholar]
- Wang Y., Hammes F., De Roy K., Verstraete W., Boon N. Past, present and future applications of flow cytometry in aquatic microbiology. Trends Biotechnol. 2010;28:416–424. doi: 10.1016/j.tibtech.2010.04.006. [DOI] [PubMed] [Google Scholar]
- Woyke T., Xie G., Copeland A., Gonzalez J.M., Han C., Kiss H. Assembling the marine metagenome, one cell at a time. PLoS ONE. 2009;4:e5299. doi: 10.1371/journal.pone.0005299. et al. [DOI] [PMC free article] [PubMed] [Google Scholar]
- Woyke T., Tighe D., Mavromatis K., Clum A., Copeland A., Schackwitz W. One bacterial cell, one complete genome. PLoS ONE. 2010;5:e10314–e10314. doi: 10.1371/journal.pone.0010314. et al. [DOI] [PMC free article] [PubMed] [Google Scholar]
- Zhang K., Martiny A.C., Reppas N.B., Barry K.W., Malek J., Chisholm S.W., Church G.M. Sequencing genomes from single cells by polymerase cloning. Nat Biotechnol. 2006;24:680–686. doi: 10.1038/nbt1214. [DOI] [PubMed] [Google Scholar]